Johnson Lane, NV (Nevada) Houses and Residents
| Johnson Lane: | $752,178 |
| Nevada: | $434,700 |
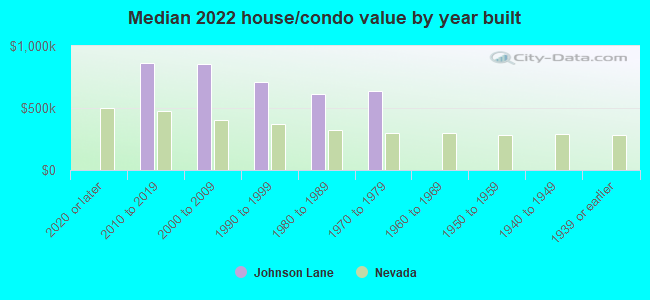
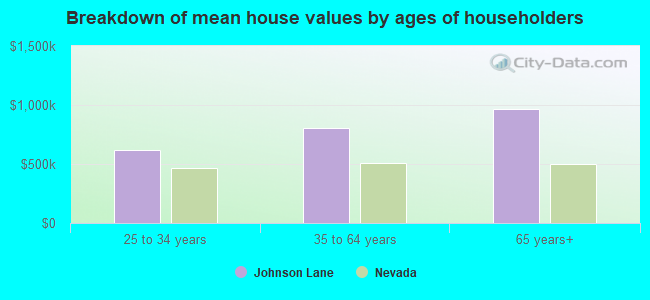
Mean price in 2022:
Detached houses: $806,663
Here: $806,663 State: $549,327 Townhouses or other attached units: $633,729
Here: $633,729 State: $328,893
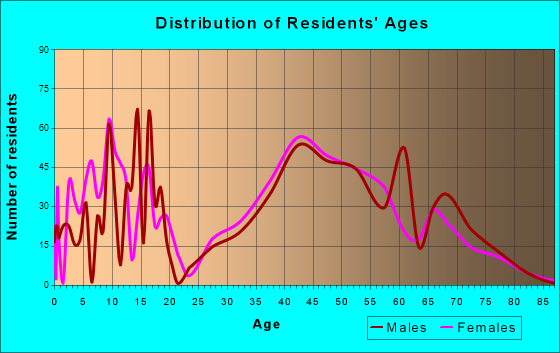
Total population: 6,490 (Urban population: 3,909, Rural population: 855 (19 farm, 836 nonfarm))
Houses: 2,879 (2,735 occupied: 2,559 owner occupied, 171 renter occupied)
| % of renters here: | 6% |
| State: | 40% |
Housing density: 135 houses/condos per square mile
Median price asked for vacant for-sale houses and condos in 2022 in this county: $629,655.
Median contract rent in 2022: $1,760
Median rent asked for vacant for-rent units in 2022: $1,238
Median gross rent in Johnson Lane, NV in 2022: $1,824
Housing units in Johnson Lane with a mortgage: 1,770 (170 second mortgage, 0 home equity loan, 165 both second mortgage and home equity loan)
Houses without a mortgage: 51
Median household income for houses/condos with a mortgage: $120,900
Median household income for apartments without a mortgage: $83,826
Median monthly housing costs: $1,751
Compare current foreclosures near Johnson Lane, NV:
| Photo | Address | Area | Beds / Baths | Price | Details |
|---|---|---|---|---|---|

|
#1
Tamarisk St
Carson City, NV 89701
|
1,080 sq. feet
|
2 baths 3 beds |
show details | |

|
#2
Ralph Dr
South Lake Tahoe, CA 96150
|
1,014 sq. feet
|
1 baths 3 beds |
show details | |

|
#3
S Roop St
Carson City, NV 89701
|
1,512 sq. feet
|
2 baths 4 beds |
show details | |

|
#4
Yukon Ct
Carson City, NV 89706
|
1,825 sq. feet
|
2 baths 3 beds |
show details | |

|
#5
Maple Creek Ln
Carson City, NV 89701
|
1,768 sq. feet
|
2 baths 4 beds |
show details | |

|
#6
Village Dr
Carson City, NV 89701
|
2,256 sq. feet
|
3 baths 6 beds |
show details | |

|
#7
Allouette Way Apt 2
Carson City, NV 89701
|
1,160 sq. feet
|
2 baths 3 beds |
show details | |

|
#8
Sonoma St
Carson City, NV 89701
|
2,513 sq. feet
|
2 baths 5 beds |
show details | |

|
#9
Orovada Dr
Carson City, NV 89701
|
2,031 sq. feet
|
2 baths 3 beds |
show details | |

|
#10
Ponderosa Dr
Carson City, NV 89701
|
1,421 sq. feet
|
2 baths 3 beds |
show details |
| Photo | Address | Area | Beds / Baths | Price | Details |
|---|---|---|---|---|---|

|
#11
Ponderosa Dr
Carson City, NV 89701
|
1,421 sq. feet
|
2 baths 3 beds |
show details | |

|
#12
Cortez St
Carson City, NV 89701
|
1,260 sq. feet
|
2 baths 3 beds |
show details | |

|
#13
Kingsley Ln
Carson City, NV 89701
|
1,176 sq. feet
|
2 baths 3 beds |
show details | |

|
#14
Jeanette Dr
Carson City, NV 89706
|
1,326 sq. feet
|
2 baths 3 beds |
show details | |

|
#15
W Applegate Way
Carson City, NV 89706
|
1,536 sq. feet
|
1 baths 3 beds |
show details | |

|
#16
August Dr
Carson City, NV 89706
|
1,306 sq. feet
|
2 baths 3 beds |
show details | |

|
#17
Ralph Dr
South Lake Tahoe, CA 96150
|
1,014 sq. feet
|
1 baths 3 beds |
show details | |

|
#18
Colorado St
Carson City, NV 89701
|
2,236 sq. feet
|
3 baths 4 beds |
show details | |

|
#19
Beecher Ave
South Lake Tahoe, CA 96150
|
1,594 sq. feet
|
2 baths 3 beds |
show details | |

|
#20
Hunkpapa St
South Lake Tahoe, CA 96150
|
1,894 sq. feet
|
2 baths 3 beds |
show details |
| Photo | Address | Area | Beds / Baths | Price | Details |
|---|---|---|---|---|---|

|
#21
Royal Ave
South Lake Tahoe, CA 96150
|
1,647 sq. feet
|
2 baths 2 beds |
show details | |

|
#22
Gordon St
Carson City, NV 89701
|
1,914 sq. feet
|
4 baths 4 beds |
show details | |

|
#23
Dana Ct
South Lake Tahoe, CA 96150
|
1,556 sq. feet
|
2 baths 3 beds |
show details | |

|
#24
Eastridge Ln
Carson City, NV 89706
|
1,440 sq. feet
|
2 baths 4 beds |
show details | |

|
#25
Sherman Ln
Carson City, NV 89706
|
1,706 sq. feet
|
2 baths 3 beds |
show details | |

|
#26
Conte Dr
Carson City, NV 89701
|
1,923 sq. feet
|
2 baths 4 beds |
show details | |

|
#27
Koontz Ln
Carson City, NV 89701
|
1,809 sq. feet
|
2 baths 3 beds |
show details | |

|
#28
Jamie Way
Carson City, NV 89701
|
1,548 sq. feet
|
2 baths 2 beds |
show details | |

|
#29
Knox Ave
South Lake Tahoe, CA 96150
|
1,744 sq. feet
|
2 baths 4 beds |
show details | |

|
#30
Modesto Ave
South Lake Tahoe, CA 96150
|
1,221 sq. feet
|
2 baths 3 beds |
show details |
| Photo | Address | Area | Beds / Baths | Price | Details |
|---|---|---|---|---|---|

|
#31
Rancho Way
South Lake Tahoe, CA 96150
|
1,440 sq. feet
|
2 baths 3 beds |
show details | |

|
#32
Valley View Dr
Carson City, NV 89701
|
2,503 sq. feet
|
2 baths 3 beds |
show details | |

|
#33
Molly Dr
Carson City, NV 89706
|
870 sq. feet
|
1 baths 2 beds |
show details | |

|
#34
College Pkwy Apt 35
Carson City, NV 89706
|
- sq. feet
|
- baths - beds |
show details | |

|
#35
Fuller Ave
Minden, NV 89423
|
1,758 sq. feet
|
- baths - beds |
show details | |

|
#36
College Pkwy Apt 11
Carson City, NV 89706
|
- sq. feet
|
- baths - beds |
show details | |

|
#37
W Nye Ln Ste 201
Carson City, NV 89703
|
- sq. feet
|
- baths - beds |
show details | |

|
#38
Hot Springs Rd Apt 202
Carson City, NV 89706
|
- sq. feet
|
- baths - beds |
show details | |

|
#39
Hot Springs Rd Apt 8
Carson City, NV 89706
|
- sq. feet
|
- baths - beds |
show details | |

|
#40
Joette Dr
Gardnerville, NV 89460
|
1,876 sq. feet
|
- baths - beds |
show details |
| Photo | Address | Area | Beds / Baths | Price | Details |
|---|---|---|---|---|---|

|
#41
W Nye Ln Ste 129
Carson City, NV 89706
|
- sq. feet
|
- baths - beds |
show details | |

|
#42
Elks Pt Rd
Zephyr Cove, NV 89448
|
- sq. feet
|
- baths - beds |
show details | |

|
#43
Patricia Dr
Gardnerville, NV 89460
|
- sq. feet
|
- baths - beds |
show details | |

|
#44
Mark St
Gardnerville, NV 89410
|
1,917 sq. feet
|
- baths - beds |
show details | |

|
#45
Barton Ave # B1
South Lake Tahoe, CA 96150
|
- sq. feet
|
- baths - beds |
show details | |

|
#46
Us Highway 50 E
Dayton, NV 89403
|
- sq. feet
|
- baths - beds |
show details | |

|
#47
Coral Way
Dayton, NV 89403
|
- sq. feet
|
- baths - beds |
show details | |

|
#48
Pinewood Dr
South Lake Tahoe, CA 96150
|
- sq. feet
|
- baths - beds |
show details | |

|
#49
Sandy Way # 14
South Lake Tahoe, CA 96150
|
- sq. feet
|
- baths - beds |
show details | |

|
Check over 1 million property listings on Foreclosure.com!
|
browse all offers | |||


 | Carson City and Henderson-Top Retirement Cities? (195 replies) |
| Minden/Gardnerville - HOAs and any major concerns? (43 replies) |
| Building in the VC Highlands? (16 replies) |
| Looking For Subdivision/Housing Recs (16 replies) |
| Families who moved to Reno (17 replies) |
| Carson City area humity. In Winter (12 replies) |
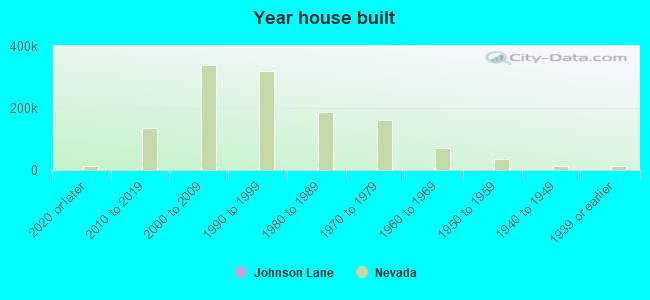
Median year apartment built: 1996
Household type by relationship:
Households: 6,651- Male householders: 1,590 (170 living alone), Female householders: 1,123 (277 living alone)
1,869 spouses (1,869 opposite-sex spouses), 111 unmarried partners, (111 opposite-sex unmarried partners), 1,426 children (1,371 natural, 9 adopted, 46 stepchildren), 79 grandchildren, 106 brothers or sisters, 145 parents, 0 foster children, 25 other relatives, 171 non-relatives
Size of family households: 1,554 2-persons, 341 3-persons, 200 4-persons, 56 5-persons, 28 6-persons, 51 7-or-more-persons.
Size of nonfamily households: 444 1-person, 73 2-persons.
732 married couples with children.
55 single-parent households (21 men, 34 women).
93.1% of residents of Johnson Lane speak English at home.
7.4% of residents speak Spanish at home (77% speak English very well, 7% speak English well, 16% speak English not well).
0.2% of residents speak other Indo-European language at home (100% speak English very well).
Foreign born population: 216 (3.2%)
(102.3% of them are naturalized citizens)
| Here: | 6.2 |
| State: | 6.0 |
| Here: | 4.0 |
| State: | 4.2 |
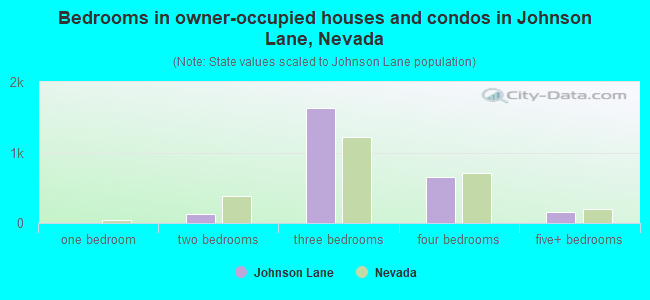
- Bedrooms in owner-occupied houses and condos in Johnson Lane, Nevada
- 0no bedroom
- 01 bedroom
- 1302 bedrooms
- 1,6253 bedrooms
- 6484 bedrooms
- 1575+ bedrooms
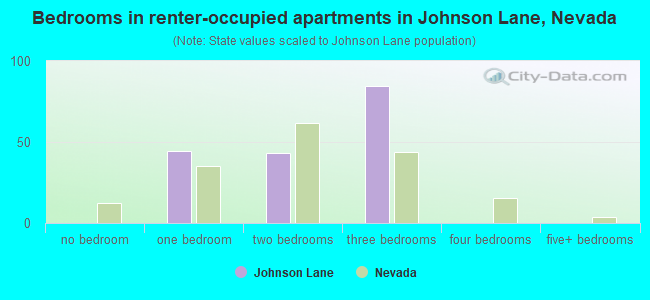
- Bedrooms in renter-occupied apartments in Johnson Lane, Nevada
- 0no bedroom
- 441 bedroom
- 432 bedrooms
- 843 bedrooms
- 04 bedrooms
- 05+ bedrooms
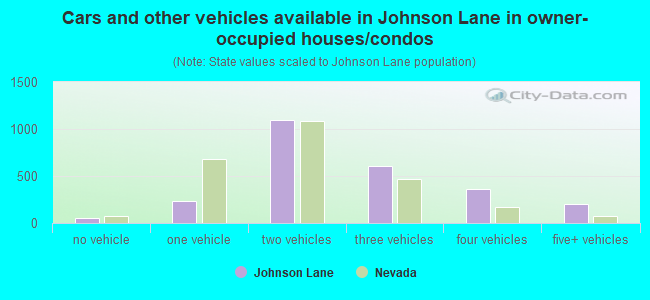
- Cars and other vehicles available in Johnson Lane in owner-occupied houses/condos
- 56no vehicle
- 2331 vehicle
- 1,0992 vehicles
- 6103 vehicles
- 3574 vehicles
- 2055+ vehicles
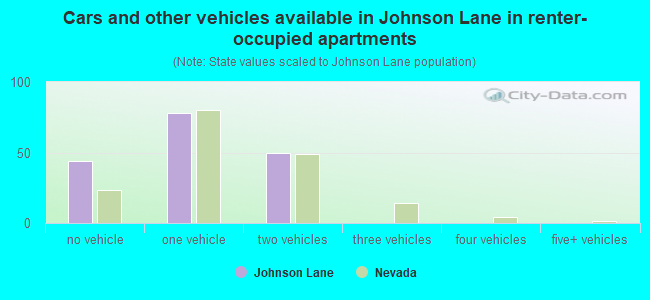
- Cars and other vehicles available in Johnson Lane in renter-occupied apartments
- 44no vehicle
- 781 vehicle
- 492 vehicles
- 03 vehicles
- 04 vehicles
- 05+ vehicles
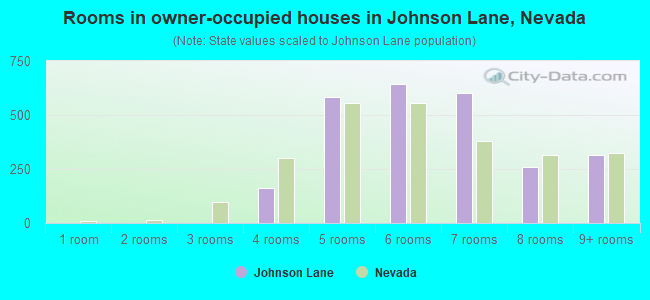
- Rooms in owner-occupied houses in Johnson Lane, Nevada
- 01 room
- 02 rooms
- 03 rooms
- 1614 rooms
- 5845 rooms
- 6436 rooms
- 6007 rooms
- 2578 rooms
- 3149+ rooms
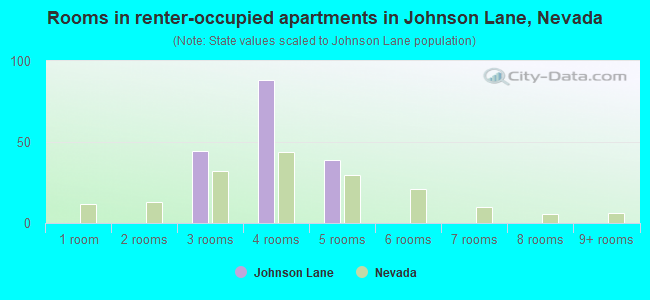
- Rooms in renter-occupied apartments in Johnson Lane, Nevada
- 01 room
- 02 rooms
- 443 rooms
- 894 rooms
- 395 rooms
- 06 rooms
- 07 rooms
- 08 rooms
- 09+ rooms
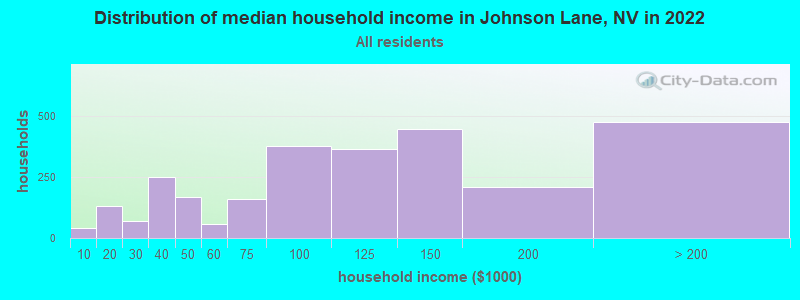
Johnson Lane, NV household income distribution

- 42Less than $10,000
- 132$10,000 to $19,999
- 68$20,000 to $29,999
- 250$30,000 to $39,999
- 166$40,000 to $49,999
- 59$50,000 to $59,999
- 159$60,000 to $74,999
- 375$75,000 to $99,999
- 363$100,000 to $124,999
- 447$125,000 to $149,999
- 207$150,000 to $199,999
- 474$200,000 or more
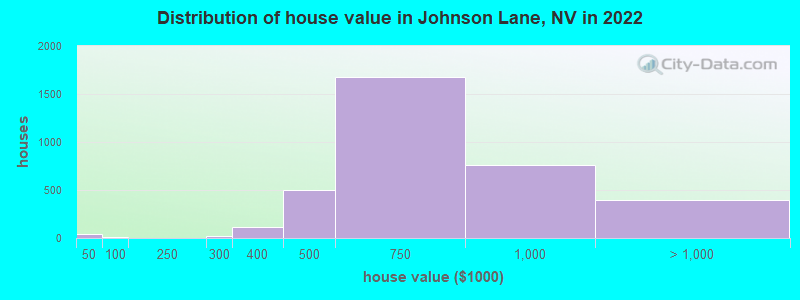
Home value of owner - occupied houses in 2022 in Johnson Lane, NV
-
- 33Less than $10,000
- 11$40,000 to $49,999
- 23$250,000 to $299,999
- 111$300,000 to $399,999
- 504$400,000 to $499,999
- 1,675$500,000 to $749,999
- 761$750,000 to $999,999
- 375$1,000,000 to $1,499,999
- 17$2,000,000 or more
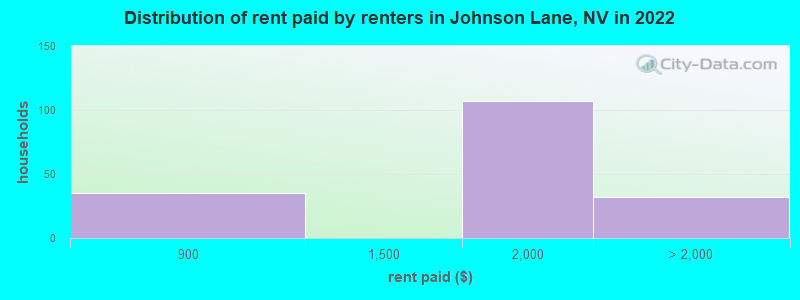
Rent paid by renters in 2022 in Johnson Lane, NV
-
- 34$800 to $899
- 106$1,500 to $1,999
- 31No cash rent
Percentage of workers working in this county: 49.8%
Number of people working at home: 182 (7.0% of all workers)
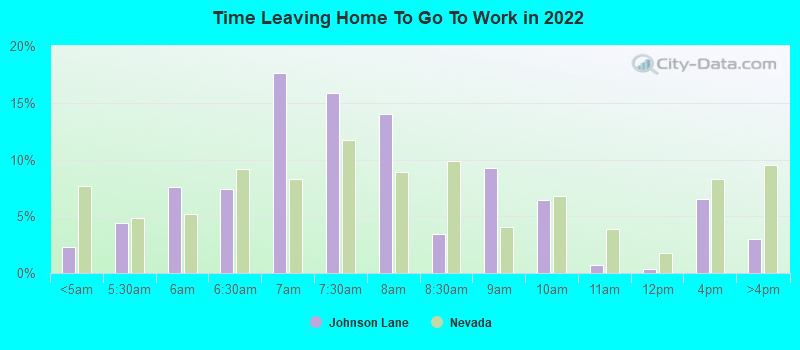
Travel time to work (commute)
- Less than 5 minutes: 0
- 5 to 9 minutes: 212
- 10 to 14 minutes: 211
- 15 to 19 minutes: 543
- 20 to 24 minutes: 355
- 25 to 29 minutes: 239
- 30 to 34 minutes: 232
- 35 to 39 minutes: 53
- 40 to 44 minutes: 36
- 45 to 59 minutes: 296
- 60 to 89 minutes: 192
- 90 or more minutes: 18
Means of transportation to work:
- Drove a car alone: 1,789 (87.0%)
- Carpooled: 121 (5.9%)
- Motorcycle: 9 (0.4%)
- Other means: 41 (2.0%)
- Worked at home: 96 (4.7%)
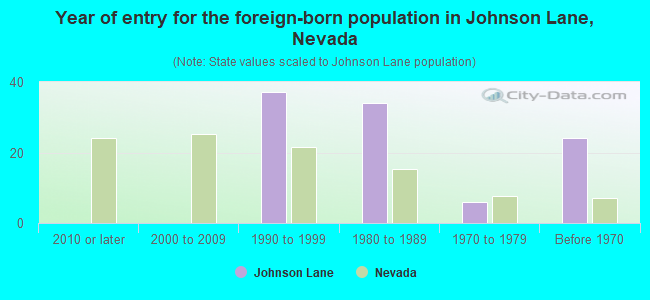
- Year of entry for the foreign-born population in Johnson Lane, Nevada
- 02010 or later
- 02000 to 2009
- 371990 to 1999
- 341980 to 1989
- 61970 to 1979
- 24Before 1970
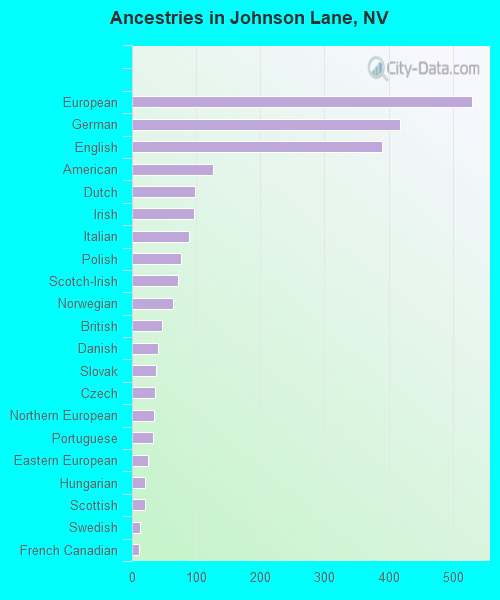
First ancestries reported:
- European: 530 (17.8%)
- German: 417 (14.0%)
- English: 389 (13.1%)
- American: 127 (4.3%)
- Dutch: 98 (3.3%)
- Irish: 97 (3.3%)
- Italian: 89 (3.0%)
- Polish: 76 (2.5%)
- Scotch-Irish: 72 (2.4%)
- Norwegian: 64 (2.1%)
- British: 46 (1.5%)
- Danish: 41 (1.4%)
- Slovak: 37 (1.2%)
- Czech: 36 (1.2%)
- Northern European: 34 (1.1%)
- Portuguese: 33 (1.1%)
- Eastern European: 25 (0.8%)
- Hungarian: 21 (0.7%)
- Scottish: 21 (0.7%)
- Swedish: 13 (0.4%)
- French Canadian: 11 (0.4%)
Most common places of birth for foreign-born residents (%):
| Johnson Lane: | 68.5% (148) |
| Nevada: | 36.8% (218,248) |
| Johnson Lane: | 14.8% (32) |
| Nevada: | 0.1% (786) |
| Johnson Lane: | 6.9% (15) |
| Nevada: | 1.0% (5,738) |
| Johnson Lane: | 3.7% (8) |
| Nevada: | 0.2% (946) |
Place of birth for U.S.-born residents:
- This state: 778
- Other state: 5,609
- Northeast: 450
- Midwest: 562
- South: 554
- West: 4,076
87.4% of Johnson Lane residents lived in the same house 1 years ago.
Out of people who lived in different houses, 25.9% lived in this county.
Out of people who lived in different counties, 15.8% lived in Nevada.
| Johnson Lane: | 87.4% |
| State average: | 86.4% |
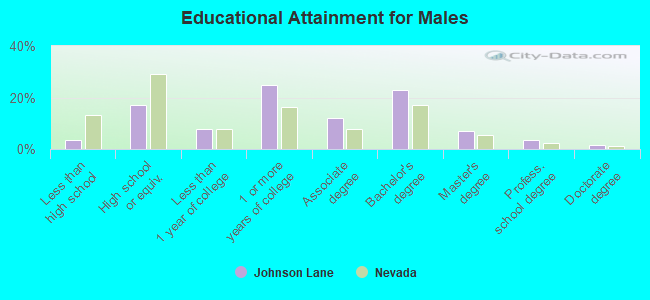
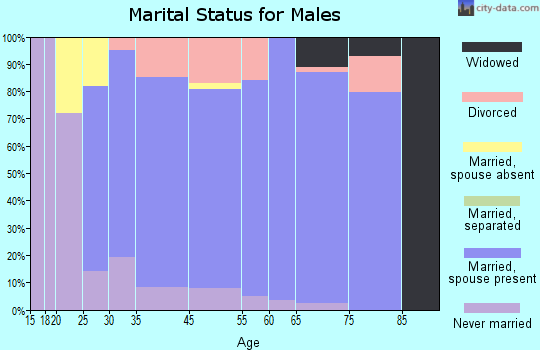
Education attainment for males 25 years and older:
- No schooling: 0
- Nursery to 4th grade: 0
- 5th and 6th grade: 0
- 7th and 8th grade: 0
- 9th grade: 0
- 10th grade: 29
- 11th grade: 15
- 12th grade, no diploma: 44
- High school graduate (or equivalency): 421
- Less than 1 year of college: 190
- Some college more than 1 year, no degree: 617
- Associate degree: 302
- Bachelor's degree: 565
- Master's degree: 176
- Professional school degree: 91
- Doctorate degree: 36
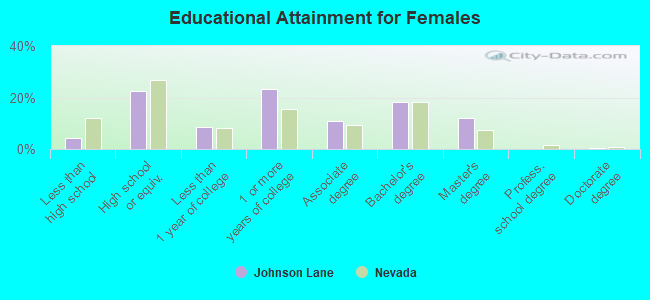
Education attainment for females 25 years and older:
- No schooling: 10
- Nursery to 4th grade: 0
- 5th and 6th grade: 35
- 7th and 8th grade: 34
- 9th grade: 0
- 10th grade: 0
- 11th grade: 24
- 12th grade, no diploma: 11
- High school graduate (or equivalency): 625
- Less than 1 year of college: 238
- Some college more than 1 year, no degree: 654
- Associate degree: 298
- Bachelor's degree: 514
- Master's degree: 331
- Professional school degree: 0
- Doctorate degree: 13
Housing units in structures:
- One, detached: 2,663
- One, attached: 118
- Two: 53
- 5 to 9: 44
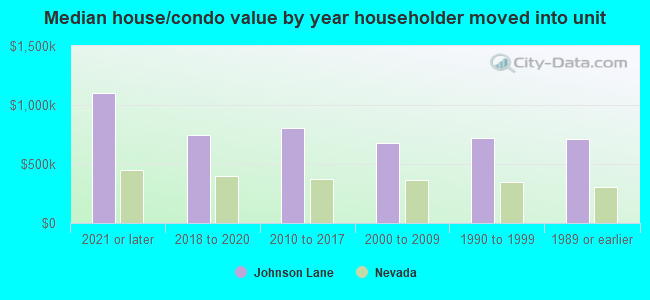
House/condo owner moved in on average 10 years ago
Renter moved in on average 1 years ago
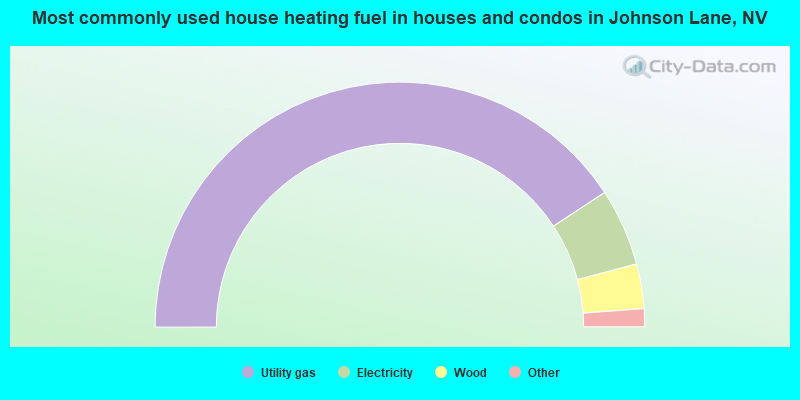
- 81.6%Utility gas
- 10.2%Electricity
- 5.9%Wood
- 1.6%Bottled, tank, or LP gas
- 0.8%Fuel oil, kerosene, etc.
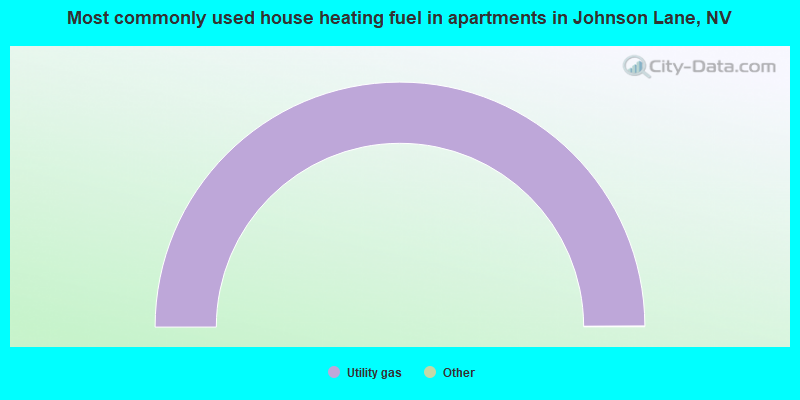
- 100.0%Utility gas
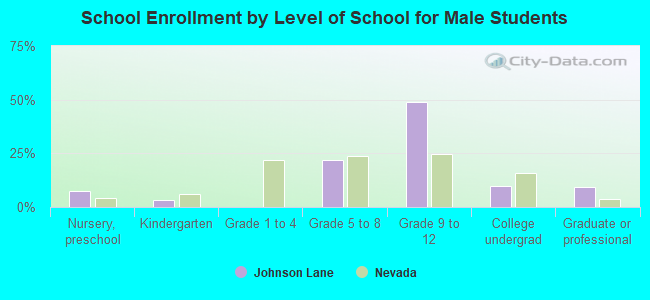
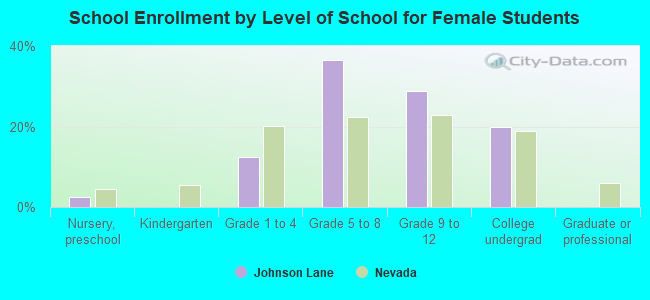
Private vs. public school enrollment:
| Here: | 0.0% |
| Nevada: | 12.9% |
| Here: | 0.0% |
| Nevada: | 6.9% |
| Here: | 42.0% |
| Nevada: | 16.0% |