Johnston, IA (Iowa) Houses and Residents
Estimated median house or condo value in 2022: $361,050 (it was $187,400 in 2000 )
Johnston:
$361,050Iowa:
$194,600
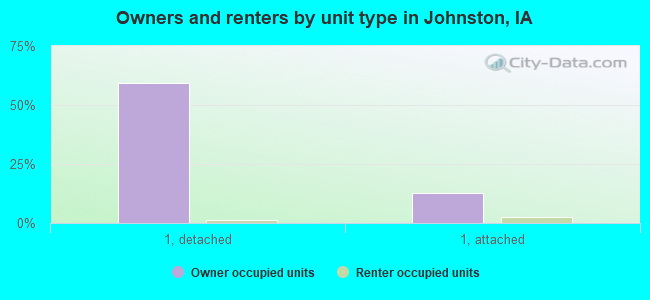
Lower value quartile - upper value quartile: $265,867 - $473,883Mean price in 2022: Detached houses: $461,019 Here:
$461,019State:
$245,224
Townhouses or other attached units: $225,221 Here:
$225,221State:
$238,767
In 5-or-more-unit structures: $124,709 Here:
$124,709State:
$190,519
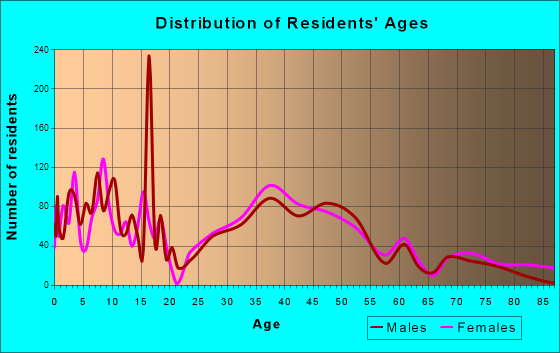
Total population: 20,359 (Urban population: 8,167, Rural population: 658 (all nonfarm) )
Houses: 9,930 (9,591 occupied: 6,851 owner occupied, 2,789 renter occupied )
% of renters here:
29%State:
28%
Housing density: 692 houses/condos per square mile
Median price asked for vacant for-sale houses and condos in 2022: $332,361.
Median contract rent in 2022: $1,137 (lower quartile is $969, upper quartile is $1,371)
Median rent asked for vacant for-rent units in 2022: $1,492
Median gross rent in Johnston, IA in 2022: $1,207
Housing units in Johnston with a mortgage: 4,980 (673 second mortgage, 18 home equity loan, 576 both second mortgage and home equity loan )Houses without a mortgage: 46
Median household income for houses/condos with a mortgage: $157,943
Median household income for apartments without a mortgage: $95,283
Median monthly housing costs: $1,481
Data:
Median house or condo value ($)
Median house or condo value ($ change since 2000)
Median house or condo value ($) - White
Median house or condo value ($) - Black or African American
Median house or condo value ($) - Asian
Median house or condo value ($) - Hispanic or Latino
Median house or condo value ($) - American Indian and Alaska Native
Median house or condo value ($) - Multirace
Median house or condo value ($) - Other Race
Median price asked for mobile homes ($)
Household density (households per square mile)
Mean house or condo value by units in structure - 1, detached ($)
Mean house or condo value by units in structure - 1, attached ($)
Mean house or condo value by units in structure - 2 ($)
Mean house or condo value by units in structure by units in structure - 3 or 4 ($)
Mean house or condo value by units in structure - 5 or more ($)
Mean house or condo value by units in structure - Boat, RV, van, etc. ($)
Mean house or condo value by units in structure - Mobile home ($)
Median contract rent ($)
Median contract rent - Lower quartile ($)
Median contract rent - Upper quartile ($)
Median gross rent ($)
Urban houses (%)
Rural houses (%)
Houses occupied (%)
Houses occupied (% change since 2000)
Houses owner occupied (%)
Houses owner occupied (% change since 2000)
Houses renter occupied (%)
Houses renter occupied (% change since 2000)
Vacant housing units - For rent (%)
Vacant housing units - For rent (% change since 2000)
Vacant housing units - For sale only (%)
Vacant housing units - For sale only (% change since 2000)
Vacant housing units - Rented or sold, not occupied (%)
Vacant housing units - Rented or sold, not occupied (% change since 2000)
Vacant housing units - For seasonal, recreational, or occasional use (%)
Vacant housing units - For seasonal, recreational, or occasional use (% change since 2000)
Vacant housing units - For migrant workers (%)
Vacant housing units - For migrant workers (% change since 2000)
Vacant housing units - Other vacant (%)
Vacant housing units - Other vacant (% change since 2000)
Median monthly housing costs ($)
Median household income for houses/condos with a mortgage ($)
Median household income for houses/condos without a mortgage ($)
Median household income ($)
Median household income ($) - White
Median household income ($) - Black or African American
Median household income ($) - Asian
Median household income ($) - Hispanic or Latino
Median household income ($) - American Indian and Alaska Native
Median household income ($) - Multirace
Median household income ($) - Other Race
Mortgage status - with mortgage (%)
Mortgage status - with second mortgage (%)
Mortgage status - with home equity loan (%)
Mortgage status - with both second mortgage and home equity loan (%)
Mortgage status - without a mortgage (%)
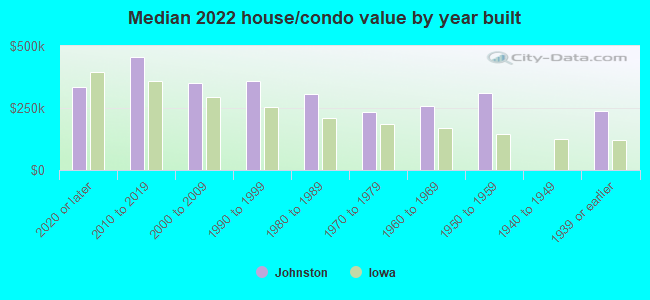
Median year house/condo built
Median year apartment built
Household type by relationship - Male householder living alone (%)
Household type by relationship - Male householder not living alone (%)
Household type by relationship - Female householder living alone (%)
Household type by relationship - Female householder not living alone (%)
Household type by relationship - Opposite-Sex spouse (%)
Household type by relationship - Same-Sex spouse (%)
Household type by relationship - Opposite-Sex unmarried partner (%)
Household type by relationship - Same-Sex unmarried partner (%)
Household type by relationship - In group quarters (%)
Size of family households - 2-person household (%)
Size of family households - 3-person household (%)
Size of family households - 4-person household (%)
Size of family households - 5-person household (%)
Size of family households - 6-person household (%)
Size of family households - 7-or-more-person household (%)
Size of nonfamily households - 1-person household (%)
Size of nonfamily households - 2-person household (%)
Size of nonfamily households - 3-person household (%)
Size of nonfamily households - 4-person household (%)
Size of nonfamily households - 5-person household (%)
Size of nonfamily households - 6-person household (%)
Size of nonfamily households - 7-or-moreperson household (%)
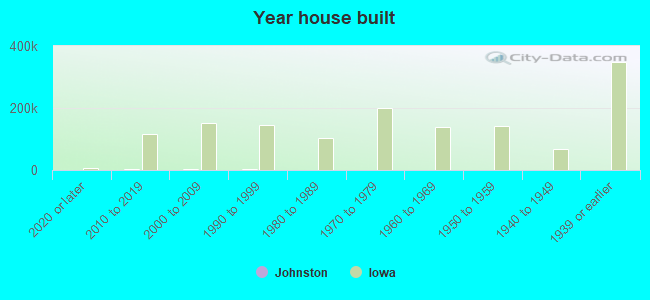
Year house built - Built 2010 or later (%)
Year house built - Built 2000 to 2009 (%)
Year house built - Built 1990 to 1999 (%)
Year house built - Built 1980 to 1989 (%)
Year house built - Built 1970 to 1979 (%)
Year house built - Built 1960 to 1969 (%)
Year house built - Built 1950 to 1959 (%)
Year house built - Built 1940 to 1949 (%)
Year house built - Built 1939 or earlier (%)
Median number of rooms in houses and condos
Median number of rooms in apartments
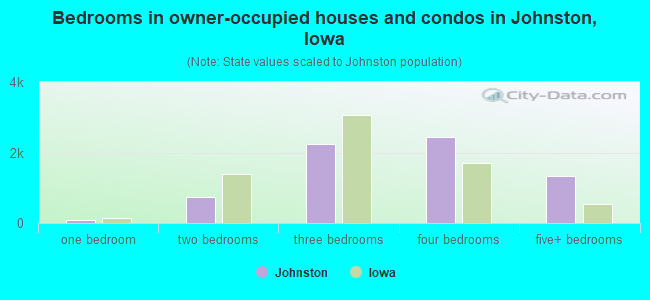
Median number of bedrooms in owner occupied houses
Mean number of bedrooms in owner occupied houses
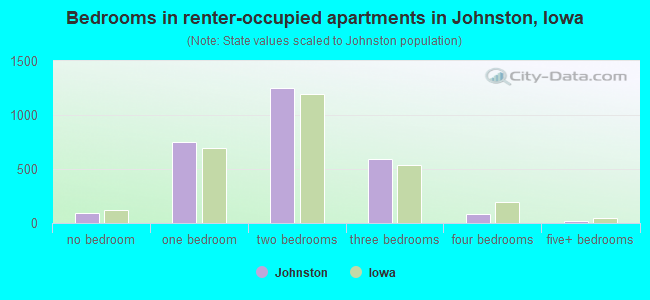
Median number of bedrooms in renter occupied houses
Mean number of bedrooms in renter occupied houses
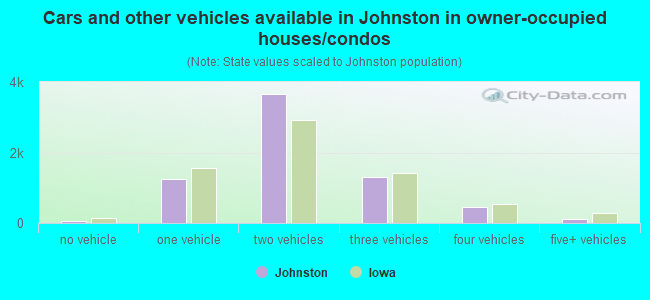
Median number of vehichles in owner occupied houses
Mean number of vehichles in owner occupied houses
Median number of vehichles in renter occupied houses
Mean number of vehichles in renter occupied houses
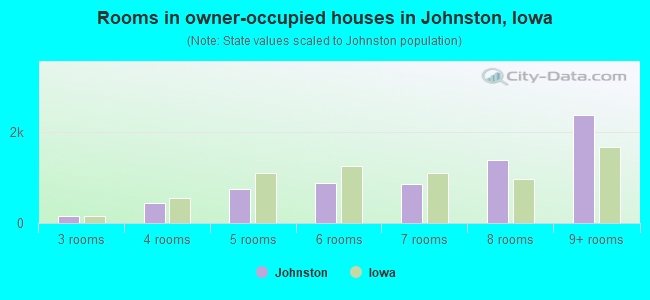
Rooms in owner-occupied houses - 1 room (%)
Rooms in owner-occupied houses - 2 rooms (%)
Rooms in owner-occupied houses - 3 rooms (%)
Rooms in owner-occupied houses - 4 rooms (%)
Rooms in owner-occupied houses - 5 rooms (%)
Rooms in owner-occupied houses - 6 rooms (%)
Rooms in owner-occupied houses - 7 rooms (%)
Rooms in owner-occupied houses - 8 rooms (%)
Rooms in owner-occupied houses - 9+ rooms (%)
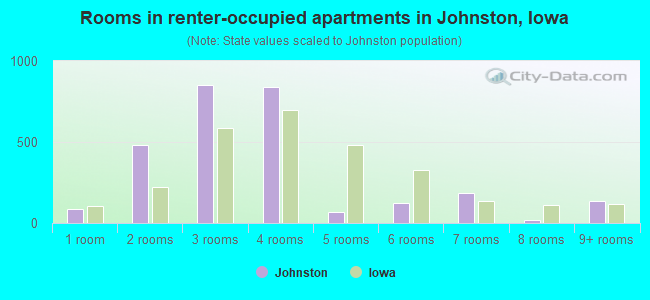
Rooms in renter-occupied houses - 1 room (%)
Rooms in renter-occupied houses - 2 rooms (%)
Rooms in renter-occupied houses - 3 rooms (%)
Rooms in renter-occupied houses - 4 rooms (%)
Rooms in renter-occupied houses - 5 rooms (%)
Rooms in renter-occupied houses - 6 rooms (%)
Rooms in renter-occupied houses - 7 rooms (%)
Rooms in renter-occupied houses - 8 rooms (%)
Rooms in renter-occupied houses - 9+ rooms (%)
Bedrooms in owner-occupied houses - no bedrooms (%)
Bedrooms in owner-occupied houses - 1 bedroom (%)
Bedrooms in owner-occupied houses - 2 bedrooms (%)
Bedrooms in owner-occupied houses - 3 bedrooms (%)
Bedrooms in owner-occupied houses - 4 bedrooms (%)
Bedrooms in owner-occupied houses - 5+ bedrooms (%)
Bedrooms in renter-occupied houses - no bedrooms (%)
Bedrooms in renter-occupied houses - 1 bedroom (%)
Bedrooms in renter-occupied houses - 2 bedrooms (%)
Bedrooms in renter-occupied houses - 3 bedrooms (%)
Bedrooms in renter-occupied houses - 4 bedrooms (%)
Bedrooms in renter-occupied houses - 5+ bedrooms (%)
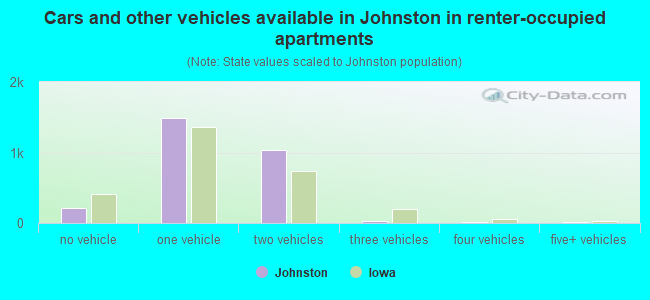
Vehicles available in owner-occupied houses - no vehicle available (%)
Vehicles available in owner-occupied houses - 1 vehicle available(%)
Vehicles available in owner-occupied houses - 2 Vehicles available (%)
Vehicles available in owner-occupied houses - 3 Vehicles available (%)
Vehicles available in owner-occupied houses - 4 Vehicles available (%)
Vehicles available in owner-occupied houses - 5+ Vehicles available (%)
Vehicles available in renter-occupied houses - no vehicle available (%)
Vehicles available in renter-occupied houses - 1 vehicle available (%)
Vehicles available in renter-occupied houses - 2 Vehicles available (%)
Vehicles available in renter-occupied houses - 3 Vehicles available (%)
Vehicles available in renter-occupied houses - 4 Vehicles available (%)
Vehicles available in renter-occupied houses - 5+ Vehicles available (%)
Housing units in structures - 1, detached (%)
Housing units in structures - 1, attached (%)
Housing units in structures - 2 (%)
Housing units in structures - 3 or 4 (%)
Housing units in structures - 5 to 9 (%)
Housing units in structures - 10 to 19 (%)
Housing units in structures - 20 to 49 (%)
Housing units in structures - 50 or more (%)
Housing units in structures - Mobile home (%)
Housing units in structures - Boat, RV, van, etc. (%)
Housing units in structures - Owners - 1, detached (%)
Housing units in structures - Owners - 1, attached (%)
Housing units in structures - Owners - 2 (%)
Housing units in structures - Owners - 3 or 4 (%)
Housing units in structures - Owners - 5 to 9 (%)
Housing units in structures - Owners - 10 to 19 (%)
Housing units in structures - Owners - 20 to 49 (%)
Housing units in structures - Owners - 50 or more (%)
Housing units in structures - Owners - Mobile home (%)
Housing units in structures - Owners - Boat, RV, van, etc. (%)
Housing units in structures - Renters - 1, detached (%)
Housing units in structures - Renters - 1, attached (%)
Housing units in structures - Renters - 2 (%)
Housing units in structures - Renters - 3 or 4 (%)
Housing units in structures - Renters - 5 to 9 (%)
Housing units in structures - Renters - 10 to 19 (%)
Housing units in structures - Renters - 20 to 49 (%)
Housing units in structures - Renters - 50 or more (%)
Housing units in structures - Renters - Mobile home (%)
Housing units in structures - Renters - Boat, RV, van, etc. (%)
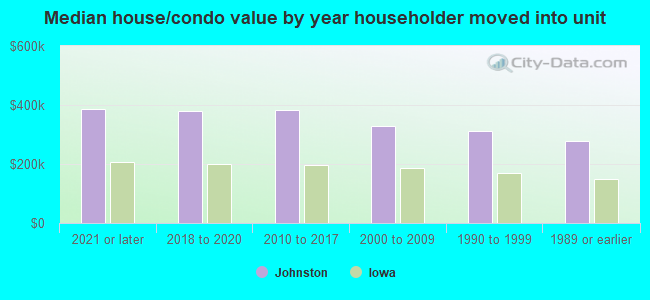
House/condo owner moved in on average (years ago)
Renter moved in on average (years ago)
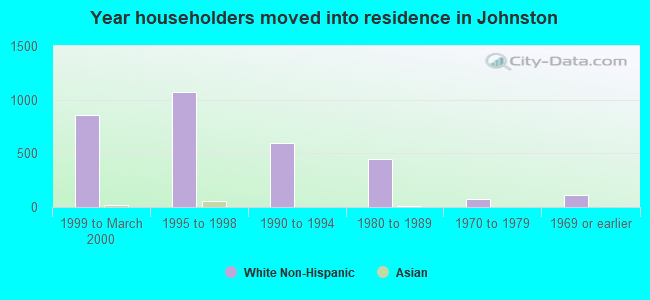
Year householder moved into unit - Moved in 1999 to March 2000 (%)
Year householder moved into unit - Moved in 1999 to March 2000 (%) - White
Year householder moved into unit - Moved in 1999 to March 2000 (%) - Black or African American
Year householder moved into unit - Moved in 1999 to March 2000 (%) - Asian
Year householder moved into unit - Moved in 1999 to March 2000 (%) - Hispanic or Latino
Year householder moved into unit - Moved in 1999 to March 2000 (%) - American Indian and Alaska Native
Year householder moved into unit - Moved in 1999 to March 2000 (%) - Multirace
Year householder moved into unit - Moved in 1999 to March 2000 (%) - Other Race
Year householder moved into unit - Moved in 1995 to 1998 (%)
Year householder moved into unit - Moved in 1995 to 1998 (%) - White
Year householder moved into unit - Moved in 1995 to 1998 (%) - Black or African American
Year householder moved into unit - Moved in 1995 to 1998 (%) - Asian
Year householder moved into unit - Moved in 1995 to 1998 (%) - Hispanic or Latino
Year householder moved into unit - Moved in 1995 to 1998 (%) - American Indian and Alaska Native
Year householder moved into unit - Moved in 1995 to 1998 (%) - Multirace
Year householder moved into unit - Moved in 1995 to 1998 (%) - Other Race
Year householder moved into unit - Moved in 1990 to 1994 (%)
Year householder moved into unit - Moved in 1990 to 1994 (%) - White
Year householder moved into unit - Moved in 1990 to 1994 (%) - Black or African American
Year householder moved into unit - Moved in 1990 to 1994 (%) - Asian
Year householder moved into unit - Moved in 1990 to 1994 (%) - Hispanic or Latino
Year householder moved into unit - Moved in 1990 to 1994 (%) - American Indian and Alaska Native
Year householder moved into unit - Moved in 1990 to 1994 (%) - Multirace
Year householder moved into unit - Moved in 1990 to 1994 (%) - Other Race
Year householder moved into unit - Moved in 1980 to 1989 (%)
Year householder moved into unit - Moved in 1980 to 1989 (%) - White
Year householder moved into unit - Moved in 1980 to 1989 (%) - Black or African American
Year householder moved into unit - Moved in 1980 to 1989 (%) - Asian
Year householder moved into unit - Moved in 1980 to 1989 (%) - Hispanic or Latino
Year householder moved into unit - Moved in 1980 to 1989 (%) - American Indian and Alaska Native
Year householder moved into unit - Moved in 1980 to 1989 (%) - Multirace
Year householder moved into unit - Moved in 1980 to 1989 (%) - Other Race
Year householder moved into unit - Moved in 1970 to 1979 (%)
Year householder moved into unit - Moved in 1970 to 1979 (%) - White
Year householder moved into unit - Moved in 1970 to 1979 (%) - Black or African American
Year householder moved into unit - Moved in 1970 to 1979 (%) - Asian
Year householder moved into unit - Moved in 1970 to 1979 (%) - Hispanic or Latino
Year householder moved into unit - Moved in 1970 to 1979 (%) - American Indian and Alaska Native
Year householder moved into unit - Moved in 1970 to 1979 (%) - Multirace
Year householder moved into unit - Moved in 1970 to 1979 (%) - Other Race
Year householder moved into unit - Moved in 1969 or earlier (%)
Year householder moved into unit - Moved in 1969 or earlier (%) - White
Year householder moved into unit - Moved in 1969 or earlier (%) - Black or African American
Year householder moved into unit - Moved in 1969 or earlier (%) - Asian
Year householder moved into unit - Moved in 1969 or earlier (%) - Hispanic or Latino
Year householder moved into unit - Moved in 1969 or earlier (%) - American Indian and Alaska Native
Year householder moved into unit - Moved in 1969 or earlier (%) - Multirace
Year householder moved into unit - Moved in 1969 or earlier (%) - Other Race
Housing units lacking complete plumbing facilities (%)
Housing units lacking complete kitchen facilities (%)
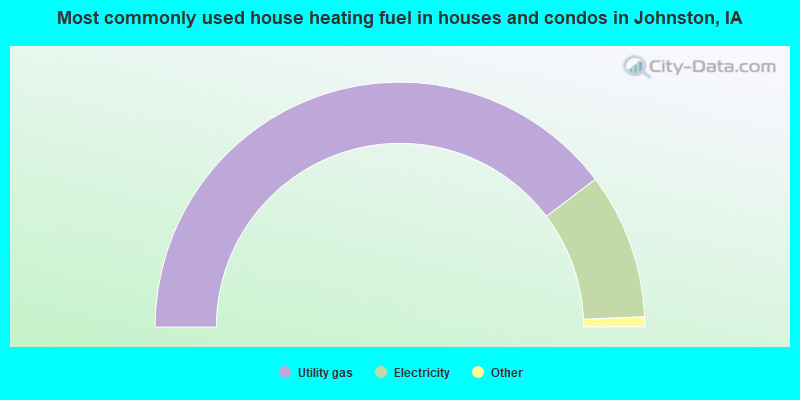
House heating fuel used in houses and condos - Utility gas (%)
House heating fuel used in houses and condos - Bottled, tank, or LP gas (%)
House heating fuel used in houses and condos - Electricity (%)
House heating fuel used in houses and condos - Fuel oil, kerosene, etc. (%)
House heating fuel used in houses and condos - Coal or coke (%)
House heating fuel used in houses and condos - Wood (%)
House heating fuel used in houses and condos - Solar energy (%)
House heating fuel used in houses and condos - Other fuel (%)
House heating fuel used in houses and condos - No fuel used (%)
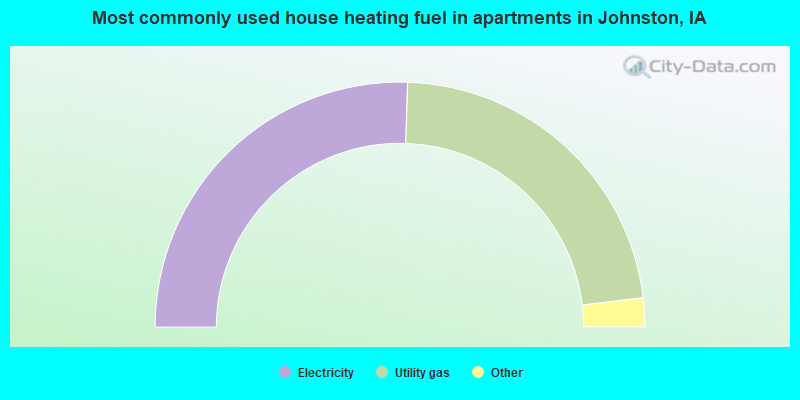
House heating fuel used in apartments - Utility gas (%)
House heating fuel used in apartments - Bottled, tank, or LP gas (%)
House heating fuel used in apartments - Electricity (%)
House heating fuel used in apartments - Fuel oil, kerosene, etc. (%)
House heating fuel used in apartments - Coal or coke (%)
House heating fuel used in apartments - Wood (%)
House heating fuel used in apartments - Solar energy (%)
House heating fuel used in apartments - Other fuel (%)
House heating fuel used in apartments - No fuel used (%)
Latest news about housing in Johnston, IA collected exclusively by city-data.com from local newspapers, TV, and radio stations
Median year house/condo built: 2002Median year apartment built: 2009Household type by relationship:
Households: 24,228
Male householders: 4,534 (1,004 living alone ), Female householders: 4,865 (1,516 living alone )5,372 spouses (5,372 opposite-sex spouses ), 310 unmarried partners , (310 opposite-sex unmarried partners ), 8,005 children (7,705 natural , 53 adopted , 245 stepchildren ), 123 grandchildren , 134 brothers or sisters , 35 parents , 0 foster children , 47 other relatives , 539 non-relatives In group quarters: 258
Size of family households: 2,923 2-persons , 1,245 3-persons , 1,366 4-persons , 748 5-persons , 70 6-persons , 225 7-or-more-persons .
Size of nonfamily households: 2,617 1-person , 379 2-persons , 52 3-persons .
5,794 married couples with children. single-parent households (126 men , 994 women ).
87.4% of residents of Johnston speak English at home. of residents speak Spanish at home (77% speak English very well , 23% speak English well ).of residents speak other Indo-European language at home (74% speak English very well , 18% speak English well , 8% speak English not well ).of residents speak Asian or Pacific Island language at home (88% speak English very well , 12% speak English well ).of residents speak other language at home (49% speak English very well , 51% speak English well ).
Foreign born population: 2,334 (9.6%)of them are naturalized citizens )
Median number of rooms in houses and condos:
Median number of rooms in apartments
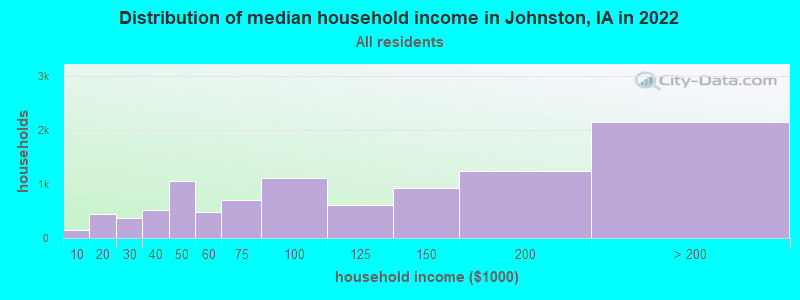
Johnston, IA household income distribution 156 Less than $10,000444 $10,000 to $19,999366 $20,000 to $29,999508 $30,000 to $39,9991,048 $40,000 to $49,999485 $50,000 to $59,999706 $60,000 to $74,9991,106 $75,000 to $99,999611 $100,000 to $124,999916 $125,000 to $149,9991,238 $150,000 to $199,9992,142 $200,000 or more
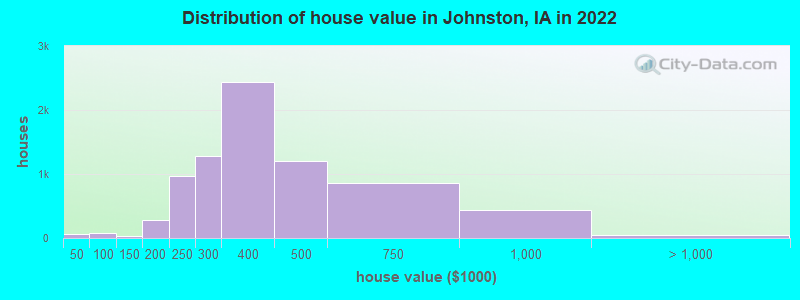
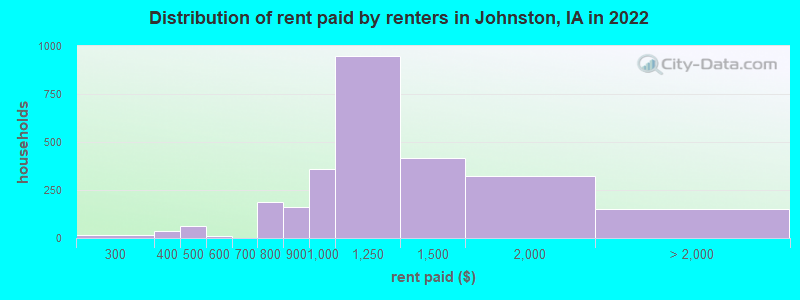
Home value of owner - occupied houses in 2022 in Johnston, IA 7 Less than $10,00010 $15,000 to $19,99913 $30,000 to $34,99924 $35,000 to $39,99916 $50,000 to $59,99922 $60,000 to $69,99941 $90,000 to $99,9997 $100,000 to $124,99928 $125,000 to $149,99961 $150,000 to $174,999224 $175,000 to $199,999964 $200,000 to $249,9991,282 $250,000 to $299,9992,440 $300,000 to $399,9991,207 $400,000 to $499,999856 $500,000 to $749,999440 $750,000 to $999,99913 $1,000,000 to $1,499,99930 $2,000,000 or moreRent paid by renters in 2022 in Johnston, IA 16 $200 to $24939 $350 to $39950 $400 to $44911 $450 to $49910 $550 to $599189 $700 to $749158 $800 to $899359 $900 to $999947 $1,000 to $1,249418 $1,250 to $1,499322 $1,500 to $1,99952 $2,000 to $2,49914 $3,000 to $3,49919 $3,500 or more65 No cash rent
Percentage of workers working in this county: 90.4%Number of people working at home: 2,013 (15.8% of all workers )
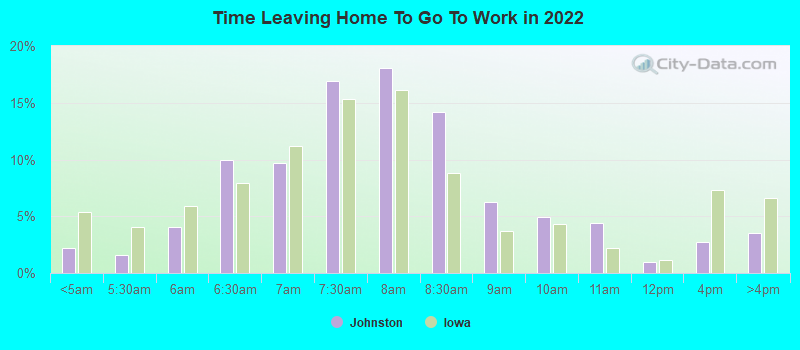
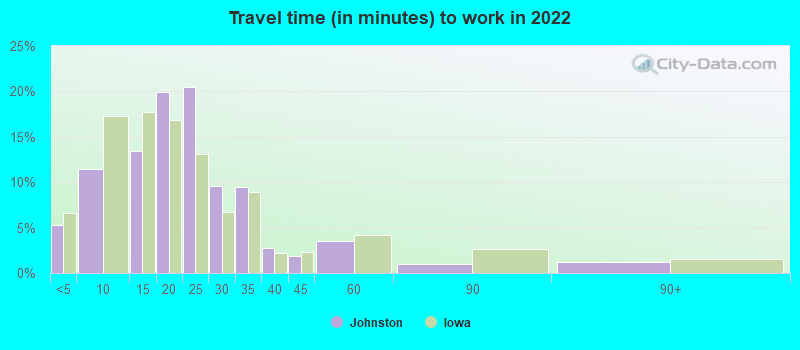
Travel time to work (commute)
Less than 5 minutes: 4965 to 9 minutes: 1,42610 to 14 minutes: 1,73815 to 19 minutes: 1,78620 to 24 minutes: 2,55525 to 29 minutes: 1,26930 to 34 minutes: 55635 to 39 minutes: 10840 to 44 minutes: 17345 to 59 minutes: 43460 to 89 minutes: 4190 or more minutes: 83
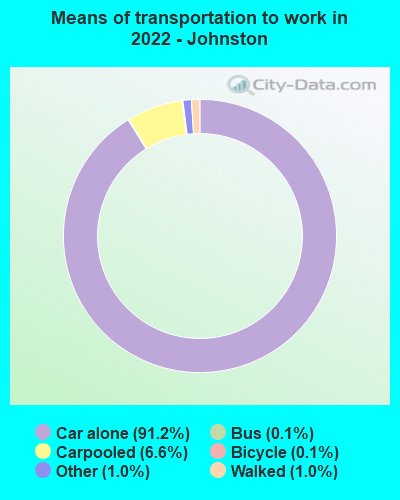
Means of transportation to work:
Drove a car alone: 12,200 (79.4%)Carpooled: 831 (5.4%)Bus : 12 (0.1%)Taxi: 102 (0.7%)Bicycle: 24 (0.2%)Walked: 181 (1.2%)Worked at home: 2,013 (13.1%)
Unemployment by race in 2022
Unemployment rate for White non-Hispanic residents 1.2% Males0.4% FemalesUnemployment rate for Black residents 24.7% Females
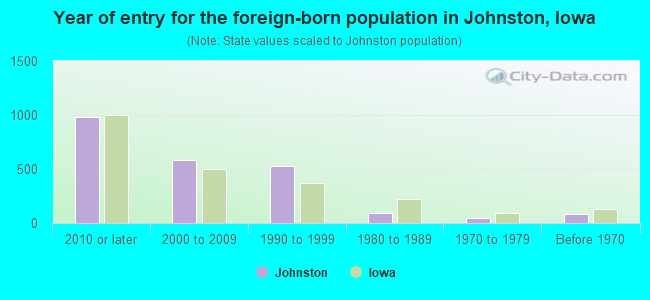
Year of entry for the foreign-born population in Johnston, Iowa
982 2010 or later 585 2000 to 2009 525 1990 to 1999 93 1980 to 1989 43 1970 to 1979 86 Before 1970
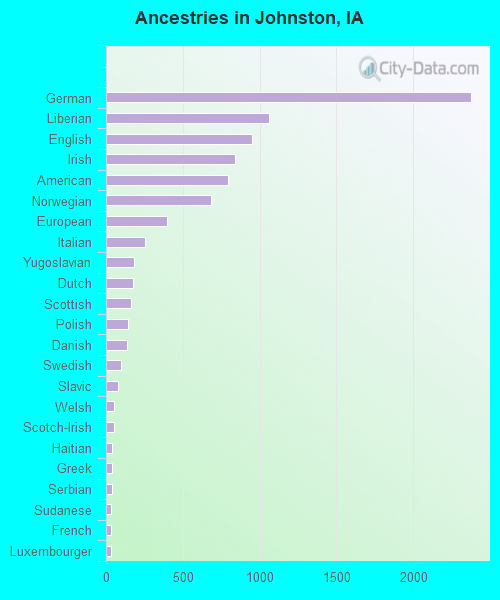
First ancestries reported:
German: 2,374 (19.2%)
Liberian: 1,063 (8.6%)
English: 952 (7.7%)
Irish: 841 (6.8%)
American: 795 (6.4%)
Norwegian: 686 (5.5%)
European: 395 (3.2%)
Italian: 254 (2.1%)
Yugoslavian: 183 (1.5%)
Dutch: 173 (1.4%)
Scottish: 165 (1.3%)
Polish: 140 (1.1%)
Danish: 135 (1.1%)
Swedish: 96 (0.8%)
Slavic: 78 (0.6%)
Welsh: 54 (0.4%)
Scotch-Irish: 50 (0.4%)
Haitian: 40 (0.3%)
Greek: 39 (0.3%)
Serbian: 36 (0.3%)
Sudanese: 34 (0.3%)
French: 32 (0.3%)
Luxembourger: 31 (0.3%)
Latvian: 20 (0.2%)
Scandinavian: 19 (0.2%)
Croatian: 16 (0.1%)
Eastern European: 16 (0.1%)
British: 14 (0.1%)
Swiss: 12 (0.10%)
Czech: 10 (0.08%)
Finnish: 7 (0.06%)
Northern European: 5 (0.04%)
Lebanese: 3 (0.02%) Most common places of birth for foreign-born residents (%): India Johnston:
29.2% (605)Iowa:
6.2% (11,148)
China, excluding Hong Kong and Taiwan Johnston:
14.1% (293)Iowa:
4.6% (8,194)
Bosnia and Herzegovina Johnston:
13.7% (283)Iowa:
3.2% (5,751)
Liberia Johnston:
8.3% (171)Iowa:
1.7% (2,949)
Other Eastern Africa Johnston:
7.2% (150)Iowa:
1.4% (2,422)
Cameroon Johnston:
5.4% (112)Iowa:
0.2% (269)
Mexico Johnston:
4.8% (99)Iowa:
23.3% (41,625)
Haiti Johnston:
1.9% (39)Iowa:
0.4% (788)
Laos Johnston:
1.7% (36)Iowa:
2.1% (3,682)
Belarus Johnston:
1.7% (35)Iowa:
0.0% (50)
Place of birth for U.S.-born residents:
This state: 15,577Other state: 6,096Northeast: 208Midwest: 4,084South: 1,212West: 649 93.1% of Johnston residents lived in the same house 1 years ago.
Out of people who lived in different houses, 36.1% lived in this county.
Out of people who lived in different counties, 69.7% lived in Iowa.
Johnston:
93.1%State average:
87.2%
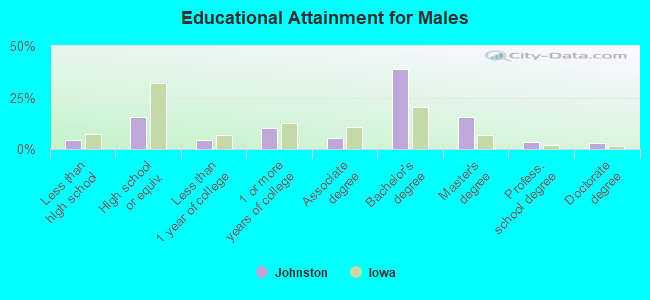
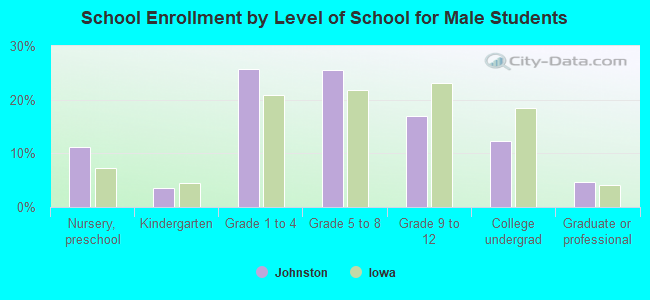
Education attainment for males 25 years and older:
No schooling: 32Nursery to 4th grade: 05th and 6th grade: 07th and 8th grade: 09th grade: 5010th grade: 011th grade: 4812th grade, no diploma: 206High school graduate (or equivalency): 1,156Less than 1 year of college: 327Some college more than 1 year, no degree: 757Associate degree: 382Bachelor's degree: 2,890Master's degree: 1,162Professional school degree: 247Doctorate degree: 209
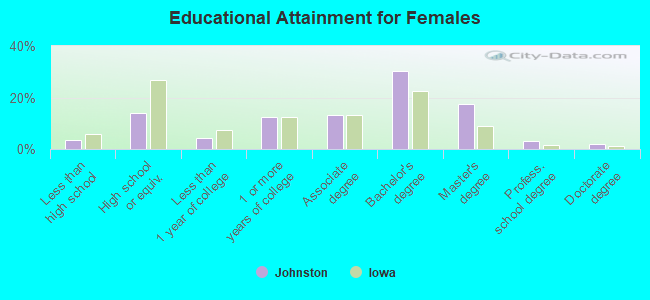
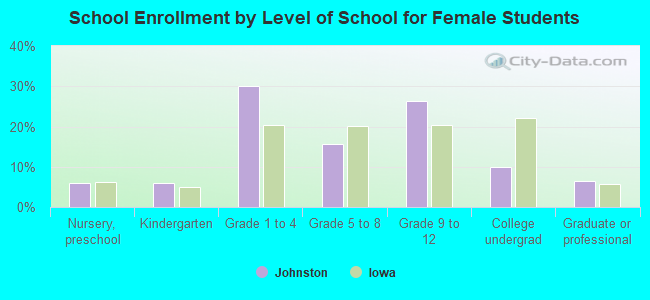
Education attainment for females 25 years and older:
No schooling: 79Nursery to 4th grade: 05th and 6th grade: 07th and 8th grade: 29th grade: 12910th grade: 411th grade: 412th grade, no diploma: 62High school graduate (or equivalency): 1,174Less than 1 year of college: 356Some college more than 1 year, no degree: 1,027Associate degree: 1,104Bachelor's degree: 2,519Master's degree: 1,455Professional school degree: 265Doctorate degree: 150
Housing units in structures:
One, detached: 5,893One, attached: 1,350Two: 43 or 4: 1045 to 9: 58410 to 19: 63820 to 49: 62250 or more: 732Housing units lacking complete kitchen facilities in 2022: 0.7%Private vs. public school enrollment:
Students in private schools in grades 1 to 8 (elementary and middle school): 63 Students in private schools in grades 9 to 12 (high school): 34 Students in private undergraduate colleges: 164