Johnston, SC (South Carolina) Houses and Residents
| Johnston: | $123,649 |
| South Carolina: | $254,600 |
Total population: 2,337 (Urban population: 0, Rural population: 2,298 (17 farm, 2,281 nonfarm))
Houses: 1,315 (1,134 occupied: 622 owner occupied, 533 renter occupied)
| % of renters here: | 46% |
| State: | 28% |
Housing density: 524 houses/condos per square mile
Median price asked for vacant for-sale houses and condos in 2022: $414,154.
Median contract rent in 2022: $517 (lower quartile is $331, upper quartile is $675)
Median rent asked for vacant for-rent units in 2022: $515
Median gross rent in Johnston, SC in 2022: $787
Housing units in Johnston with a mortgage: 309 (16 second mortgage, 0 home equity loan, 10 both second mortgage and home equity loan)
Houses without a mortgage: 9
Median household income for houses/condos with a mortgage: $55,315
Median household income for apartments without a mortgage: $43,504
Median monthly housing costs: $684
Compare current foreclosures near Johnston, SC:
| Photo | Address | Area | Beds / Baths | Price | Details |
|---|---|---|---|---|---|

|
#1
Mile Bridge Way
Johnston, SC 29832
|
- sq. feet
|
- baths - beds |
show details | |

|
#2
Young St
Johnston, SC 29832
|
- sq. feet
|
- baths - beds |
show details | |

|
#3
Dry Gulch Rd
Saluda, SC 29138
|
1,568 sq. feet
|
3 baths 3 beds |
show details | |

|
#4
S Fair Ave
Batesburg, SC 29006
|
1,020 sq. feet
|
1 baths 3 beds |
show details | |

|
#5
S Bethlehem Rd
Batesburg, SC 29006
|
1,346 sq. feet
|
2 baths 3 beds |
show details | |

|
#6
Johnston Hwy
Saluda, SC 29138
|
1,132 sq. feet
|
1 baths - beds |
show details | |

|
#7
Pipeline Rd
Aiken, SC 29801
|
1,410 sq. feet
|
1 baths - beds |
show details | |

|
#8
Outing Club Rd
Aiken, SC 29801
|
1,506 sq. feet
|
2 baths - beds |
show details | |

|
#9
Fields Cemetery Rd
Graniteville, SC 29829
|
1,612 sq. feet
|
2 baths - beds |
show details | |

|
#10
Morris Rd
Aiken, SC 29805
|
1,280 sq. feet
|
1 baths - beds |
show details |
| Photo | Address | Area | Beds / Baths | Price | Details |
|---|---|---|---|---|---|

|
#11
Logan St
Saluda, SC 29138
|
1,036 sq. feet
|
1 baths - beds |
show details | |

|
#12
Old Friar Rd
Aiken, SC 29801
|
1,694 sq. feet
|
2 baths - beds |
show details | |

|
#13
Old Camp Long Rd
Aiken, SC 29805
|
1,132 sq. feet
|
1 baths - beds |
show details | |

|
#14
Bomar St
Ridge Spring, SC 29129
|
1,188 sq. feet
|
2 baths - beds |
show details | |

|
#15
Shop Rd
Ward, SC 29166
|
1,118 sq. feet
|
1 baths - beds |
show details | |

|
#16
Dubose St
Ridge Spring, SC 29129
|
1,584 sq. feet
|
1 baths - beds |
show details | |

|
#17
Bonham Rd
Saluda, SC 29138
|
- sq. feet
|
- baths - beds |
show details | |

|
#18
Carmine Ave
Graniteville, SC 29829
|
- sq. feet
|
- baths - beds |
show details | |

|
#19
John J Rushton Rd
Saluda, SC 29138
|
- sq. feet
|
- baths - beds |
show details | |

|
#20
Pipeline Rd
Aiken, SC 29801
|
- sq. feet
|
- baths - beds |
show details |
| Photo | Address | Area | Beds / Baths | Price | Details |
|---|---|---|---|---|---|

|
#21
Medea Ln
Trenton, SC 29847
|
- sq. feet
|
- baths - beds |
show details | |

|
#22
Timmerman St
Edgefield, SC 29824
|
- sq. feet
|
- baths - beds |
show details | |

|
#23
Mayfield Rd
Aiken, SC 29801
|
- sq. feet
|
- baths - beds |
show details | |

|
#24
Vintage Vale Rd
Aiken, SC 29805
|
- sq. feet
|
- baths - beds |
show details | |

|
#25
Nautilus St
Aiken, SC 29805
|
- sq. feet
|
- baths - beds |
show details | |

|
#26
Vermilion Loop
Graniteville, SC 29829
|
- sq. feet
|
- baths - beds |
show details | |

|
#27
Lakeview Rd
North Augusta, SC 29860
|
- sq. feet
|
- baths - beds |
show details | |

|
#28
Donnington Ct
Aiken, SC 29801
|
- sq. feet
|
- baths - beds |
show details | |

|
#29
Kissing Creek Run
Graniteville, SC 29829
|
- sq. feet
|
- baths - beds |
show details | |

|
#30
Ghee Ct
Aiken, SC 29801
|
- sq. feet
|
- baths - beds |
show details |
| Photo | Address | Area | Beds / Baths | Price | Details |
|---|---|---|---|---|---|

|
#31
Almond Dr
Graniteville, SC 29829
|
- sq. feet
|
- baths - beds |
show details | |

|
#32
Caladium Ct
Graniteville, SC 29829
|
- sq. feet
|
- baths - beds |
show details | |

|
#33
Satinwood Cir
Graniteville, SC 29829
|
- sq. feet
|
- baths - beds |
show details | |

|
#34
Telegraph Dr
Aiken, SC 29801
|
- sq. feet
|
- baths - beds |
show details | |

|
#35
Village West Ln
Graniteville, SC 29829
|
- sq. feet
|
- baths - beds |
show details | |

|
#36
Mahogany Ter
Graniteville, SC 29829
|
- sq. feet
|
- baths - beds |
show details | |

|
#37
Winding Trail Rd
Graniteville, SC 29829
|
- sq. feet
|
- baths - beds |
show details | |

|
#38
Oval Ter
Graniteville, SC 29829
|
- sq. feet
|
- baths - beds |
show details | |

|
#39
Greenview Dr
Ridge Spring, SC 29129
|
- sq. feet
|
- baths - beds |
show details | |

|
#40
Mims St
Edgefield, SC 29824
|
- sq. feet
|
- baths - beds |
show details |
| Photo | Address | Area | Beds / Baths | Price | Details |
|---|---|---|---|---|---|

|
#41
Winding Trail Rd
Graniteville, SC 29829
|
- sq. feet
|
- baths - beds |
show details | |

|
#42
Us Highway 25 N
Edgefield, SC 29824
|
- sq. feet
|
- baths - beds |
show details | |

|
#43
Mine Creek Rd
Saluda, SC 29138
|
2,128 sq. feet
|
- baths - beds |
show details | |

|
#44
Seminole Dr
Saluda, SC 29138
|
- sq. feet
|
- baths - beds |
show details | |

|
#45
Old Ln
Monetta, SC 29105
|
1,440 sq. feet
|
- baths - beds |
show details | |

|
#46
Columbia Hwy N
Ridge Spring, SC 29129
|
- sq. feet
|
- baths - beds |
show details | |

|
#47
Gwen Rd
Saluda, SC 29138
|
- sq. feet
|
- baths - beds |
show details | |

|
#48
Old Shoals Rd
Monetta, SC 29105
|
- sq. feet
|
- baths - beds |
show details | |

|
#49
Old Gassaway Rd
Saluda, SC 29138
|
1,620 sq. feet
|
- baths - beds |
show details | |

|
Check over 1 million property listings on Foreclosure.com!
|
browse all offers | |||

Latest news about housing in Johnston, SC collected exclusively by city-data.com from local newspapers, TV, and radio stations

 | Homes for rent in the Fort Mill/Highway 51/Johnston Rd area (1 reply) |
| The "visiting Charleston" thread (23 replies) |
| ATL fan's Greenville SC Planning Commision (1271 replies) |
| Restaurants Greenville needs. (54 replies) |
| Longbrooke European Estates versus Bridgemill/Bridgehampton (12 replies) |
| James Island Elementary and Middle? (7 replies) |

Median year apartment built: 1970
Household type by relationship:
Households: 2,439- Male householders: 460 (174 living alone), Female householders: 664 (282 living alone)
305 spouses (305 opposite-sex spouses), 22 unmarried partners, (22 opposite-sex unmarried partners), 636 children (614 natural, 0 adopted, 22 stepchildren), 135 grandchildren, 36 brothers or sisters, 34 parents, 0 foster children, 93 other relatives, 49 non-relatives
Size of family households: 335 2-persons, 144 3-persons, 104 4-persons, 23 5-persons, 18 6-persons, 19 7-or-more-persons.
Size of nonfamily households: 464 1-person, 40 2-persons, 4 3-persons.
85 married couples with children.
263 single-parent households (37 men, 226 women).
93.3% of residents of Johnston speak English at home.
4.8% of residents speak Spanish at home (15% speak English very well, 13% speak English not well, 72% don't speak English at all).
1.2% of residents speak other Indo-European language at home (100% speak English very well).
Foreign born population: 134 (5.5%)
(0.0% of them are naturalized citizens)
| Here: | 6.2 |
| State: | 6.4 |
| Here: | 4.6 |
| State: | 4.5 |

- Bedrooms in owner-occupied houses and condos in Johnston, South Carolina
- 0no bedroom
- 41 bedroom
- 1342 bedrooms
- 3593 bedrooms
- 804 bedrooms
- 455+ bedrooms

- Bedrooms in renter-occupied apartments in Johnston, South Carolina
- 7no bedroom
- 1861 bedroom
- 1092 bedrooms
- 2003 bedrooms
- 184 bedrooms
- 145+ bedrooms

- Cars and other vehicles available in Johnston in owner-occupied houses/condos
- 64no vehicle
- 1261 vehicle
- 2242 vehicles
- 1643 vehicles
- 404 vehicles
- 55+ vehicles

- Cars and other vehicles available in Johnston in renter-occupied apartments
- 131no vehicle
- 2441 vehicle
- 1362 vehicles
- 223 vehicles
- 04 vehicles
- 05+ vehicles

- Rooms in owner-occupied houses in Johnston, South Carolina
- 01 room
- 02 rooms
- 143 rooms
- 934 rooms
- 755 rooms
- 1906 rooms
- 1217 rooms
- 578 rooms
- 739+ rooms

- Rooms in renter-occupied apartments in Johnston, South Carolina
- 71 room
- 02 rooms
- 1783 rooms
- 574 rooms
- 1775 rooms
- 596 rooms
- 367 rooms
- 48 rooms
- 149+ rooms


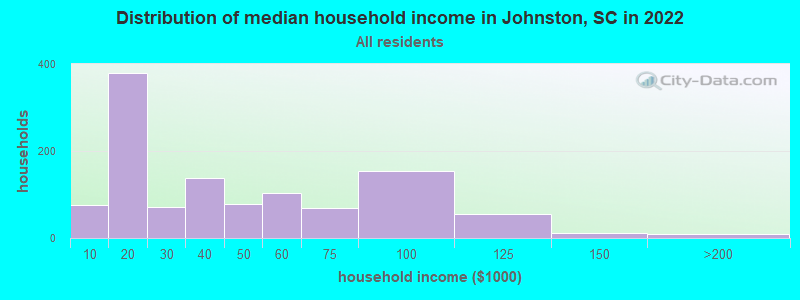
Johnston, SC household income distribution

- 77Less than $10,000
- 380$10,000 to $19,999
- 72$20,000 to $29,999
- 137$30,000 to $39,999
- 79$40,000 to $49,999
- 103$50,000 to $59,999
- 69$60,000 to $74,999
- 155$75,000 to $99,999
- 55$100,000 to $124,999
- 11$125,000 to $149,999
- 5$150,000 to $199,999
- 4$200,000 or more
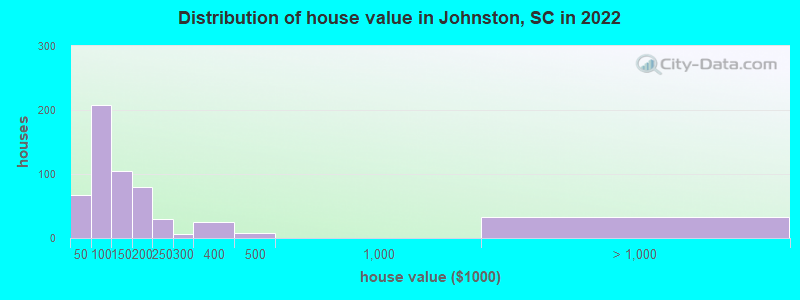
Home value of owner - occupied houses in 2022 in Johnston, SC
-
- 11$10,000 to $14,999
- 4$15,000 to $19,999
- 34$35,000 to $39,999
- 16$40,000 to $49,999
- 44$50,000 to $59,999
- 54$60,000 to $69,999
- 40$70,000 to $79,999
- 40$80,000 to $89,999
- 12$90,000 to $99,999
- 48$100,000 to $124,999
- 55$125,000 to $149,999
- 39$150,000 to $174,999
- 38$175,000 to $199,999
- 29$200,000 to $249,999
- 5$250,000 to $299,999
- 25$300,000 to $399,999
- 7$400,000 to $499,999
- 33$2,000,000 or more
Rent paid by renters in 2022 in Johnston, SC
-
- 17Less than $100
- 47$100 to $149
- 28$200 to $249
- 4$250 to $299
- 41$300 to $349
- 5$350 to $399
- 38$400 to $449
- 43$450 to $499
- 41$500 to $549
- 11$550 to $599
- 65$600 to $649
- 5$650 to $699
- 4$700 to $749
- 66$800 to $899
- 11$1,250 to $1,499
- 26$1,500 to $1,999
- 26No cash rent


Percentage of workers working in this county: 45.6%
Number of people working at home: 43 (4.3% of all workers)
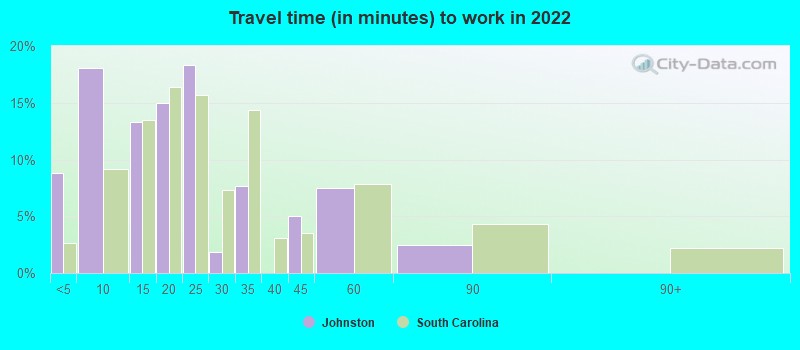
Travel time to work (commute)
- Less than 5 minutes: 76
- 5 to 9 minutes: 33
- 10 to 14 minutes: 125
- 15 to 19 minutes: 184
- 20 to 24 minutes: 13
- 25 to 29 minutes: 55
- 30 to 34 minutes: 126
- 35 to 39 minutes: 31
- 40 to 44 minutes: 105
- 45 to 59 minutes: 138
- 60 to 89 minutes: 42
- 90 or more minutes: 0
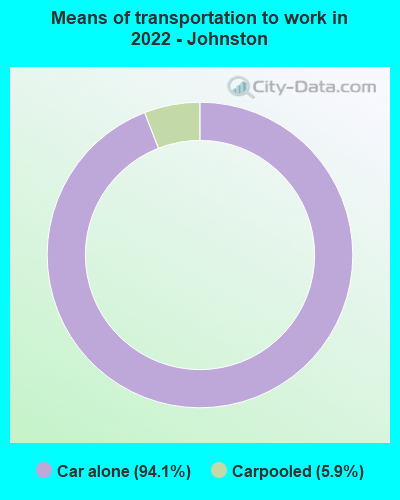
Means of transportation to work:
- Drove a car alone: 787 (87.3%)
- Carpooled: 51 (5.7%)
- Worked at home: 43 (4.8%)

- Unemployment by race in 2022
- Unemployment rate for White non-Hispanic residents
- 7.0%Males
- 13.1%Females
- Unemployment rate for Black residents
- 5.4%Females

- Year of entry for the foreign-born population in Johnston, South Carolina
- 432010 or later
- 982000 to 2009
- 01990 to 1999
- 181980 to 1989
- 51970 to 1979
- 0Before 1970

First ancestries reported:
- American: 204 (12.8%)
- African: 119 (7.4%)
- English: 76 (4.8%)
- Irish: 33 (2.1%)
- German: 27 (1.7%)
- French: 22 (1.4%)
- French Canadian: 20 (1.3%)
- Scotch-Irish: 14 (0.9%)
- Dutch: 6 (0.4%)
- European: 3 (0.2%)
Most common places of birth for foreign-born residents (%):
| Johnston: | 64.2% (86) |
| South Carolina: | 4.8% (12,834) |
| Johnston: | 32.1% (43) |
| South Carolina: | 0.9% (2,357) |
| Johnston: | 10.4% (14) |
| South Carolina: | 6.8% (18,307) |
| Johnston: | 7.5% (10) |
| South Carolina: | 0.3% (727) |
Place of birth for U.S.-born residents:
- This state: 1,629
- Other state: 645
- Northeast: 184
- Midwest: 86
- South: 361
- West: 7
95.8% of Johnston residents lived in the same house 1 years ago.
Out of people who lived in different houses, 28.9% lived in this county.
Out of people who lived in different counties, 12.0% lived in South Carolina.
| Johnston: | 95.8% |
| State average: | 86.5% |
Education attainment for males 25 years and older:
- No schooling: 28
- Nursery to 4th grade: 6
- 5th and 6th grade: 11
- 7th and 8th grade: 0
- 9th grade: 10
- 10th grade: 7
- 11th grade: 18
- 12th grade, no diploma: 7
- High school graduate (or equivalency): 288
- Less than 1 year of college: 25
- Some college more than 1 year, no degree: 105
- Associate degree: 93
- Bachelor's degree: 60
- Master's degree: 12
- Professional school degree: 0
- Doctorate degree: 0

Education attainment for females 25 years and older:
- No schooling: 37
- Nursery to 4th grade: 0
- 5th and 6th grade: 11
- 7th and 8th grade: 25
- 9th grade: 0
- 10th grade: 66
- 11th grade: 47
- 12th grade, no diploma: 2
- High school graduate (or equivalency): 514
- Less than 1 year of college: 33
- Some college more than 1 year, no degree: 65
- Associate degree: 86
- Bachelor's degree: 47
- Master's degree: 156
- Professional school degree: 3
- Doctorate degree: 0


Housing units in structures:
- One, detached: 993
- Two: 40
- 3 or 4: 18
- 5 to 9: 166
- 10 to 19: 66
- 20 to 49: 6
- Mobile homes: 23
Housing units lacking complete kitchen facilities in 2022: 4.9%
House/condo owner moved in on average 20 years ago
Renter moved in on average 5 years ago

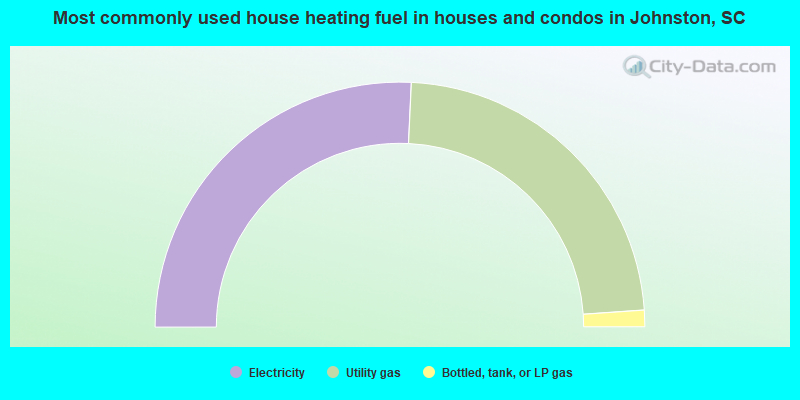
- 51.5%Electricity
- 46.3%Utility gas
- 2.2%Bottled, tank, or LP gas
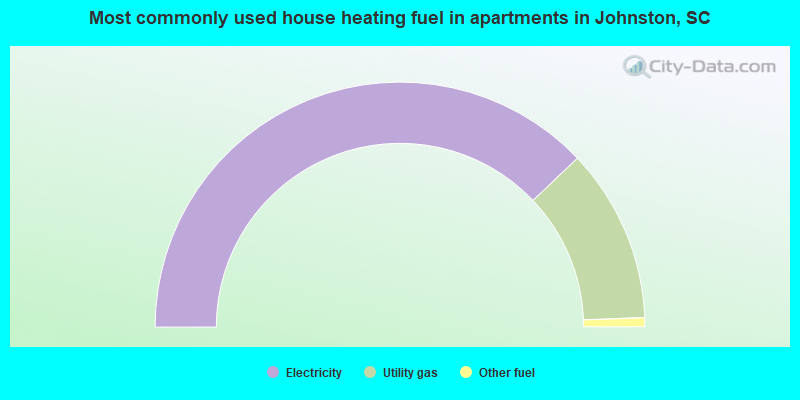
- 75.8%Electricity
- 23.0%Utility gas
- 1.2%Other fuel
Private vs. public school enrollment:
| Here: | 0.0% |
| South Carolina: | 14.4% |
| Here: | 0.0% |
| South Carolina: | 11.1% |
| Here: | 62.1% |
| South Carolina: | 21.9% |


