Jonesville, VA (Virginia) Houses and Residents
| Jonesville: | $122,582 |
| Virginia: | $365,700 |
Mean price in 2022:
Detached houses: $160,368
Here: $160,368 State: $472,865 Mobile homes: $90,114
Here: $90,114 State: $100,736
Total population: 982 (Urban population: 0, Rural population: 1,004 (4 farm, 1,000 nonfarm))
Houses: 675 (592 occupied: 161 owner occupied, 437 renter occupied)
| % of renters here: | 73% |
| State: | 33% |
Housing density: 611 houses/condos per square mile
Median price asked for vacant for-sale houses and condos in 2022 in this county: $227,802.
Median contract rent in 2022: $371 (lower quartile is $202, upper quartile is $527)
Median rent asked for vacant for-rent units in 2022: $373
Median gross rent in Jonesville, VA in 2022: $448
Housing units in Jonesville with a mortgage: 69 (16 second mortgage, 0 home equity loan, 9 both second mortgage and home equity loan)
Houses without a mortgage: 0
Median household income for houses/condos with a mortgage: $98,459
Median household income for apartments without a mortgage: $48,463
Median monthly housing costs: $490
Compare current foreclosures near Jonesville, VA:
| Photo | Address | Area | Beds / Baths | Price | Details |
|---|---|---|---|---|---|

|
#1
Shavers Ford Rd
Jonesville, VA 24263
|
- sq. feet
|
- baths - beds |
show details | |

|
#2
Route 3 Box 94
Jonesville, VA 24263
|
- sq. feet
|
- baths - beds |
show details | |

|
#3
Bedrock Dr
Dryden, VA 24243
|
1,597 sq. feet
|
2 baths 3 beds |
show details | |

|
#4
E Mound St
Harlan, KY 40831
|
1,305 sq. feet
|
1 baths 3 beds |
show details | |

|
#5
Sergent St
Evarts, KY 40828
|
1,008 sq. feet
|
1 baths 4 beds |
show details | |

|
#6
Collins St
Sneedville, TN 37869
|
1,223 sq. feet
|
2 baths 3 beds |
show details | |

|
#7
Delvale Rd
Keokee, VA 24265
|
- sq. feet
|
1 baths 3 beds |
show details | |

|
#8
Pressmens Home Rd
Rogersville, TN 37857
|
1,837 sq. feet
|
1 baths - beds |
show details | |

|
#9
W Snowflake Rd
Surgoinsville, TN 37873
|
1,200 sq. feet
|
1 baths - beds |
show details | |

|
#10
Hickory Cove Rd
Rogersville, TN 37857
|
1,680 sq. feet
|
2 baths - beds |
show details |
| Photo | Address | Area | Beds / Baths | Price | Details |
|---|---|---|---|---|---|

|
#11
Housewright Hollow Rd
Surgoinsville, TN 37873
|
1,040 sq. feet
|
1 baths - beds |
show details | |

|
#12
Blacktop Dr
Blackwater, VA 24221
|
- sq. feet
|
2 baths 4 beds |
show details | |

|
#13
Andy Horton Cir
Surgoinsville, TN 37873
|
1,606 sq. feet
|
2 baths - beds |
show details | |

|
#14
Presley Dr
Rogersville, TN 37857
|
- sq. feet
|
- baths - beds |
show details | |

|
#15
Duff Patt Hwy
Duffield, VA 24244
|
- sq. feet
|
- baths - beds |
show details | |

|
#16
Chappell Dr
Baxter, KY 40806
|
- sq. feet
|
- baths - beds |
show details | |

|
#17
Gilbert St
Harlan, KY 40831
|
- sq. feet
|
- baths - beds |
show details | |

|
#18
Tom Hill Dr
Sneedville, TN 37869
|
- sq. feet
|
- baths - beds |
show details | |

|
#19
Prices Rd
Surgoinsville, TN 37873
|
- sq. feet
|
- baths - beds |
show details | |

|
#20
Seibers Rd
Closplint, KY 40927
|
- sq. feet
|
- baths - beds |
show details |
| Photo | Address | Area | Beds / Baths | Price | Details |
|---|---|---|---|---|---|

|
#21
Harlan Gas Rd
Harlan, KY 40831
|
- sq. feet
|
- baths - beds |
show details | |

|
#22
Wallen St
Sneedville, TN 37869
|
- sq. feet
|
- baths - beds |
show details | |

|
#23
Stonegate Dr Apt 335
Pennington Gap, VA 24277
|
- sq. feet
|
- baths - beds |
show details | |

|
#24
Vardy Blackwater
Sneedville, TN 37869
|
- sq. feet
|
- baths - beds |
show details | |

|
#25
Day Ln
Cawood, KY 40815
|
- sq. feet
|
- baths - beds |
show details | |

|
#26
W Trent Valley Rd
Sneedville, TN 37869
|
- sq. feet
|
- baths - beds |
show details | |

|
#27
Unicorn Ln
Sneedville, TN 37869
|
- sq. feet
|
- baths - beds |
show details | |

|
#28
Highway 215
Evarts, KY 40828
|
- sq. feet
|
- baths - beds |
show details | |

|
#29
Clinch Valley Rd
Eidson, TN 37731
|
1,056 sq. feet
|
- baths - beds |
show details | |

|
#30
Salling Street, Apt #101
Duffield, VA 24244
|
- sq. feet
|
- baths - beds |
show details |
| Photo | Address | Area | Beds / Baths | Price | Details |
|---|---|---|---|---|---|

|
#31
Red Bud Hill Rd
Evarts, KY 40828
|
- sq. feet
|
- baths - beds |
show details | |

|
#32
Ivy Hl
Harlan, KY 40831
|
- sq. feet
|
- baths - beds |
show details | |

|
#33
Big Hill Rd
Pennington Gap, VA 24277
|
- sq. feet
|
- baths - beds |
show details | |

|
#34
Pleasant Dr
Harlan, KY 40831
|
- sq. feet
|
- baths - beds |
show details | |

|
#35
Elk Knob Rd
Pennington Gap, VA 24277
|
- sq. feet
|
- baths - beds |
show details | |

|
#36
Cecil Quillen D D
Duffield, VA 24244
|
- sq. feet
|
- baths - beds |
show details | |

|
#37
Poplar Ter
Harlan, KY 40831
|
- sq. feet
|
- baths - beds |
show details | |

|
#38
Highway 522
Baxter, KY 40806
|
- sq. feet
|
- baths - beds |
show details | |

|
Check over 1 million property listings on Foreclosure.com!
|
browse all offers | |||

Latest news about housing in Jonesville, VA collected exclusively by city-data.com from local newspapers, TV, and radio stations

 | Is This An Accurate Map of Virginia's Regions? (53 replies) |
| Virginia-Best Cities that would work (11 replies) |
| Family Search In Or Around St.charles,va. (0 replies) |

Median year apartment built: 1994
Household type by relationship:
Households: 1,267- Male householders: 231 (143 living alone), Female householders: 355 (183 living alone)
96 spouses (96 opposite-sex spouses), 48 unmarried partners, (48 opposite-sex unmarried partners), 251 children (233 natural, 11 adopted, 7 stepchildren), 54 grandchildren, 0 brothers or sisters, 187 parents, 3 foster children, 11 other relatives, 28 non-relatives
Size of family households: 138 2-persons, 84 3-persons, 32 4-persons, 5 5-persons.
Size of nonfamily households: 336 1-person, 2 2-persons.
23 married couples with children.
121 single-parent households (37 men, 84 women).
99.8% of residents of Jonesville speak English at home.
0.7% of residents speak other Indo-European language at home (100% speak English very well).
| Here: | 6.1 |
| State: | 7.0 |
| Here: | 4.4 |
| State: | 4.3 |

- Bedrooms in owner-occupied houses and condos in Jonesville, Virginia
- 0no bedroom
- 01 bedroom
- 432 bedrooms
- 873 bedrooms
- 284 bedrooms
- 35+ bedrooms

- Bedrooms in renter-occupied apartments in Jonesville, Virginia
- 0no bedroom
- 1811 bedroom
- 952 bedrooms
- 1373 bedrooms
- 264 bedrooms
- 05+ bedrooms

- Cars and other vehicles available in Jonesville in owner-occupied houses/condos
- 2no vehicle
- 521 vehicle
- 712 vehicles
- 163 vehicles
- 184 vehicles
- 15+ vehicles

- Cars and other vehicles available in Jonesville in renter-occupied apartments
- 141no vehicle
- 2461 vehicle
- 132 vehicles
- 123 vehicles
- 264 vehicles
- 05+ vehicles

- Rooms in owner-occupied houses in Jonesville, Virginia
- 01 room
- 02 rooms
- 03 rooms
- 264 rooms
- 155 rooms
- 626 rooms
- 287 rooms
- 228 rooms
- 99+ rooms

- Rooms in renter-occupied apartments in Jonesville, Virginia
- 01 room
- 232 rooms
- 1453 rooms
- 494 rooms
- 875 rooms
- 866 rooms
- 127 rooms
- 358 rooms
- 09+ rooms


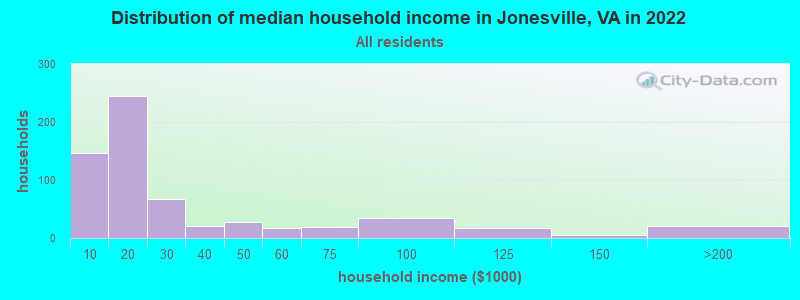
Jonesville, VA household income distribution

- 147Less than $10,000
- 245$10,000 to $19,999
- 68$20,000 to $29,999
- 20$30,000 to $39,999
- 28$40,000 to $49,999
- 17$50,000 to $59,999
- 19$60,000 to $74,999
- 34$75,000 to $99,999
- 17$100,000 to $124,999
- 6$125,000 to $149,999
- 17$150,000 to $199,999
- 4$200,000 or more
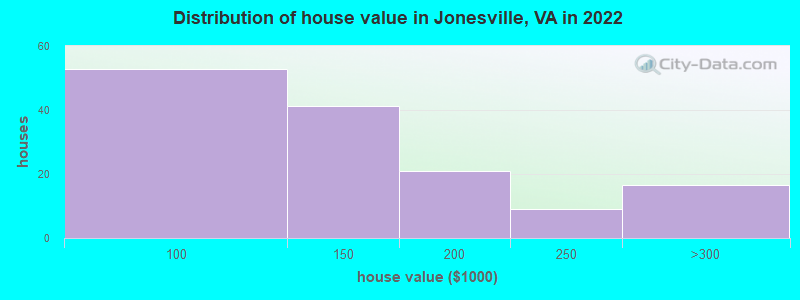
Home value of owner - occupied houses in 2022 in Jonesville, VA
-
- 1$50,000 to $59,999
- 3$60,000 to $69,999
- 3$70,000 to $79,999
- 31$80,000 to $89,999
- 12$90,000 to $99,999
- 33$100,000 to $124,999
- 7$125,000 to $149,999
- 6$150,000 to $174,999
- 14$175,000 to $199,999
- 9$200,000 to $249,999
- 16$250,000 to $299,999
Rent paid by renters in 2022 in Jonesville, VA
-
- 6Less than $100
- 63$100 to $149
- 16$150 to $199
- 98$200 to $249
- 6$250 to $299
- 49$350 to $399
- 18$400 to $449
- 13$450 to $499
- 67$500 to $549
- 13$550 to $599
- 19$600 to $649
- 22$650 to $699
- 4$1,000 to $1,249
- 59No cash rent


Percentage of workers working in this county: 78.4%
Number of people working at home: 18 (6.7% of all workers)
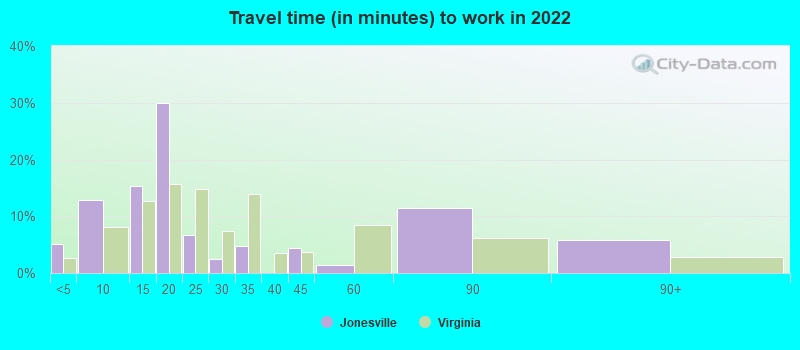
Travel time to work (commute)
- Less than 5 minutes: 21
- 5 to 9 minutes: 58
- 10 to 14 minutes: 36
- 15 to 19 minutes: 48
- 20 to 24 minutes: 27
- 25 to 29 minutes: 3
- 30 to 34 minutes: 3
- 35 to 39 minutes: 0
- 40 to 44 minutes: 0
- 45 to 59 minutes: 19
- 60 to 89 minutes: 10
- 90 or more minutes: 15
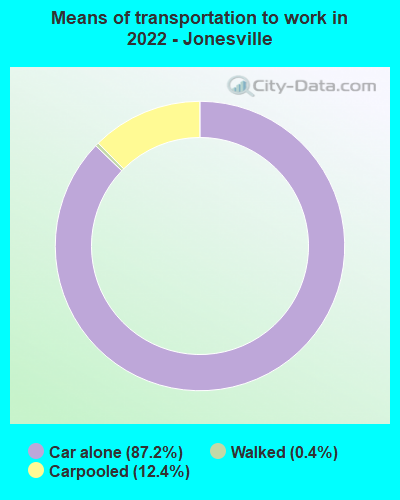
Means of transportation to work:
- Drove a car alone: 903 (81.9%)
- Carpooled: 130 (11.8%)
- Walked: 4 (0.4%)
- Worked at home: 18 (1.6%)

- Unemployment by race in 2022
- Unemployment rate for White non-Hispanic residents
- 23.4%Males
- 4.9%Females

- Year of entry for the foreign-born population in Jonesville, Virginia
- 01995 to March 2000
- 11990 to 1994
- 21985 to 1989
- 01980 to 1984
- 01975 to 1979
- 01970 to 1974
- 01965 to 1969
- 0Before 1965

First ancestries reported:
- English: 405 (45.0%)
- American: 286 (31.8%)
- German: 122 (13.6%)
- Irish: 34 (3.8%)
- Scottish: 18 (2.0%)
- European: 4 (0.4%)
- Scotch-Irish: 2 (0.2%)
- Hungarian: 1 (0.1%)
Most common places of birth for foreign-born residents (%):
| Jonesville: | 100.0% (3) |
| Virginia: | 0.2% (1,245) |
Place of birth for U.S.-born residents:
- This state: 748
- Other state: 512
- Northeast: 46
- Midwest: 153
- South: 307
- West: 0
69.4% of Jonesville residents lived in the same house 1 years ago.
Out of people who lived in different houses, 45.9% lived in this county.
Out of people who lived in different counties, 0.0% lived in Virginia.
| Jonesville: | 69.4% |
| State average: | 86.6% |
Education attainment for males 25 years and older:
- No schooling: 9
- Nursery to 4th grade: 0
- 5th and 6th grade: 14
- 7th and 8th grade: 37
- 9th grade: 4
- 10th grade: 7
- 11th grade: 0
- 12th grade, no diploma: 10
- High school graduate (or equivalency): 163
- Less than 1 year of college: 14
- Some college more than 1 year, no degree: 36
- Associate degree: 6
- Bachelor's degree: 35
- Master's degree: 9
- Professional school degree: 3
- Doctorate degree: 0

Education attainment for females 25 years and older:
- No schooling: 7
- Nursery to 4th grade: 0
- 5th and 6th grade: 9
- 7th and 8th grade: 13
- 9th grade: 0
- 10th grade: 17
- 11th grade: 7
- 12th grade, no diploma: 0
- High school graduate (or equivalency): 293
- Less than 1 year of college: 36
- Some college more than 1 year, no degree: 106
- Associate degree: 8
- Bachelor's degree: 46
- Master's degree: 21
- Professional school degree: 9
- Doctorate degree: 0


Housing units in structures:
- One, detached: 314
- Two: 12
- 3 or 4: 144
- 5 to 9: 82
- 10 to 19: 34
- 20 to 49: 16
- Mobile homes: 72
Housing units lacking complete kitchen facilities in 2022: 1.7%
House/condo owner moved in on average 15 years ago
Renter moved in on average 1 years ago

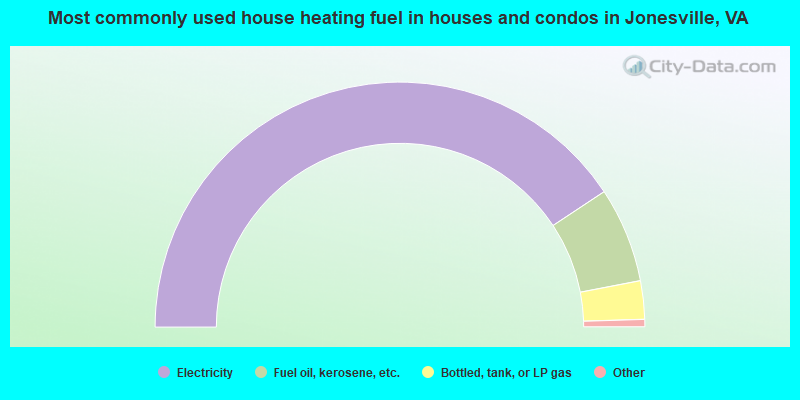
- 82.2%Electricity
- 12.7%Fuel oil, kerosene, etc.
- 5.1%Bottled, tank, or LP gas
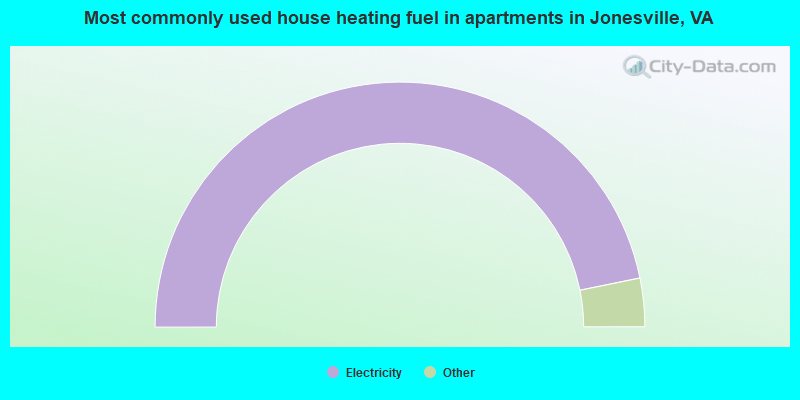
- 93.7%Electricity
- 3.3%Bottled, tank, or LP gas
- 3.1%Fuel oil, kerosene, etc.
Private vs. public school enrollment:
| Here: | 0.0% |
| Virginia: | 13.2% |
| Here: | 17.9% |
| Virginia: | 10.2% |
| Here: | 12.8% |
| Virginia: | 18.7% |


