Kaysville, UT (Utah) Houses and Residents
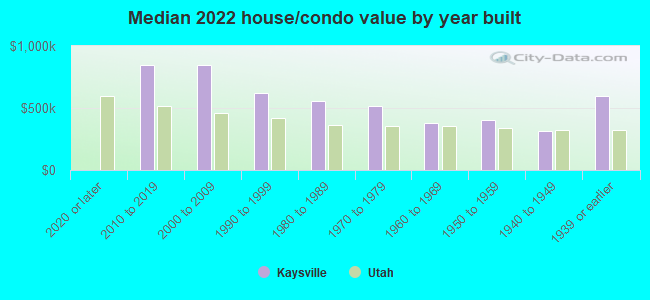
| Kaysville: | $642,967 |
| Utah: | $499,500 |
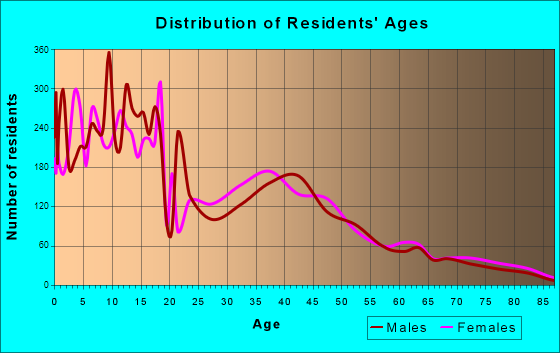
Total population: 29,494 (Urban population: 20,330, Rural population: 378 (55 farm, 323 nonfarm))
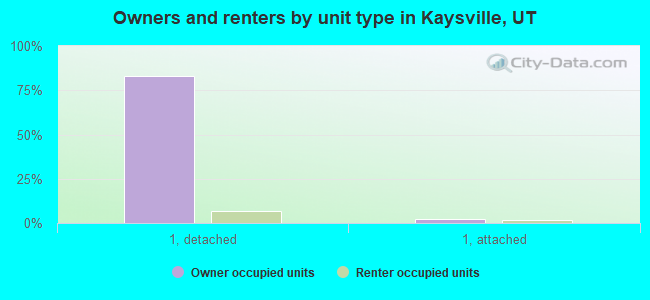
Houses: 9,540 (9,431 occupied: 8,229 owner occupied, 1,132 renter occupied)
| % of renters here: | 12% |
| State: | 29% |
Housing density: 945 houses/condos per square mile
Median price asked for vacant for-sale houses and condos in 2022 in this county: $500,085.
Median contract rent in 2022: $1,359 (lower quartile is $981, upper quartile is $1,763)
Median rent asked for vacant for-rent units in 2022: $1,517
Median gross rent in Kaysville, UT in 2022: $1,503
Housing units in Kaysville with a mortgage: 5,738 (911 second mortgage, 7 home equity loan, 958 both second mortgage and home equity loan)
Houses without a mortgage: 131
Median household income for houses/condos with a mortgage: $140,127
Median household income for apartments without a mortgage: $96,441
Median monthly housing costs: $1,635
Compare current foreclosures near Kaysville, UT:
| Photo | Address | Area | Beds / Baths | Price | Details |
|---|---|---|---|---|---|

|
#1
W 770 N
Kaysville, UT 84037
|
- sq. feet
|
- baths - beds |
show details | |

|
#2
S Wellington Dr
Kaysville, UT 84037
|
- sq. feet
|
- baths - beds |
show details | |

|
#3
E 270 S
Kaysville, UT 84037
|
- sq. feet
|
- baths - beds |
show details | |

|
#4
Homestead Ln
Kaysville, UT 84037
|
2,372 sq. feet
|
- baths - beds |
show details | |

|
#5
N Main St Unit 16
Kaysville, UT 84037
|
- sq. feet
|
- baths - beds |
show details | |

|
#6
S 50 W
Kaysville, UT 84037
|
- sq. feet
|
- baths - beds |
show details | |

|
#7
N 350 W
Kaysville, UT 84037
|
1,299 sq. feet
|
- baths - beds |
show details | |

|
#8
Whispering Meadow Ln
Kaysville, UT 84037
|
2,572 sq. feet
|
- baths - beds |
show details | |

|
#9
Kerrybrook Dr
Kaysville, UT 84037
|
3,945 sq. feet
|
- baths - beds |
show details | |

|
#10
Manchester Rd
Kaysville, UT 84037
|
1,245 sq. feet
|
- baths - beds |
show details |
| Photo | Address | Area | Beds / Baths | Price | Details |
|---|---|---|---|---|---|

|
#11
Phillips St
Kaysville, UT 84037
|
- sq. feet
|
- baths - beds |
show details | |

|
#12
N 200 E
Kaysville, UT 84037
|
1,672 sq. feet
|
- baths - beds |
show details | |

|
#13
N 400 W, Apt 2
Kaysville, UT 84037
|
- sq. feet
|
- baths - beds |
show details | |

|
#14
E 1700 S
Kaysville, UT 84037
|
1,126 sq. feet
|
- baths - beds |
show details | |

|
#15
E 200 N
Kaysville, UT 84037
|
1,008 sq. feet
|
- baths - beds |
show details | |

|
#16
W Mutton Hollow Rd Apt 119
Kaysville, UT 84037
|
- sq. feet
|
- baths - beds |
show details | |

|
#17
W 270 S
Kaysville, UT 84037
|
- sq. feet
|
- baths - beds |
show details | |

|
#18
S 25 W
Kaysville, UT 84037
|
1,411 sq. feet
|
- baths - beds |
show details | |

|
#19
E 200 N
Kaysville, UT 84037
|
- sq. feet
|
- baths - beds |
show details | |

|
#20
W Island Dr
Kaysville, UT 84037
|
- sq. feet
|
- baths - beds |
show details |
| Photo | Address | Area | Beds / Baths | Price | Details |
|---|---|---|---|---|---|

|
#21
E 425 S
Kaysville, UT 84037
|
1,665 sq. feet
|
- baths - beds |
show details | |

|
#22
E Center St
Kaysville, UT 84037
|
- sq. feet
|
- baths - beds |
show details | |

|
#23
S 2900 W
Ogden, UT 84401
|
1,186 sq. feet
|
2 baths 3 beds |
show details | |

|
#24
Foothill Dr
Ogden, UT 84403
|
3,219 sq. feet
|
3 baths 4 beds |
show details | |

|
#25
Polk Ave
Ogden, UT 84403
|
1,860 sq. feet
|
1 baths 4 beds |
show details | |

|
#26
W 4275 S
Ogden, UT 84401
|
2,154 sq. feet
|
3 baths 3 beds |
show details | |

|
#27
16th St
Ogden, UT 84404
|
- sq. feet
|
1 baths 2 beds |
show details | |

|
#28
S 2825 W
Roy, UT 84067
|
979 sq. feet
|
2 baths 5 beds |
show details | |

|
#29
W 4925 S
Roy, UT 84067
|
3,668 sq. feet
|
1 baths 5 beds |
show details | |

|
#30
E Canyon Dr
Ogden, UT 84405
|
1,595 sq. feet
|
2 baths 2 beds |
show details |
| Photo | Address | Area | Beds / Baths | Price | Details |
|---|---|---|---|---|---|

|
#31
N 360 W
Clearfield, UT 84015
|
1,099 sq. feet
|
1 baths 4 beds |
show details | |

|
#32
N Fairway Dr
North Salt Lake, UT 84054
|
2,929 sq. feet
|
3 baths 4 beds |
show details | |

|
#33
W 1200 N
Salt Lake City, UT 84116
|
1,683 sq. feet
|
2 baths 3 beds |
show details | |

|
#34
W Springfield Rd
Salt Lake City, UT 84116
|
1,890 sq. feet
|
3 baths 4 beds |
show details | |

|
#35
Antilles Dr
Salt Lake City, UT 84116
|
1,358 sq. feet
|
2 baths 3 beds |
show details | |

|
#36
N Topaz Dr
Salt Lake City, UT 84116
|
1,275 sq. feet
|
2 baths 3 beds |
show details | |

|
#37
Chatelain Rd
Ogden, UT 84403
|
- sq. feet
|
2 baths 5 beds |
show details | |

|
#38
W 1000 N
Salt Lake City, UT 84116
|
2,868 sq. feet
|
3 baths 7 beds |
show details | |

|
#39
W Springfield Rd
Salt Lake City, UT 84116
|
1,666 sq. feet
|
2 baths 3 beds |
show details | |

|
#40
N Oakley St
Salt Lake City, UT 84116
|
1,520 sq. feet
|
1 baths 4 beds |
show details |
| Photo | Address | Area | Beds / Baths | Price | Details |
|---|---|---|---|---|---|

|
#41
W Sterling Dr
Salt Lake City, UT 84116
|
1,052 sq. feet
|
1 baths 2 beds |
show details | |

|
#42
W Eclipse Way
Salt Lake City, UT 84116
|
1,136 sq. feet
|
1 baths 3 beds |
show details | |

|
#43
N Morton Dr
Salt Lake City, UT 84116
|
1,777 sq. feet
|
2 baths 3 beds |
show details | |

|
#44
Stallion Ln
Salt Lake City, UT 84116
|
1,412 sq. feet
|
2 baths 4 beds |
show details | |

|
#45
N 900 W
Salt Lake City, UT 84116
|
1,890 sq. feet
|
2 baths 5 beds |
show details | |

|
#46
W 900 N
Salt Lake City, UT 84116
|
2,661 sq. feet
|
2 baths 4 beds |
show details | |

|
#47
Sir Patrick Dr
Salt Lake City, UT 84116
|
2,471 sq. feet
|
4 baths 5 beds |
show details | |

|
#48
W 1700 N
Salt Lake City, UT 84116
|
1,404 sq. feet
|
2 baths 2 beds |
show details | |

|
#49
N Mandalay Rd
Salt Lake City, UT 84116
|
1,805 sq. feet
|
2 baths 3 beds |
show details | |

|
Check over 1 million property listings on Foreclosure.com!
|
browse all offers | |||

Latest news about housing in Kaysville, UT collected exclusively by city-data.com from local newspapers, TV, and radio stations

 | apartment for endeavour elementary Kaysville, UT (0 replies) |
| Questionsabout Kaysville (5 replies) |
| Layton/Kaysville to SLCC Commute? (8 replies) |
| Descriptions of Kaysville and Bountiful (3 replies) |
| Draper/Sandy Area vs Farmington/Kaysville, etc. Area (17 replies) |
| Utility Costs in Layton, Kaysville, Farmington, etc? (9 replies) |
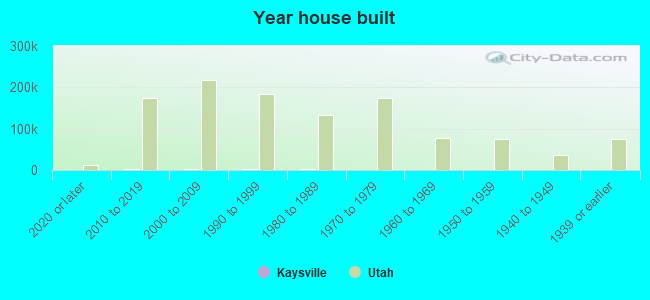
Median year apartment built: 1985
Household type by relationship:
Households: 33,337- Male householders: 4,890 (250 living alone), Female householders: 4,276 (657 living alone)
7,142 spouses (7,101 opposite-sex spouses), 196 unmarried partners, (118 opposite-sex unmarried partners), 14,568 children (13,959 natural, 410 adopted, 197 stepchildren), 528 grandchildren, 58 brothers or sisters, 179 parents, 0 foster children, 688 other relatives, 805 non-relatives
- In group quarters: 2
Size of family households: 2,708 2-persons, 1,090 3-persons, 1,561 4-persons, 1,152 5-persons, 930 6-persons, 758 7-or-more-persons.
Size of nonfamily households: 859 1-person, 307 2-persons, 15 4-persons.
10,313 married couples with children.
643 single-parent households (193 men, 450 women).
92.7% of residents of Kaysville speak English at home.
3.9% of residents speak Spanish at home (63% speak English very well, 27% speak English well, 11% speak English not well).
1.1% of residents speak other Indo-European language at home (63% speak English very well, 28% speak English well, 9% speak English not well).
1.7% of residents speak Asian or Pacific Island language at home (71% speak English very well, 29% speak English well).
0.2% of residents speak other language at home (100% speak English very well).
Foreign born population: 711 (2.1%)
(60.9% of them are naturalized citizens)
| Here: | 10.0 |
| State: | 7.6 |
| Here: | 5.8 |
| State: | 4.3 |
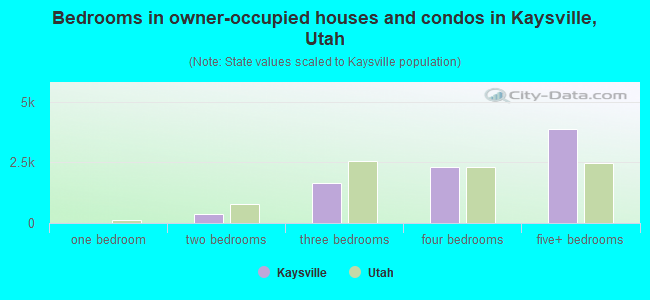
- Bedrooms in owner-occupied houses and condos in Kaysville, Utah
- 0no bedroom
- 161 bedroom
- 3702 bedrooms
- 1,6463 bedrooms
- 2,3224 bedrooms
- 3,8755+ bedrooms
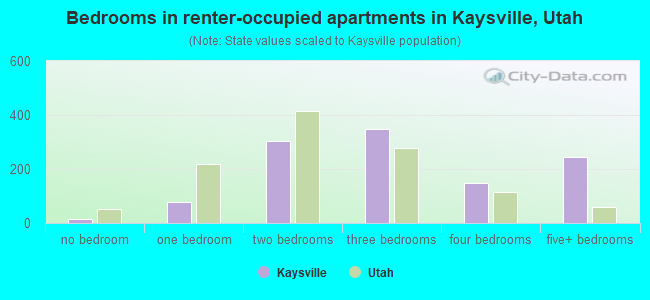
- Bedrooms in renter-occupied apartments in Kaysville, Utah
- 15no bedroom
- 771 bedroom
- 3032 bedrooms
- 3473 bedrooms
- 1474 bedrooms
- 2455+ bedrooms
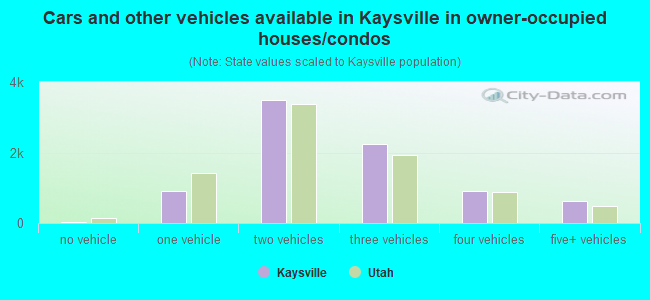
- Cars and other vehicles available in Kaysville in owner-occupied houses/condos
- 31no vehicle
- 9201 vehicle
- 3,4932 vehicles
- 2,2383 vehicles
- 9174 vehicles
- 6305+ vehicles
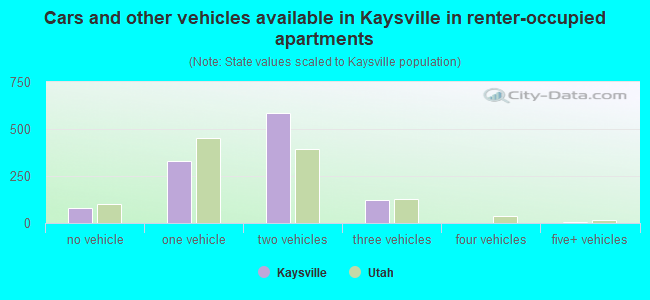
- Cars and other vehicles available in Kaysville in renter-occupied apartments
- 82no vehicle
- 3321 vehicle
- 5872 vehicles
- 1243 vehicles
- 04 vehicles
- 75+ vehicles
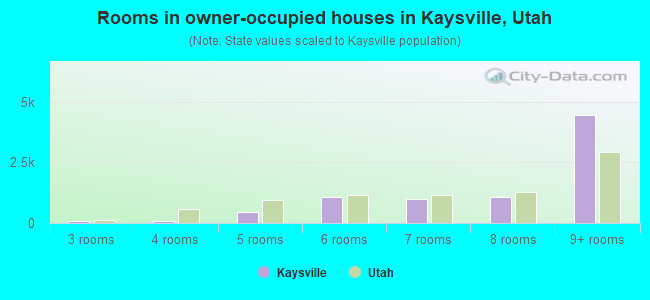
- Rooms in owner-occupied houses in Kaysville, Utah
- 01 room
- 02 rooms
- 823 rooms
- 1034 rooms
- 4455 rooms
- 1,0936 rooms
- 9857 rooms
- 1,0658 rooms
- 4,4569+ rooms
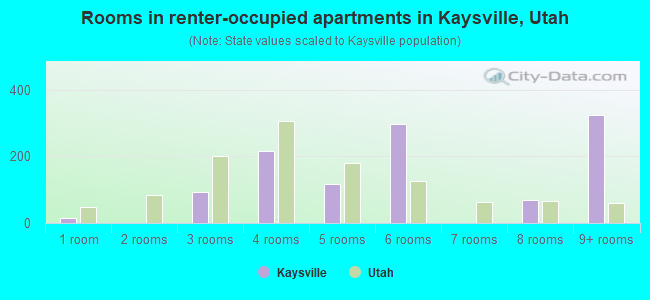
- Rooms in renter-occupied apartments in Kaysville, Utah
- 151 room
- 02 rooms
- 933 rooms
- 2174 rooms
- 1175 rooms
- 2976 rooms
- 07 rooms
- 708 rooms
- 3259+ rooms
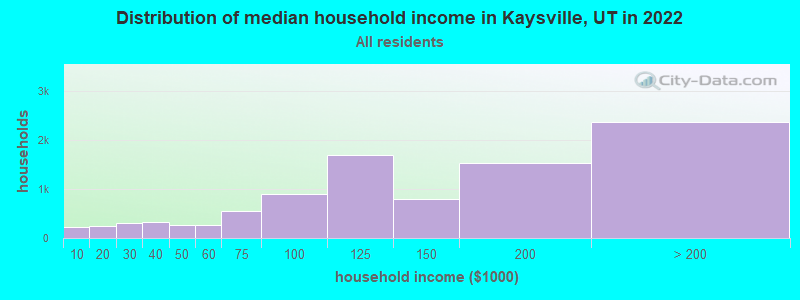
Kaysville, UT household income distribution

- 226Less than $10,000
- 243$10,000 to $19,999
- 307$20,000 to $29,999
- 319$30,000 to $39,999
- 260$40,000 to $49,999
- 260$50,000 to $59,999
- 560$60,000 to $74,999
- 899$75,000 to $99,999
- 1,693$100,000 to $124,999
- 806$125,000 to $149,999
- 1,527$150,000 to $199,999
- 2,369$200,000 or more
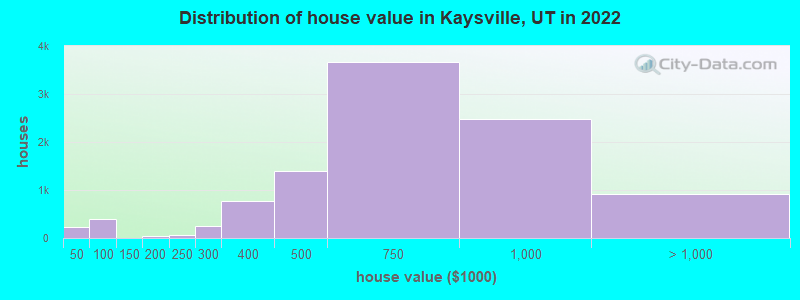
Home value of owner - occupied houses in 2022 in Kaysville, UT
-
- 45Less than $10,000
- 13$15,000 to $19,999
- 15$20,000 to $24,999
- 17$30,000 to $34,999
- 137$40,000 to $49,999
- 111$50,000 to $59,999
- 26$60,000 to $69,999
- 129$80,000 to $89,999
- 4$100,000 to $124,999
- 37$150,000 to $174,999
- 14$175,000 to $199,999
- 70$200,000 to $249,999
- 252$250,000 to $299,999
- 769$300,000 to $399,999
- 1,401$400,000 to $499,999
- 3,673$500,000 to $749,999
- 2,482$750,000 to $999,999
- 816$1,000,000 to $1,499,999
- 58$1,500,000 to $1,999,999
- 38$2,000,000 or more
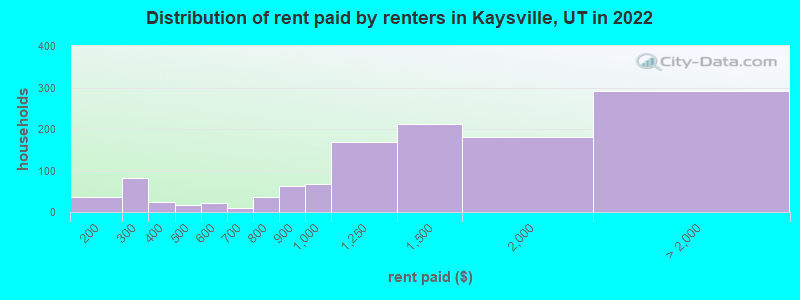
Rent paid by renters in 2022 in Kaysville, UT
-
- 37$150 to $199
- 80$200 to $249
- 11$300 to $349
- 12$350 to $399
- 15$450 to $499
- 21$550 to $599
- 8$650 to $699
- 11$700 to $749
- 23$750 to $799
- 63$800 to $899
- 68$900 to $999
- 167$1,000 to $1,249
- 211$1,250 to $1,499
- 180$1,500 to $1,999
- 159$2,000 to $2,499
- 67$2,500 to $2,999
- 64No cash rent
Percentage of workers working in this county: 69.2%
Number of people working at home: 4,047 (26.8% of all workers)
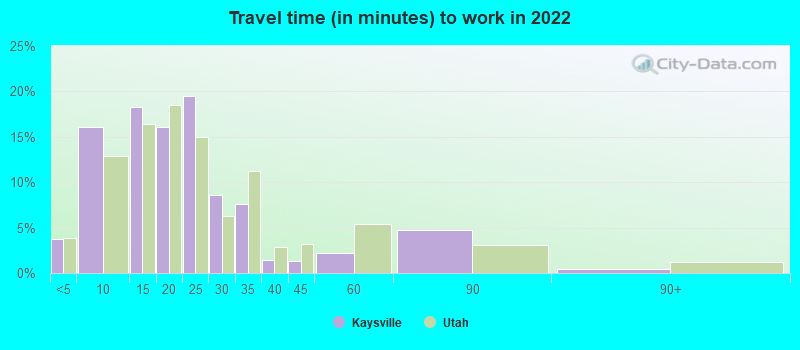
Travel time to work (commute)
- Less than 5 minutes: 429
- 5 to 9 minutes: 1,229
- 10 to 14 minutes: 1,624
- 15 to 19 minutes: 2,087
- 20 to 24 minutes: 1,367
- 25 to 29 minutes: 743
- 30 to 34 minutes: 1,685
- 35 to 39 minutes: 596
- 40 to 44 minutes: 435
- 45 to 59 minutes: 773
- 60 to 89 minutes: 330
- 90 or more minutes: 74
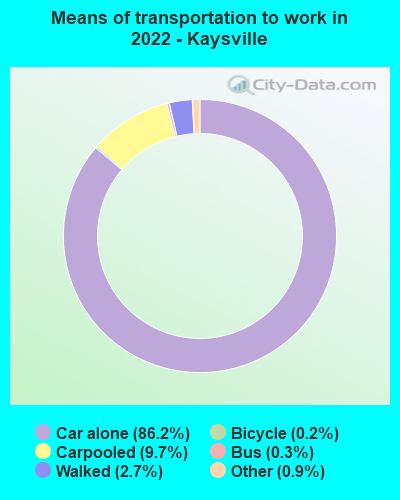
Means of transportation to work:
- Drove a car alone: 6,383 (56.9%)
- Carpooled: 905 (8.1%)
- Bus: 43 (0.4%)
- Taxi: 96 (0.9%)
- Bicycle: 16 (0.1%)
- Walked: 202 (1.8%)
- Worked at home: 4,047 (36.1%)
- Unemployment by race in 2022
- Unemployment rate for White non-Hispanic residents
- 1.6%Males
- 2.6%Females
- Unemployment rate for Black residents
- 100.0%Females
- Unemployment rate for American Indian and Alaska Native residents
- 20.3%Males
- Unemployment rate for two or more race residents
- 4.4%Males
- Unemployment rate for Hispanic or Latino residents
- 5.3%Females
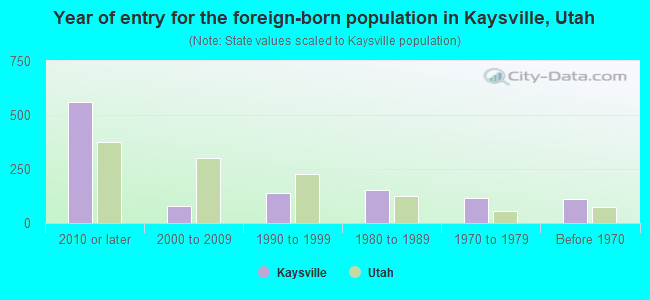
- Year of entry for the foreign-born population in Kaysville, Utah
- 5602010 or later
- 812000 to 2009
- 1401990 to 1999
- 1511980 to 1989
- 1151970 to 1979
- 112Before 1970
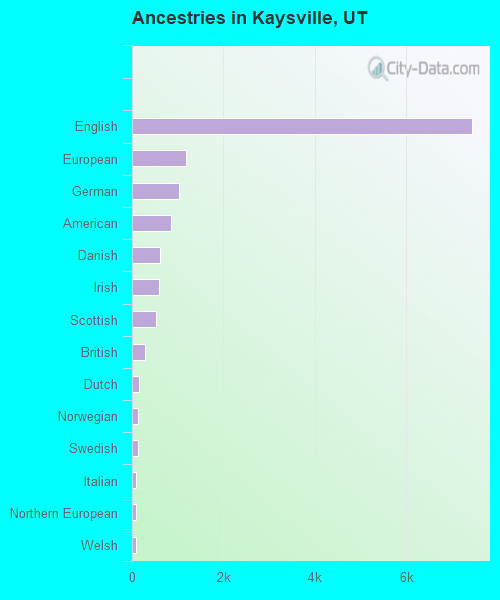
First ancestries reported:
- English: 7,442 (46.0%)
- European: 1,191 (7.4%)
- German: 1,025 (6.3%)
- American: 848 (5.2%)
- Danish: 607 (3.8%)
- Irish: 585 (3.6%)
- Scottish: 531 (3.3%)
- British: 294 (1.8%)
- Dutch: 149 (0.9%)
- Norwegian: 140 (0.9%)
- Swedish: 137 (0.8%)
- Italian: 95 (0.6%)
- Northern European: 89 (0.5%)
- Welsh: 80 (0.5%)
- Greek: 53 (0.3%)
- Czech: 48 (0.3%)
- Scandinavian: 41 (0.3%)
- Polish: 37 (0.2%)
- Russian: 32 (0.2%)
- Swiss: 28 (0.2%)
- French: 24 (0.1%)
- Austrian: 23 (0.1%)
- Ghanaian: 23 (0.1%)
- Scotch-Irish: 19 (0.1%)
- Portuguese: 18 (0.1%)
- Yugoslavian: 18 (0.1%)
- Canadian: 16 (0.10%)
- Finnish: 15 (0.09%)
- Icelander: 12 (0.07%)
- Croatian: 6 (0.04%)
- African: 2 (0.01%)
Most common places of birth for foreign-born residents (%):
| Kaysville: | 28.1% (258) |
| Utah: | 2.9% (8,017) |
| Kaysville: | 7.4% (68) |
| Utah: | 1.6% (4,524) |
| Kaysville: | 6.5% (60) |
| Utah: | 36.1% (99,740) |
| Kaysville: | 6.5% (60) |
| Utah: | 3.0% (8,341) |
| Kaysville: | 6.4% (59) |
| Utah: | 0.5% (1,315) |
| Kaysville: | 6.0% (55) |
| Utah: | 0.3% (917) |
| Kaysville: | 5.3% (49) |
| Utah: | 0.9% (2,365) |
| Kaysville: | 4.6% (42) |
| Utah: | 0.7% (1,814) |
| Kaysville: | 4.4% (40) |
| Utah: | 2.1% (5,902) |
| Kaysville: | 3.9% (36) |
| Utah: | 0.3% (865) |
| Kaysville: | 2.8% (26) |
| Utah: | 2.0% (5,555) |
| Kaysville: | 2.6% (24) |
| Utah: | 2.3% (6,468) |
| Kaysville: | 2.5% (23) |
| Utah: | 0.2% (415) |
| Kaysville: | 2.3% (21) |
| Utah: | 1.1% (2,900) |
| Kaysville: | 1.9% (17) |
| Utah: | 1.5% (4,247) |
Place of birth for U.S.-born residents:
- This state: 25,243
- Other state: 7,264
- Northeast: 474
- Midwest: 1,197
- South: 854
- West: 4,791
91.3% of Kaysville residents lived in the same house 1 years ago.
Out of people who lived in different houses, 40.4% lived in this county.
Out of people who lived in different counties, 52.8% lived in Utah.
| Kaysville: | 91.3% |
| State average: | 85.7% |
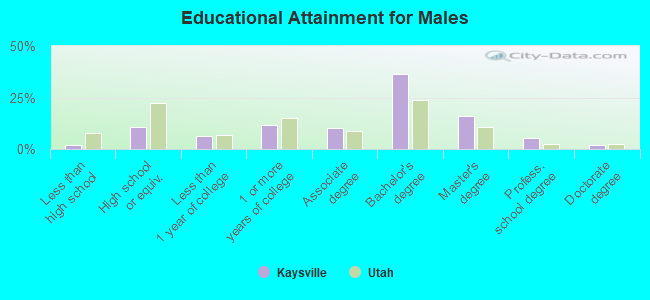
Education attainment for males 25 years and older:
- No schooling: 48
- Nursery to 4th grade: 0
- 5th and 6th grade: 35
- 7th and 8th grade: 0
- 9th grade: 0
- 10th grade: 0
- 11th grade: 52
- 12th grade, no diploma: 52
- High school graduate (or equivalency): 1,028
- Less than 1 year of college: 600
- Some college more than 1 year, no degree: 1,122
- Associate degree: 973
- Bachelor's degree: 3,539
- Master's degree: 1,572
- Professional school degree: 516
- Doctorate degree: 193
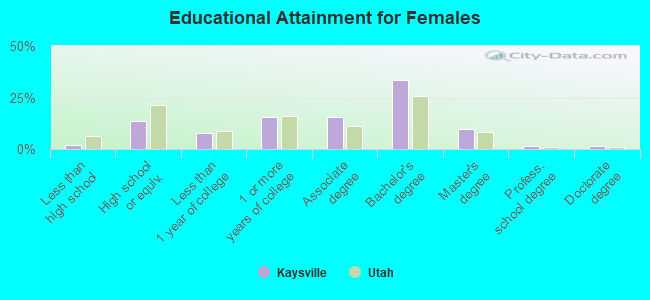
Education attainment for females 25 years and older:
- No schooling: 90
- Nursery to 4th grade: 0
- 5th and 6th grade: 0
- 7th and 8th grade: 13
- 9th grade: 24
- 10th grade: 0
- 11th grade: 32
- 12th grade, no diploma: 21
- High school graduate (or equivalency): 1,307
- Less than 1 year of college: 773
- Some college more than 1 year, no degree: 1,526
- Associate degree: 1,511
- Bachelor's degree: 3,264
- Master's degree: 932
- Professional school degree: 129
- Doctorate degree: 138
Housing units in structures:
- One, detached: 8,610
- One, attached: 305
- Two: 182
- 3 or 4: 136
- 5 to 9: 26
- 10 to 19: 109
- 20 to 49: 22
- 50 or more: 71
- Mobile homes: 77
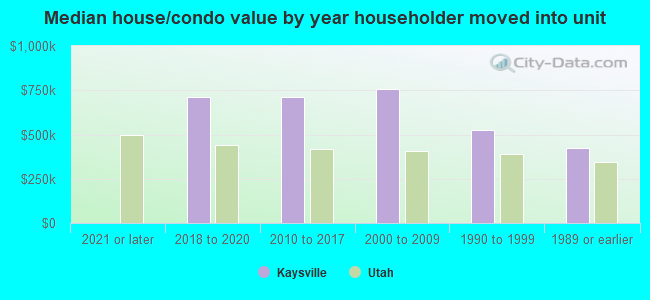
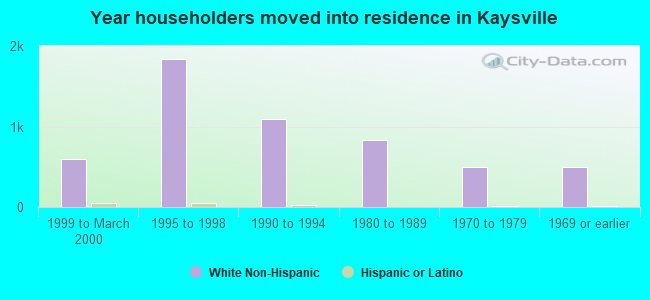
House/condo owner moved in on average 11 years ago
Renter moved in on average 3 years ago
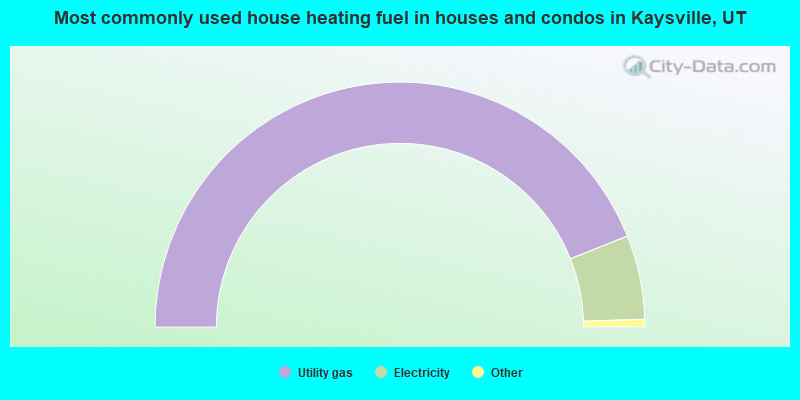
- 87.9%Utility gas
- 11.1%Electricity
- 0.7%Bottled, tank, or LP gas
- 0.2%Solar energy
- 0.1%No fuel used
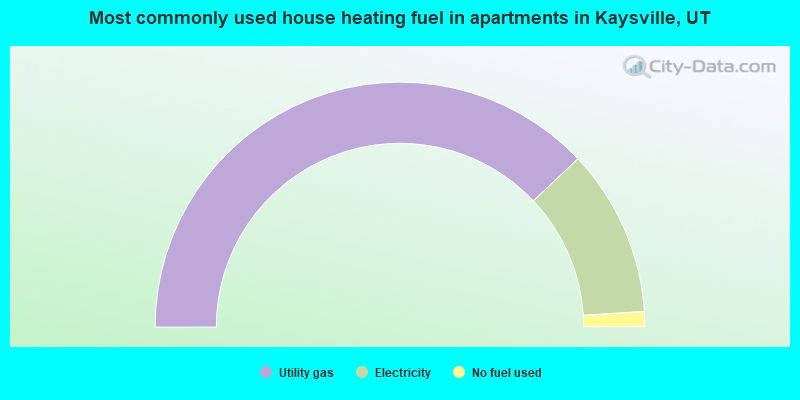
- 75.9%Utility gas
- 22.1%Electricity
- 2.0%No fuel used
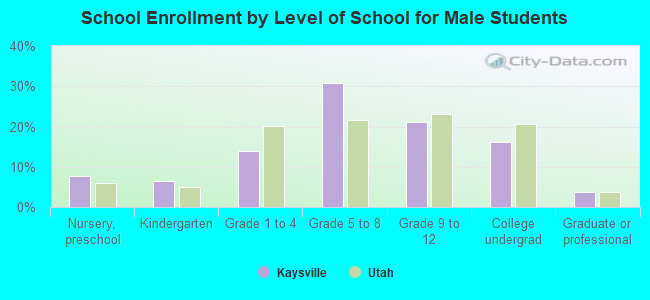
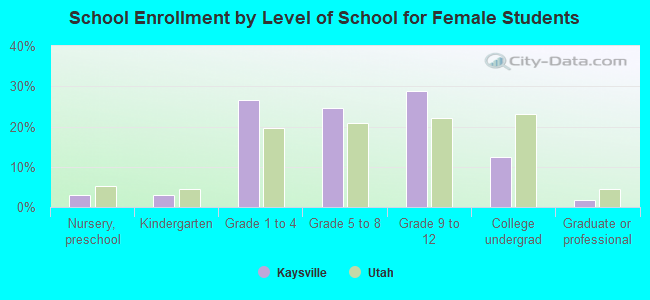
Private vs. public school enrollment:
| Here: | 1.5% |
| Utah: | 7.2% |
| Here: | 1.6% |
| Utah: | 5.3% |
| Here: | 45.0% |
| Utah: | 26.7% |