Kearny, NJ (New Jersey) Houses and Residents
| Kearny: | $436,609 |
| New Jersey: | $428,900 |
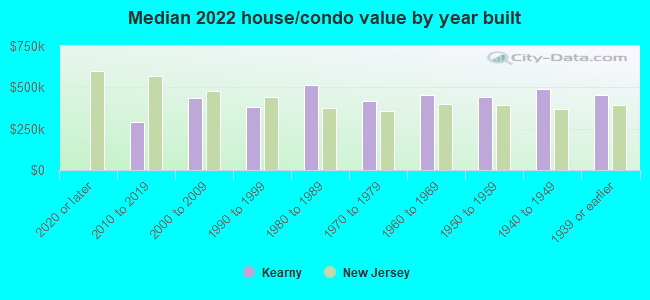
Mean price in 2022:
Detached houses: $392,034
Here: $392,034 State: $537,591 Townhouses or other attached units: $311,002
Here: $311,002 State: $381,113 In 2-unit structures: $416,080
Here: $416,080 State: $444,476 In 3-to-4-unit structures: $498,526
Here: $498,526 State: $457,463 In 5-or-more-unit structures: $406,902
Here: $406,902 State: $368,745
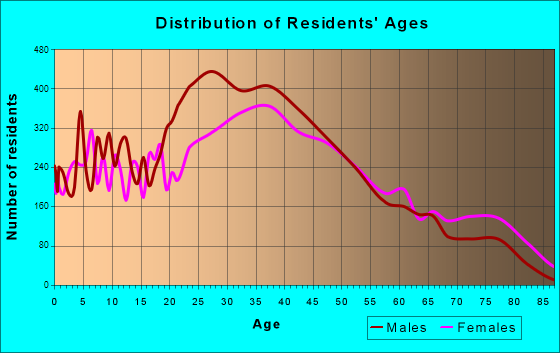
Total population: 41,837 (Urban population: 40,513, Rural population: 0)
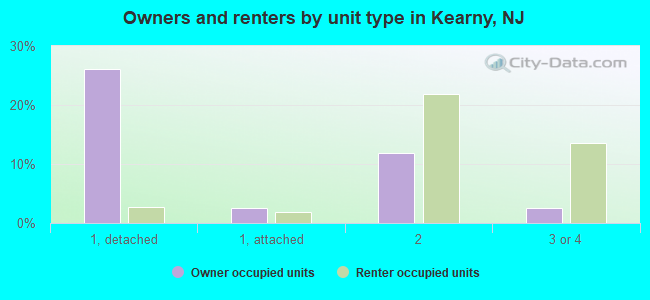
Houses: 15,738 (15,063 occupied: 7,278 owner occupied, 8,157 renter occupied)
| % of renters here: | 53% |
| State: | 35% |
Housing density: 1,722 houses/condos per square mile
Median price asked for vacant for-sale houses and condos in 2022: $396,973.
Median contract rent in 2022: $1,417 (lower quartile is $1,118, upper quartile is $1,778)
Median rent asked for vacant for-rent units in 2022: $1,126
Median gross rent in Kearny, NJ in 2022: $1,565
Housing units in Kearny with a mortgage: 4,311 (468 second mortgage, 0 home equity loan, 369 both second mortgage and home equity loan)
Houses without a mortgage: 62
Median household income for houses/condos with a mortgage: $117,529
Median household income for apartments without a mortgage: $90,827
Median monthly housing costs: $1,654
Compare current foreclosures in Kearny, NJ:
| Photo | Address | Area | Beds / Baths | Price | Details |
|---|---|---|---|---|---|

|
#1
Grand Pl
Kearny, NJ 07032
|
2,442 sq. feet
|
1 baths 3 beds |
show details | |

|
#2
Belgrove Dr
Kearny, NJ 07032
|
- sq. feet
|
- baths - beds |
show details | |

|
#3
Windsor St # 1
Kearny, NJ 07032
|
1,610 sq. feet
|
- baths - beds |
show details | |

|
#4
Devon St
Kearny, NJ 07032
|
1,236 sq. feet
|
- baths - beds |
show details | |

|
#5
Davis Ave
Kearny, NJ 07032
|
1,152 sq. feet
|
- baths - beds |
show details | |

|
#6
Quincy Ave # 1
Kearny, NJ 07032
|
- sq. feet
|
- baths - beds |
show details | |

|
#7
Elm St
Kearny, NJ 07032
|
1,888 sq. feet
|
- baths - beds |
show details | |

|
#8
Grand Pl
Kearny, NJ 07032
|
2,678 sq. feet
|
- baths - beds |
show details | |

|
#9
Devon Ter
Kearny, NJ 07032
|
- sq. feet
|
- baths - beds |
show details | |

|
#10
Chestnut St
Kearny, NJ 07032
|
2,573 sq. feet
|
- baths - beds |
show details |
| Photo | Address | Area | Beds / Baths | Price | Details |
|---|---|---|---|---|---|

|
#11
Davis Ave
Kearny, NJ 07032
|
964 sq. feet
|
- baths - beds |
show details | |

|
#12
Liberty St Apt 49
Kearny, NJ 07032
|
- sq. feet
|
- baths - beds |
show details | |

|
#13
Christopher Columbus Drive, Apt 3510
Kearny, NJ 07032
|
- sq. feet
|
- baths - beds |
show details | |

|
#14
Davis Ave
Kearny, NJ 07032
|
- sq. feet
|
- baths - beds |
show details | |

|
#15
Forest St
Kearny, NJ 07032
|
1,596 sq. feet
|
- baths - beds |
show details | |

|
#16
Hoyt St
Kearny, NJ 07032
|
1,952 sq. feet
|
- baths - beds |
show details | |

|
#17
Chestnut St
Kearny, NJ 07032
|
1,950 sq. feet
|
- baths - beds |
show details | |

|
#18
Maple St
Kearny, NJ 07032
|
2,790 sq. feet
|
- baths - beds |
show details | |

|
#19
Kearny Ave # 1
Kearny, NJ 07032
|
- sq. feet
|
- baths - beds |
show details | |

|
#20
Belgrove Dr
Kearny, NJ 07032
|
- sq. feet
|
- baths - beds |
show details |
| Photo | Address | Area | Beds / Baths | Price | Details |
|---|---|---|---|---|---|

|
#21
Elm St Apt A2
Kearny, NJ 07032
|
- sq. feet
|
- baths - beds |
show details | |

|
#22
Dukes St
Kearny, NJ 07032
|
20,200 sq. feet
|
- baths - beds |
show details | |

|
#23
Beech St Apt C2
Kearny, NJ 07032
|
- sq. feet
|
- baths - beds |
show details | |

|
#24
Devon St # 2
Kearny, NJ 07032
|
- sq. feet
|
- baths - beds |
show details | |

|
#25
Davis Ave
Kearny, NJ 07032
|
2,414 sq. feet
|
- baths - beds |
show details | |

|
#26
Schuyler Ave
Kearny, NJ 07032
|
1,344 sq. feet
|
- baths - beds |
show details | |

|
#27
Kearny Ave
Kearny, NJ 07032
|
- sq. feet
|
- baths - beds |
show details | |

|
#28
Forest St
Kearny, NJ 07032
|
1,887 sq. feet
|
- baths - beds |
show details | |

|
#29
Pavonia Ave # 2
Kearny, NJ 07032
|
2,185 sq. feet
|
- baths - beds |
show details | |

|
#30
Seeley Ave
Kearny, NJ 07032
|
1,464 sq. feet
|
- baths - beds |
show details |
| Photo | Address | Area | Beds / Baths | Price | Details |
|---|---|---|---|---|---|

|
#31
E Midland Ave
Kearny, NJ 07032
|
- sq. feet
|
- baths - beds |
show details | |

|
#32
Forest St
Kearny, NJ 07032
|
- sq. feet
|
- baths - beds |
show details | |

|
#33
Sellers St
Kearny, NJ 07032
|
- sq. feet
|
- baths - beds |
show details | |

|
#34
Forest St Apt 12
Kearny, NJ 07032
|
- sq. feet
|
- baths - beds |
show details | |

|
#35
Chestnut St
Kearny, NJ 07032
|
3,436 sq. feet
|
- baths - beds |
show details | |

|
#36
Beech St
Kearny, NJ 07032
|
- sq. feet
|
- baths - beds |
show details | |

|
#37
S Midland Ave Unit R4
Kearny, NJ 07032
|
- sq. feet
|
- baths - beds |
show details | |

|
#38
Chestmut St
Kearny, NJ 07032
|
1,950 sq. feet
|
- baths - beds |
show details | |

|
#39
Sanford Ave
Kearny, NJ 07032
|
- sq. feet
|
- baths - beds |
show details | |

|
#40
Tappan St
Kearny, NJ 07032
|
3,354 sq. feet
|
- baths - beds |
show details |
| Photo | Address | Area | Beds / Baths | Price | Details |
|---|---|---|---|---|---|

|
#41
Stuyvesant Ave
Kearny, NJ 07032
|
1,966 sq. feet
|
- baths - beds |
show details | |

|
#42
Bergen Ave
Kearny, NJ 07032
|
- sq. feet
|
- baths - beds |
show details | |

|
#43
Tappan St
Kearny, NJ 07032
|
3,318 sq. feet
|
- baths - beds |
show details | |

|
#44
Stuyvesant Ave
Kearny, NJ 07032
|
- sq. feet
|
- baths - beds |
show details | |

|
#45
Maple St
Kearny, NJ 07032
|
2,072 sq. feet
|
- baths - beds |
show details | |

|
#46
Pine St
Kearny, NJ 07032
|
1,520 sq. feet
|
- baths - beds |
show details | |

|
#47
Beech St
Kearny, NJ 07032
|
1,370 sq. feet
|
- baths - beds |
show details | |

|
#48
S Midland Ave Unit A1
Kearny, NJ 07032
|
- sq. feet
|
- baths - beds |
show details | |

|
#49
Chestnut St # 1
Kearny, NJ 07032
|
2,169 sq. feet
|
- baths - beds |
show details | |

|
Check over 1 million property listings on Foreclosure.com!
|
browse all offers | |||

Latest news about housing in Kearny, NJ collected exclusively by city-data.com from local newspapers, TV, and radio stations

 | Looking for an Apartment to Rent in the Kearny or West Orange Surroundings... Where Can I Find Them More Easily? (7 replies) |
| Looking For apartment/Home Rental in Kearny, NA, Nutley (8 replies) |
| Is Kearny, NJ “racist”? (38 replies) |
| House Rental in NJ within an hour of NYC? (7 replies) |
| Moving Back Home To NJ (54 replies) |
| north new jersey apartments (0 replies) |
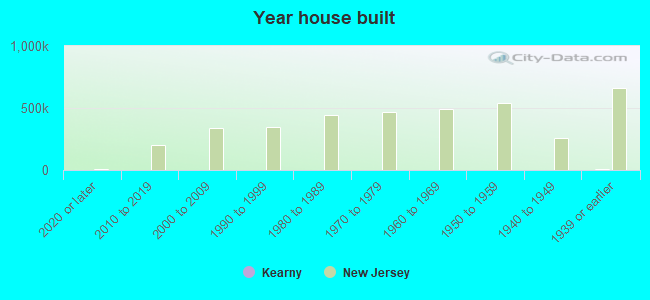
Median year apartment built: 1959
Household type by relationship:
Households: 40,656- Male householders: 7,839 (1,805 living alone), Female householders: 6,684 (1,412 living alone)
6,977 spouses (6,941 opposite-sex spouses), 968 unmarried partners, (931 opposite-sex unmarried partners), 12,106 children (11,441 natural, 219 adopted, 446 stepchildren), 553 grandchildren, 785 brothers or sisters, 1,054 parents, 6 foster children, 799 other relatives, 1,010 non-relatives
- In group quarters: 1,870
Size of family households: 3,799 2-persons, 3,000 3-persons, 2,125 4-persons, 993 5-persons, 335 6-persons, 185 7-or-more-persons.
Size of nonfamily households: 3,744 1-person, 570 2-persons, 196 3-persons, 20 4-persons, 1 5-persons.
4,528 married couples with children.
2,761 single-parent households (925 men, 1,836 women).
34.3% of residents of Kearny speak English at home.
42.9% of residents speak Spanish at home (53% speak English very well, 23% speak English well, 17% speak English not well, 7% don't speak English at all).
16.0% of residents speak other Indo-European language at home (61% speak English very well, 22% speak English well, 14% speak English not well, 2% don't speak English at all).
1.9% of residents speak Asian or Pacific Island language at home (56% speak English very well, 25% speak English well, 16% speak English not well, 3% don't speak English at all).
2.1% of residents speak other language at home (81% speak English very well, 18% speak English well, 1% speak English not well).
Foreign born population: 18,224 (44.8%)
(60.3% of them are naturalized citizens)
| Here: | 6.0 |
| State: | 6.8 |
| Here: | 4.0 |
| State: | 3.9 |
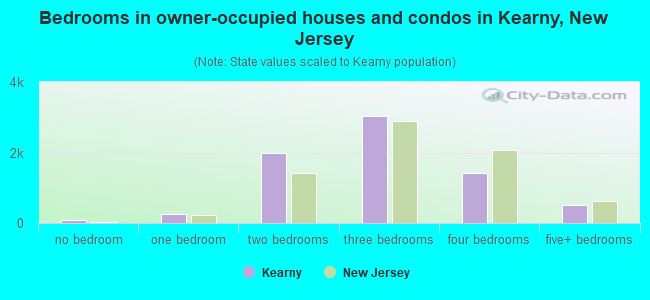
- Bedrooms in owner-occupied houses and condos in Kearny, New Jersey
- 71no bedroom
- 2581 bedroom
- 1,9882 bedrooms
- 3,0333 bedrooms
- 1,4304 bedrooms
- 4985+ bedrooms
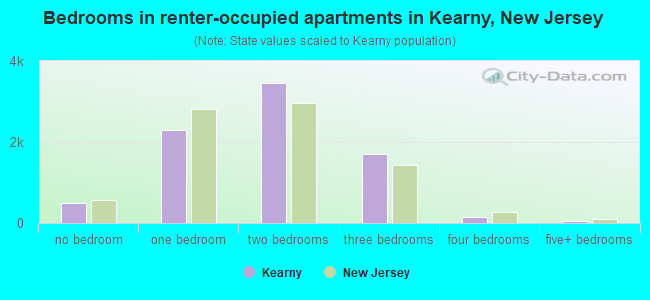
- Bedrooms in renter-occupied apartments in Kearny, New Jersey
- 496no bedroom
- 2,2941 bedroom
- 3,4522 bedrooms
- 1,7123 bedrooms
- 1494 bedrooms
- 555+ bedrooms
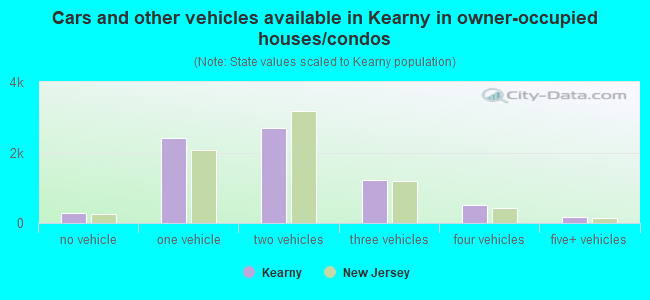
- Cars and other vehicles available in Kearny in owner-occupied houses/condos
- 276no vehicle
- 2,4031 vehicle
- 2,6902 vehicles
- 1,2083 vehicles
- 5184 vehicles
- 1845+ vehicles
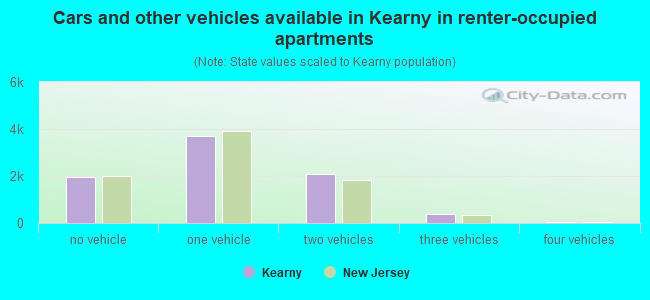
- Cars and other vehicles available in Kearny in renter-occupied apartments
- 1,939no vehicle
- 3,6871 vehicle
- 2,1032 vehicles
- 3873 vehicles
- 414 vehicles
- 05+ vehicles
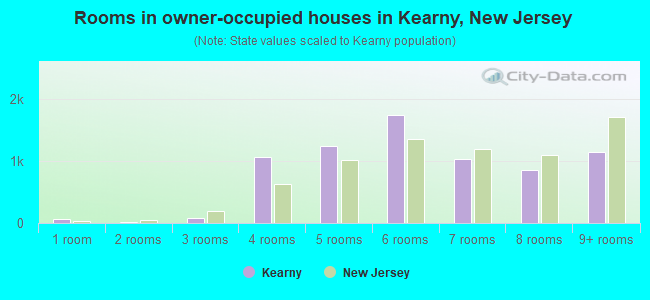
- Rooms in owner-occupied houses in Kearny, New Jersey
- 601 room
- 232 rooms
- 813 rooms
- 1,0674 rooms
- 1,2505 rooms
- 1,7476 rooms
- 1,0387 rooms
- 8588 rooms
- 1,1559+ rooms
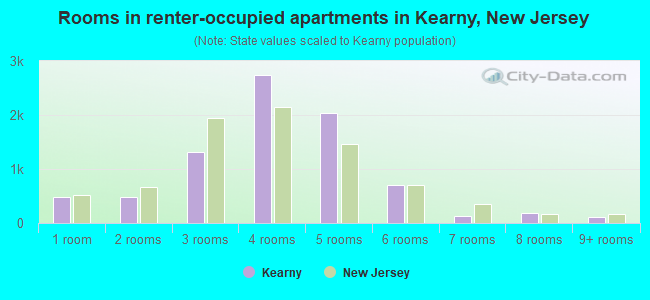
- Rooms in renter-occupied apartments in Kearny, New Jersey
- 4851 room
- 4762 rooms
- 1,3093 rooms
- 2,7444 rooms
- 2,0365 rooms
- 6996 rooms
- 1237 rooms
- 1788 rooms
- 1079+ rooms
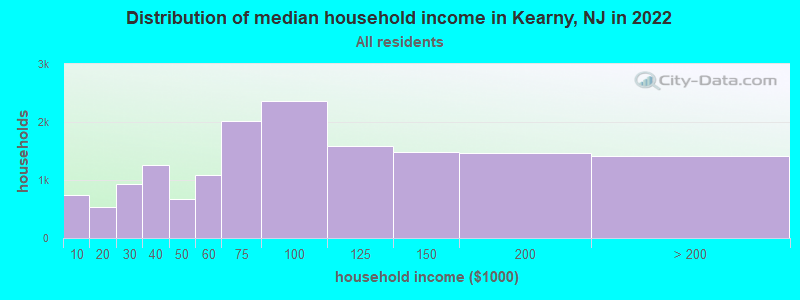
Kearny, NJ household income distribution

- 747Less than $10,000
- 537$10,000 to $19,999
- 925$20,000 to $29,999
- 1,260$30,000 to $39,999
- 679$40,000 to $49,999
- 1,094$50,000 to $59,999
- 2,011$60,000 to $74,999
- 2,354$75,000 to $99,999
- 1,583$100,000 to $124,999
- 1,482$125,000 to $149,999
- 1,457$150,000 to $199,999
- 1,413$200,000 or more
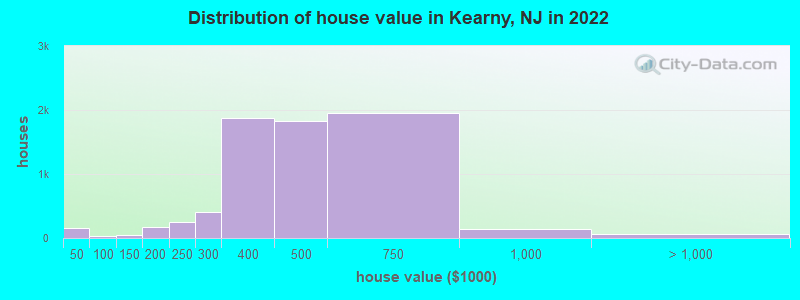
Home value of owner - occupied houses in 2022 in Kearny, NJ
-
- 130Less than $10,000
- 31$20,000 to $24,999
- 14$50,000 to $59,999
- 16$80,000 to $89,999
- 45$100,000 to $124,999
- 69$150,000 to $174,999
- 107$175,000 to $199,999
- 251$200,000 to $249,999
- 405$250,000 to $299,999
- 1,880$300,000 to $399,999
- 1,829$400,000 to $499,999
- 1,946$500,000 to $749,999
- 134$750,000 to $999,999
- 64$2,000,000 or more
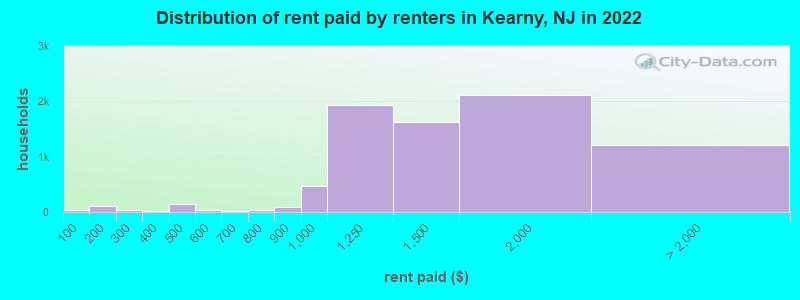
Rent paid by renters in 2022 in Kearny, NJ
-
- 31Less than $100
- 114$150 to $199
- 24$200 to $249
- 9$250 to $299
- 20$300 to $349
- 28$400 to $449
- 112$450 to $499
- 37$500 to $549
- 4$550 to $599
- 9$600 to $649
- 7$700 to $749
- 32$750 to $799
- 98$800 to $899
- 468$900 to $999
- 1,937$1,000 to $1,249
- 1,631$1,250 to $1,499
- 2,111$1,500 to $1,999
- 571$2,000 to $2,499
- 145$2,500 to $2,999
- 66$3,000 to $3,499
- 90$3,500 or more
- 330No cash rent
Percentage of workers working in this county: 44.0%
Number of people working at home: 1,164 (5.5% of all workers)
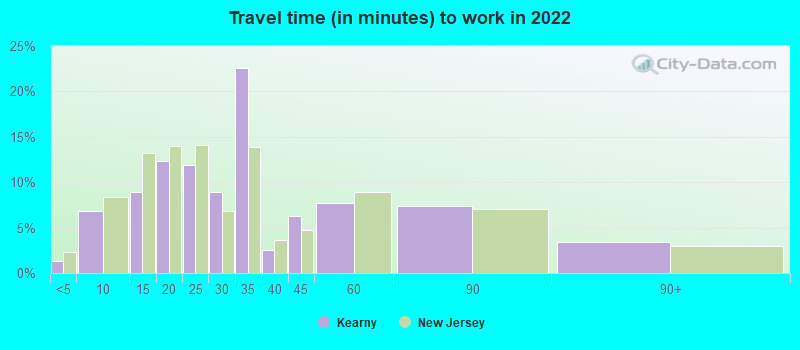
Travel time to work (commute)
- Less than 5 minutes: 344
- 5 to 9 minutes: 1,276
- 10 to 14 minutes: 1,576
- 15 to 19 minutes: 1,800
- 20 to 24 minutes: 3,290
- 25 to 29 minutes: 1,479
- 30 to 34 minutes: 2,817
- 35 to 39 minutes: 522
- 40 to 44 minutes: 1,270
- 45 to 59 minutes: 2,290
- 60 to 89 minutes: 1,763
- 90 or more minutes: 838
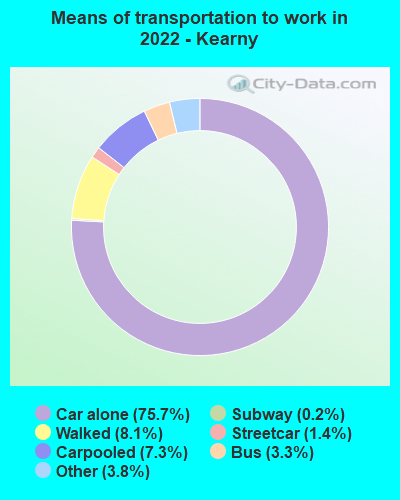
Means of transportation to work:
- Drove a car alone: 12,818 (67.4%)
- Carpooled: 1,299 (6.8%)
- Bus: 560 (2.9%)
- Subway or elevated rail: 202 (1.1%)
- Long-distance train or commuter rail: 30 (0.2%)
- Light rail, streetcar or trolley: 25 (0.1%)
- Taxi: 750 (3.9%)
- Bicycle: 5 (0.0%)
- Walked: 1,431 (7.5%)
- Worked at home: 1,164 (6.1%)
- Unemployment by race in 2022
- Unemployment rate for White non-Hispanic residents
- 7.0%Males
- 4.0%Females
- Unemployment rate for Black residents
- 5.3%Males
- 14.1%Females
- Unemployment rate for other race residents
- 2.2%Males
- 6.1%Females
- Unemployment rate for two or more race residents
- 5.0%Males
- 2.6%Females
- Unemployment rate for Hispanic or Latino residents
- 4.0%Males
- 4.9%Females
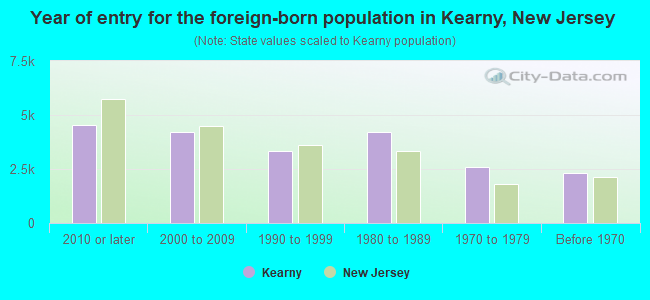
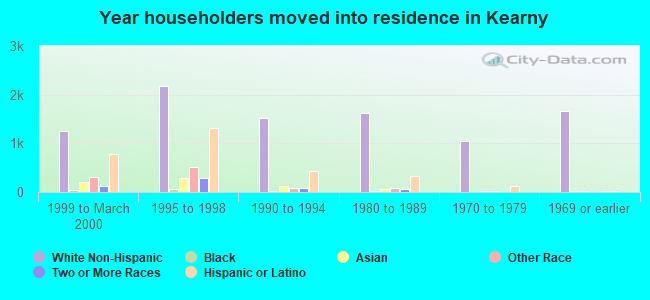
- Year of entry for the foreign-born population in Kearny, New Jersey
- 4,5332010 or later
- 4,1902000 to 2009
- 3,3431990 to 1999
- 4,1921980 to 1989
- 2,6131970 to 1979
- 2,293Before 1970
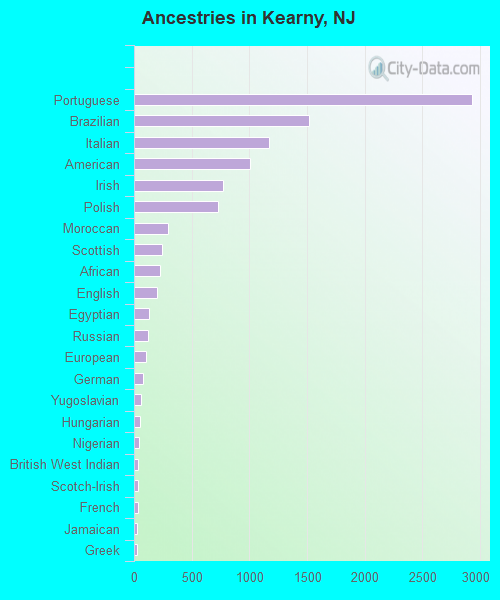
First ancestries reported:
- Portuguese: 2,930 (11.6%)
- Brazilian: 1,515 (6.0%)
- Italian: 1,170 (4.6%)
- American: 1,007 (4.0%)
- Irish: 769 (3.0%)
- Polish: 730 (2.9%)
- Moroccan: 294 (1.2%)
- Scottish: 243 (1.0%)
- African: 221 (0.9%)
- English: 201 (0.8%)
- Egyptian: 132 (0.5%)
- Russian: 120 (0.5%)
- European: 108 (0.4%)
- German: 75 (0.3%)
- Yugoslavian: 63 (0.2%)
- Hungarian: 49 (0.2%)
- Nigerian: 45 (0.2%)
- British West Indian: 38 (0.2%)
- Scotch-Irish: 34 (0.1%)
- French: 32 (0.1%)
- Jamaican: 29 (0.1%)
- Greek: 28 (0.1%)
- Dutch: 23 (0.09%)
- Trinidadian and Tobagonian: 19 (0.08%)
- British: 18 (0.07%)
- Arab: 17 (0.07%)
- Romanian: 16 (0.06%)
- Bahamian: 16 (0.06%)
- Kenyan: 15 (0.06%)
- Syrian: 11 (0.04%)
- Iranian: 11 (0.04%)
- Croatian: 10 (0.04%)
- French Canadian: 9 (0.04%)
- Lithuanian: 9 (0.04%)
- Turkish: 7 (0.03%)
- Eastern European: 6 (0.02%)
- Guyanese: 3 (0.01%)
- Sudanese: 3 (0.01%)
Most common places of birth for foreign-born residents (%):
| Kearny: | 14.9% (2,868) |
| New Jersey: | 2.7% (58,563) |
| Kearny: | 14.6% (2,808) |
| New Jersey: | 4.4% (95,275) |
| Kearny: | 12.1% (2,327) |
| New Jersey: | 2.1% (46,020) |
| Kearny: | 11.1% (2,122) |
| New Jersey: | 1.3% (28,871) |
| Kearny: | 8.4% (1,604) |
| New Jersey: | 9.7% (209,055) |
| Kearny: | 5.0% (965) |
| New Jersey: | 0.5% (10,246) |
| Kearny: | 5.0% (964) |
| New Jersey: | 4.2% (90,817) |
| Kearny: | 3.2% (613) |
| New Jersey: | 2.1% (45,435) |
| Kearny: | 2.8% (530) |
| New Jersey: | 4.8% (102,527) |
| Kearny: | 2.3% (445) |
| New Jersey: | 0.3% (6,972) |
| Kearny: | 2.3% (441) |
| New Jersey: | 2.3% (48,811) |
| Kearny: | 1.7% (326) |
| New Jersey: | 2.3% (48,885) |
| Kearny: | 1.6% (315) |
| New Jersey: | 3.7% (78,969) |
| Kearny: | 1.6% (298) |
| New Jersey: | 0.3% (5,621) |
Place of birth for U.S.-born residents:
- This state: 17,165
- Other state: 3,872
- Northeast: 3,116
- Midwest: 53
- South: 690
- West: 55
89.7% of Kearny residents lived in the same house 1 years ago.
Out of people who lived in different houses, 29.4% lived in this county.
Out of people who lived in different counties, 68.8% lived in New Jersey.
| Kearny: | 89.7% |
| State average: | 90.4% |
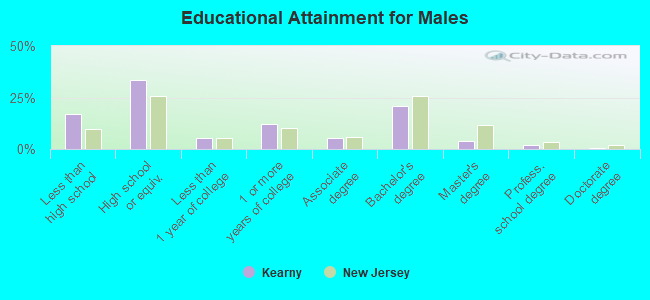
Education attainment for males 25 years and older:
- No schooling: 586
- Nursery to 4th grade: 70
- 5th and 6th grade: 212
- 7th and 8th grade: 389
- 9th grade: 273
- 10th grade: 234
- 11th grade: 322
- 12th grade, no diploma: 521
- High school graduate (or equivalency): 5,186
- Less than 1 year of college: 811
- Some college more than 1 year, no degree: 1,838
- Associate degree: 792
- Bachelor's degree: 3,246
- Master's degree: 590
- Professional school degree: 306
- Doctorate degree: 75
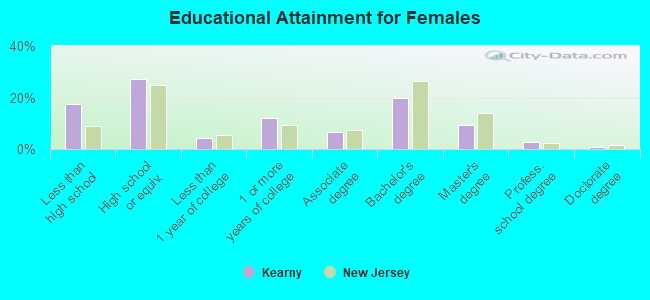
Education attainment for females 25 years and older:
- No schooling: 511
- Nursery to 4th grade: 99
- 5th and 6th grade: 307
- 7th and 8th grade: 317
- 9th grade: 73
- 10th grade: 45
- 11th grade: 366
- 12th grade, no diploma: 658
- High school graduate (or equivalency): 3,742
- Less than 1 year of college: 567
- Some college more than 1 year, no degree: 1,668
- Associate degree: 893
- Bachelor's degree: 2,721
- Master's degree: 1,257
- Professional school degree: 372
- Doctorate degree: 86
Housing units in structures:
- One, detached: 5,294
- One, attached: 635
- Two: 4,634
- 3 or 4: 1,951
- 5 to 9: 833
- 10 to 19: 1,037
- 20 to 49: 705
- 50 or more: 617
- Mobile homes: 22
- Boats, RVs, vans, etc.: 4
Housing units lacking complete kitchen facilities in 2022: 2.3%
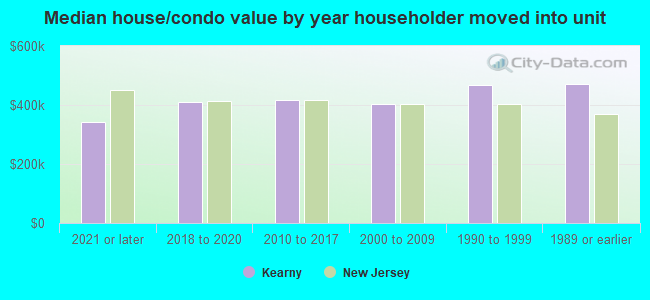
House/condo owner moved in on average 19 years ago
Renter moved in on average 5 years ago
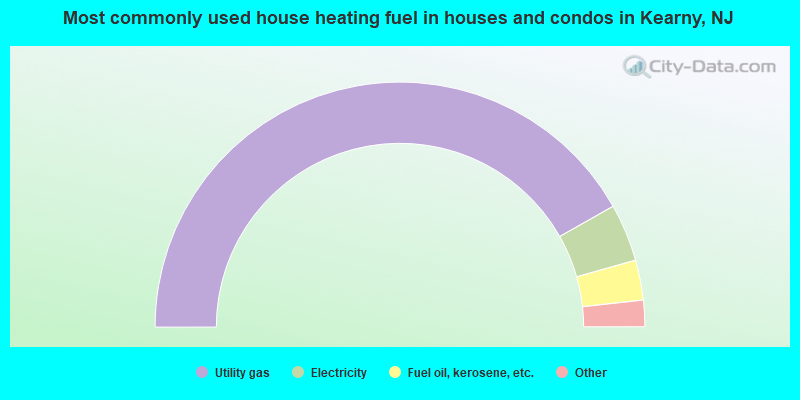
- 83.6%Utility gas
- 7.6%Electricity
- 5.3%Fuel oil, kerosene, etc.
- 2.6%Bottled, tank, or LP gas
- 0.3%Solar energy
- 0.3%Other fuel
- 0.2%No fuel used
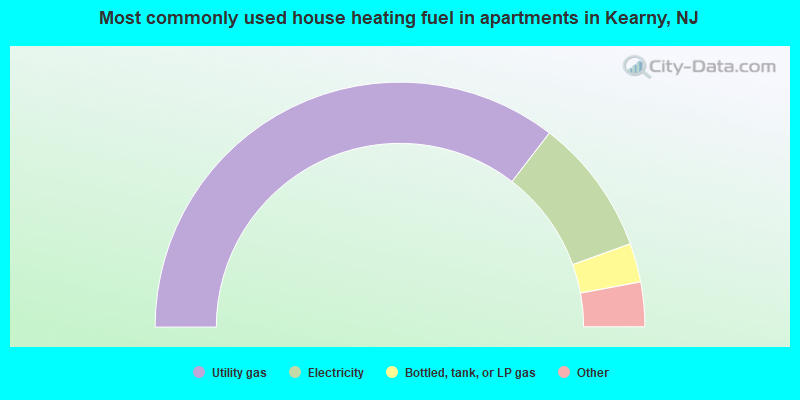
- 70.9%Utility gas
- 18.1%Electricity
- 5.1%Bottled, tank, or LP gas
- 4.0%Fuel oil, kerosene, etc.
- 1.4%No fuel used
- 0.6%Other fuel
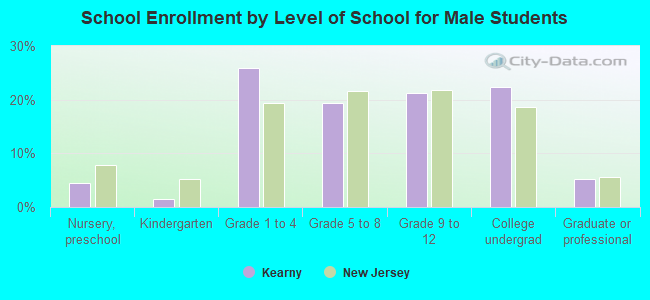
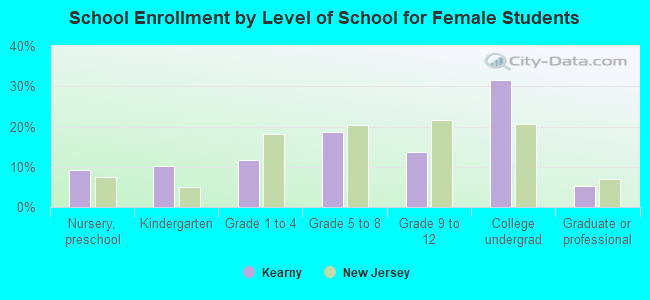
Private vs. public school enrollment:
| Here: | 2.5% |
| New Jersey: | 12.3% |
| Here: | 12.9% |
| New Jersey: | 13.1% |
| Here: | 32.6% |
| New Jersey: | 33.2% |