Kendall, FL (Florida) Houses and Residents
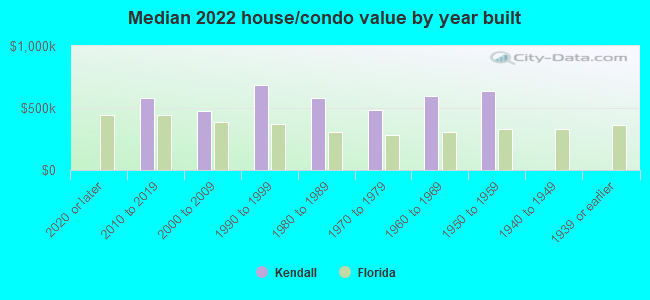
| Kendall: | $571,400 |
| Florida: | $354,100 |
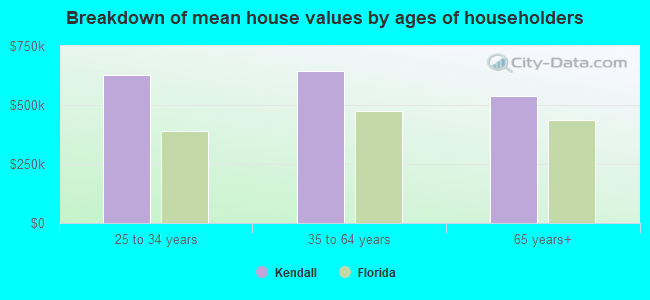
Mean price in 2022:
Detached houses: $855,713
Here: $855,713 State: $500,941 Townhouses or other attached units: $392,541
Here: $392,541 State: $370,869 In 2-unit structures: $304,004
Here: $304,004 State: $423,188 In 3-to-4-unit structures: $383,883
Here: $383,883 State: $309,944 In 5-or-more-unit structures: $278,221
Here: $278,221 State: $447,145 Mobile homes: $333,398
Here: $333,398 State: $113,202
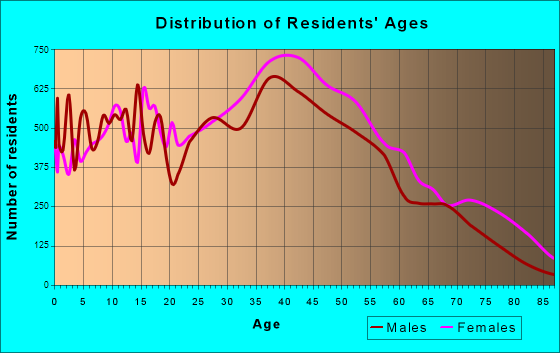
Total population: 75,371 (Urban population: 75,279, Rural population: 0)
Houses: 32,940 (31,159 occupied: 19,921 owner occupied, 11,238 renter occupied)
| % of renters here: | 36% |
| State: | 33% |
Housing density: 2,043 houses/condos per square mile
Median price asked for vacant for-sale houses and condos in 2022: $1,189,985.
Median contract rent in 2022: $1,681 (lower quartile is $1,424, upper quartile is $1,905)
Median rent asked for vacant for-rent units in 2022: $1,633
Median gross rent in Kendall, FL in 2022: $1,776
Housing units in Kendall with a mortgage: 13,098 (1,330 second mortgage, 0 home equity loan, 1,233 both second mortgage and home equity loan)
Houses without a mortgage: 798
Median household income for houses/condos with a mortgage: $129,659
Median household income for apartments without a mortgage: $95,017
Median monthly housing costs: $1,820
Compare current foreclosures near Kendall, FL:
| Photo | Address | Area | Beds / Baths | Price | Details |
|---|---|---|---|---|---|

|
#1
E 35th St
Hialeah, FL 33013
|
1,690 sq. feet
|
1 baths 2 beds |
$436,000
|
show details |

|
#2
NE 1st Ave Unit #2200
Miami, FL 33132
|
- sq. feet
|
2 baths 1 beds |
$715,000
|
show details |

|
#3
-2922 SW 37 Ct
Miami, FL 33134
|
2,369 sq. feet
|
3 baths 5 beds |
show details | |

|
#4
Harding Ln
Homestead, FL 33033
|
1,037 sq. feet
|
1 baths 2 beds |
show details | |

|
#5
NW 42nd Ave Apt 407
Miami, FL 33126
|
958 sq. feet
|
2 baths 2 beds |
show details | |

|
#6
W 6th Ave
Hialeah, FL 33014
|
780 sq. feet
|
1 baths 2 beds |
show details | |

|
#7
Lenox Ave Apt 17
Miami Beach, FL 33139
|
569 sq. feet
|
1 baths 1 beds |
show details | |

|
#8
W 28th Ct Unit 106
Hialeah, FL 33018
|
850 sq. feet
|
2 baths 2 beds |
show details | |

|
#9
SW 202nd Ter
Miami, FL 33189
|
1,668 sq. feet
|
2 baths 3 beds |
show details | |

|
#10
SW 87th Pl Dr
Miami, FL 33165
|
1,545 sq. feet
|
2 baths 3 beds |
show details |
| Photo | Address | Area | Beds / Baths | Price | Details |
|---|---|---|---|---|---|

|
#11
SW 194th Ave
Homestead, FL 33030
|
1,790 sq. feet
|
2 baths 3 beds |
show details | |

|
#12
NW 19th 354
Miami, FL 33136
|
1,114 sq. feet
|
1 baths 4 beds |
show details | |

|
#13
E 8th Ln
Hialeah, FL 33013
|
1,696 sq. feet
|
1 baths 3 beds |
show details | |

|
#14
NW 10th Ave
Miami, FL 33128
|
2,973 sq. feet
|
1 baths 2 beds |
show details | |

|
#15
SW 3rd Ave
Miami, FL 33145
|
1,666 sq. feet
|
3 baths 3 beds |
show details | |

|
#16
SW 144th Ct
Miami, FL 33186
|
2,084 sq. feet
|
2 baths 4 beds |
show details | |

|
#17
SW 19th St
Miami, FL 33145
|
2,689 sq. feet
|
3 baths 5 beds |
show details | |

|
#18
NW 33rd Avenue Rd
Miami, FL 33147
|
912 sq. feet
|
1 baths 3 beds |
show details | |

|
#19
NE 2nd Ave
Miami, FL 33132
|
662 sq. feet
|
1 baths 1 beds |
show details | |

|
#20
SW 107th Pl
Miami, FL 33157
|
2,196 sq. feet
|
2 baths 3 beds |
show details |
| Photo | Address | Area | Beds / Baths | Price | Details |
|---|---|---|---|---|---|

|
#21
SW 148th Path
Miami, FL 33196
|
1,371 sq. feet
|
2 baths 3 beds |
show details | |

|
#22
NW 102nd St
Miami, FL 33147
|
1,501 sq. feet
|
2 baths 4 beds |
show details | |

|
#23
SW 38th Ln
Miami, FL 33165
|
1,233 sq. feet
|
2 baths 2 beds |
show details | |

|
#24
SW 99th St
Miami, FL 33196
|
2,601 sq. feet
|
3 baths 4 beds |
show details | |

|
#25
SW 148th Pl
Miami, FL 33196
|
1,763 sq. feet
|
2 baths 3 beds |
show details | |

|
#26
E 20th St
Hialeah, FL 33013
|
1,444 sq. feet
|
1 baths 2 beds |
show details | |

|
#27
SE 37th Pl
Homestead, FL 33033
|
2,732 sq. feet
|
3 baths 5 beds |
show details | |

|
#28
SW 128th St
Miami, FL 33176
|
1,956 sq. feet
|
1 baths 3 beds |
show details | |

|
#29
NE 14th St
Homestead, FL 33033
|
2,603 sq. feet
|
3 baths 3 beds |
show details | |

|
#30
- 830 NW 23rd Ct
Miami, FL 33125
|
- sq. feet
|
4 baths 6 beds |
show details |
| Photo | Address | Area | Beds / Baths | Price | Details |
|---|---|---|---|---|---|

|
#31
SW 165th Ter
Miami, FL 33157
|
2,746 sq. feet
|
2 baths 4 beds |
show details | |

|
#32
NW 58th Ter
Miami, FL 33178
|
2,450 sq. feet
|
3 baths 4 beds |
show details | |

|
#33
SW 6th St
Miami, FL 33144
|
1,869 sq. feet
|
2 baths 3 beds |
show details | |

|
#34
SW 153rd Ter
Miami, FL 33177
|
1,842 sq. feet
|
2 baths 4 beds |
show details | |

|
#35
SW 9th St
Miami, FL 33184
|
1,877 sq. feet
|
3 baths 4 beds |
show details | |

|
#36
E 9th Ct
Hialeah, FL 33013
|
1,541 sq. feet
|
1 baths 3 beds |
show details | |

|
#37
SW 117th Ct
Miami, FL 33175
|
2,047 sq. feet
|
3 baths 4 beds |
show details | |

|
#38
SW 161st Ave
Miami, FL 33196
|
1,972 sq. feet
|
2 baths 3 beds |
show details | |

|
#39
SW 9th Ln
Miami, FL 33194
|
1,775 sq. feet
|
3 baths 3 beds |
show details | |

|
#40
SW 122nd St
Miami, FL 33186
|
2,310 sq. feet
|
3 baths 4 beds |
show details |
| Photo | Address | Area | Beds / Baths | Price | Details |
|---|---|---|---|---|---|

|
#41
SW 31st St
Miami, FL 33155
|
2,110 sq. feet
|
3 baths 3 beds |
show details | |

|
#42
SW 154th Ct
Homestead, FL 33033
|
915 sq. feet
|
1 baths 2 beds |
show details | |

|
#43
SW 123rd Ave
Homestead, FL 33032
|
877 sq. feet
|
1 baths 2 beds |
show details | |

|
#44
NW 2nd St
Miami, FL 33126
|
962 sq. feet
|
1 baths 3 beds |
show details | |

|
#45
NW 7th Ln
Miami, FL 33182
|
2,971 sq. feet
|
3 baths 4 beds |
show details | |

|
#46
SW 3rd St
Miami, FL 33144
|
2,068 sq. feet
|
2 baths 3 beds |
show details | |

|
#47
SW 9th Ter
Miami, FL 33134
|
677 sq. feet
|
3 baths 3 beds |
show details | |

|
#48
SW 6th St
Miami, FL 33134
|
1,654 sq. feet
|
1 baths 2 beds |
show details | |

|
#49
NW 132nd Ct
Miami, FL 33182
|
1,546 sq. feet
|
2 baths 3 beds |
show details | |

|
Check over 1 million property listings on Foreclosure.com!
|
browse all offers | |||

Latest news about housing in Kendall, FL collected exclusively by city-data.com from local newspapers, TV, and radio stations


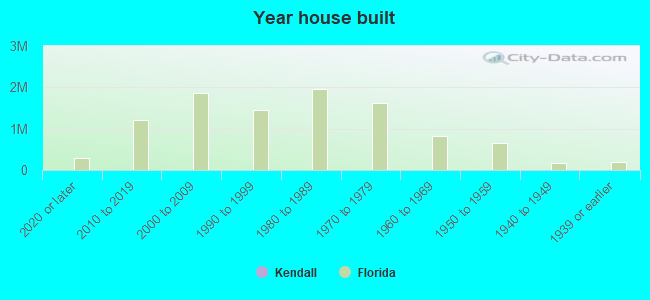
Median year apartment built: 1979
Household type by relationship:
Households: 80,912- Male householders: 13,597 (2,351 living alone), Female householders: 17,562 (5,509 living alone)
13,920 spouses (13,539 opposite-sex spouses), 1,859 unmarried partners, (1,680 opposite-sex unmarried partners), 22,050 children (20,894 natural, 927 adopted, 229 stepchildren), 563 grandchildren, 2,026 brothers or sisters, 3,147 parents, 0 foster children, 1,594 other relatives, 3,038 non-relatives
- In group quarters: 1,556
Size of family households: 8,053 2-persons, 7,174 3-persons, 3,880 4-persons, 1,749 5-persons, 225 6-persons, 66 7-or-more-persons.
Size of nonfamily households: 7,860 1-person, 1,690 2-persons, 77 3-persons, 339 4-persons, 46 6-persons.
9,303 married couples with children.
3,771 single-parent households (1,163 men, 2,608 women).
32.8% of residents of Kendall speak English at home.
61.3% of residents speak Spanish at home (64% speak English very well, 19% speak English well, 11% speak English not well, 6% don't speak English at all).
3.7% of residents speak other Indo-European language at home (88% speak English very well, 9% speak English well, 3% speak English not well).
1.7% of residents speak Asian or Pacific Island language at home (65% speak English very well, 24% speak English well, 11% speak English not well).
0.3% of residents speak other language at home (52% speak English very well, 45% speak English well, 2% speak English not well).
Foreign born population: 35,138 (43.4%)
(75.9% of them are naturalized citizens)
| Here: | 5.9 |
| State: | 5.9 |
| Here: | 4.0 |
| State: | 4.2 |
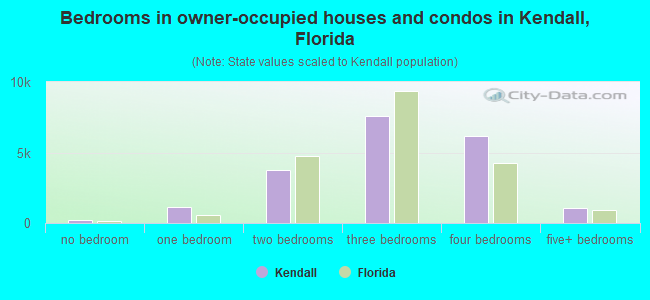
- Bedrooms in owner-occupied houses and condos in Kendall, Florida
- 234no bedroom
- 1,1081 bedroom
- 3,7302 bedrooms
- 7,5873 bedrooms
- 6,1634 bedrooms
- 1,0995+ bedrooms
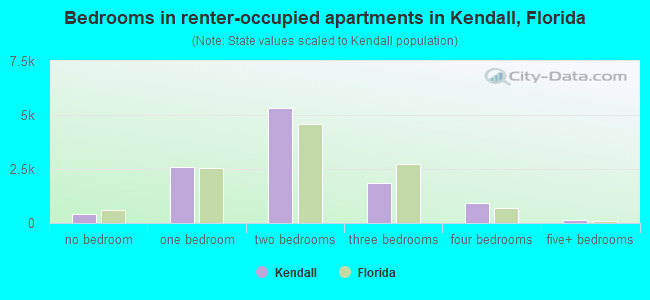
- Bedrooms in renter-occupied apartments in Kendall, Florida
- 415no bedroom
- 2,5901 bedroom
- 5,3342 bedrooms
- 1,8333 bedrooms
- 9454 bedrooms
- 1215+ bedrooms
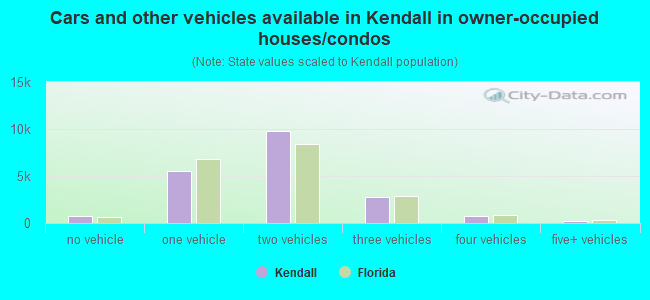
- Cars and other vehicles available in Kendall in owner-occupied houses/condos
- 762no vehicle
- 5,5721 vehicle
- 9,7942 vehicles
- 2,7913 vehicles
- 7654 vehicles
- 2375+ vehicles
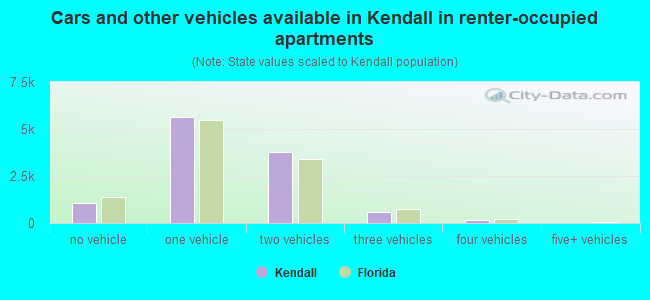
- Cars and other vehicles available in Kendall in renter-occupied apartments
- 1,087no vehicle
- 5,6431 vehicle
- 3,7992 vehicles
- 5613 vehicles
- 1484 vehicles
- 05+ vehicles
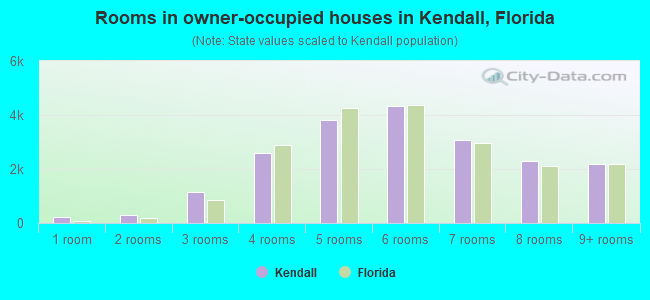
- Rooms in owner-occupied houses in Kendall, Florida
- 2341 room
- 2812 rooms
- 1,1443 rooms
- 2,5954 rooms
- 3,7995 rooms
- 4,3296 rooms
- 3,0597 rooms
- 2,3098 rooms
- 2,1719+ rooms
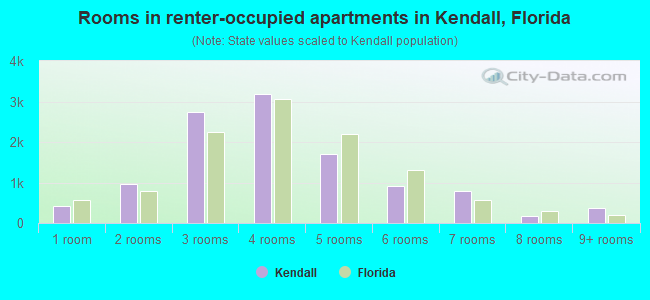
- Rooms in renter-occupied apartments in Kendall, Florida
- 4151 room
- 9512 rooms
- 2,7303 rooms
- 3,1964 rooms
- 1,7035 rooms
- 9106 rooms
- 7857 rooms
- 1858 rooms
- 3639+ rooms
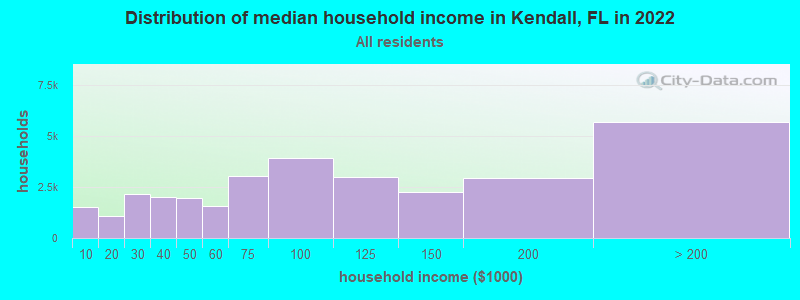
Kendall, FL household income distribution

- 1,531Less than $10,000
- 1,067$10,000 to $19,999
- 2,155$20,000 to $29,999
- 2,032$30,000 to $39,999
- 1,978$40,000 to $49,999
- 1,568$50,000 to $59,999
- 3,029$60,000 to $74,999
- 3,929$75,000 to $99,999
- 2,987$100,000 to $124,999
- 2,248$125,000 to $149,999
- 2,950$150,000 to $199,999
- 5,685$200,000 or more
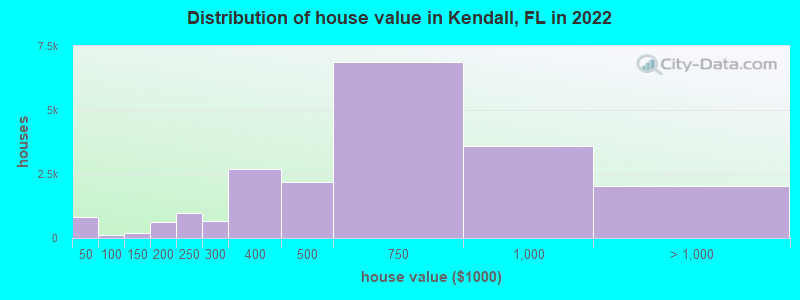
Home value of owner - occupied houses in 2022 in Kendall, FL
-
- 600Less than $10,000
- 20$10,000 to $14,999
- 3$15,000 to $19,999
- 9$20,000 to $24,999
- 132$30,000 to $34,999
- 25$35,000 to $39,999
- 24$40,000 to $49,999
- 19$50,000 to $59,999
- 56$70,000 to $79,999
- 26$80,000 to $89,999
- 80$100,000 to $124,999
- 100$125,000 to $149,999
- 255$150,000 to $174,999
- 350$175,000 to $199,999
- 981$200,000 to $249,999
- 671$250,000 to $299,999
- 2,713$300,000 to $399,999
- 2,191$400,000 to $499,999
- 6,867$500,000 to $749,999
- 3,585$750,000 to $999,999
- 1,329$1,000,000 to $1,499,999
- 502$1,500,000 to $1,999,999
- 183$2,000,000 or more
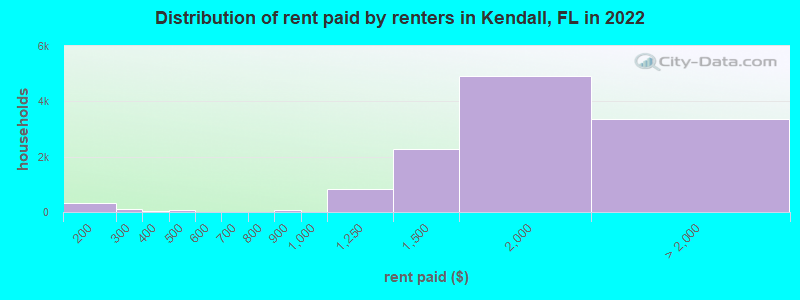
Rent paid by renters in 2022 in Kendall, FL
-
- 332$150 to $199
- 92$200 to $249
- 14$250 to $299
- 22$300 to $349
- 8$400 to $449
- 68$450 to $499
- 9$550 to $599
- 10$700 to $749
- 75$800 to $899
- 828$1,000 to $1,249
- 2,283$1,250 to $1,499
- 4,920$1,500 to $1,999
- 1,969$2,000 to $2,499
- 519$2,500 to $2,999
- 206$3,000 to $3,499
- 246$3,500 or more
- 415No cash rent
Percentage of workers working in this county: 96.7%
Number of people working at home: 7,006 (17.2% of all workers)
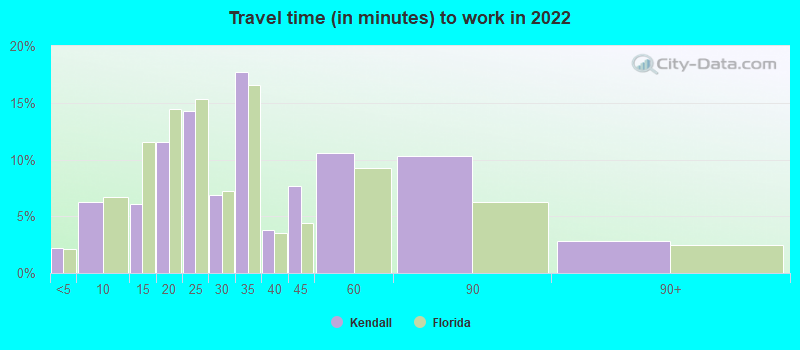
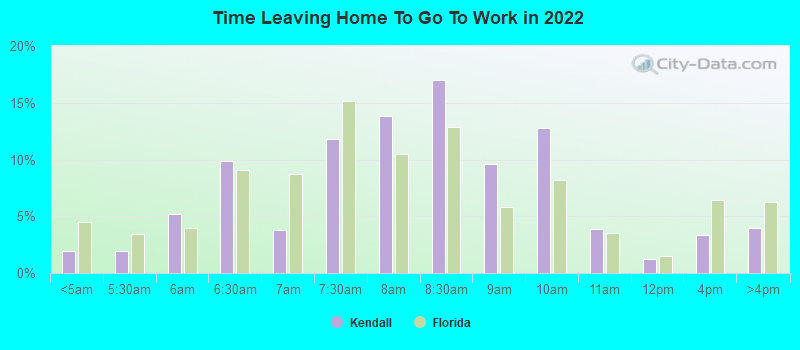
Travel time to work (commute)
- Less than 5 minutes: 1,084
- 5 to 9 minutes: 2,689
- 10 to 14 minutes: 2,880
- 15 to 19 minutes: 3,072
- 20 to 24 minutes: 5,397
- 25 to 29 minutes: 2,243
- 30 to 34 minutes: 5,844
- 35 to 39 minutes: 1,164
- 40 to 44 minutes: 1,795
- 45 to 59 minutes: 4,932
- 60 to 89 minutes: 1,741
- 90 or more minutes: 940
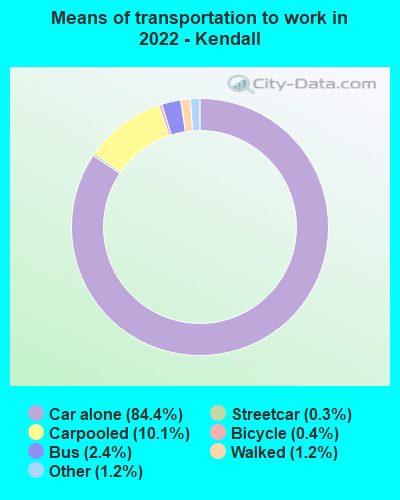
Means of transportation to work:
- Drove a car alone: 31,174 (69.7%)
- Carpooled: 4,212 (9.4%)
- Bus: 834 (1.9%)
- Subway or elevated rail: 151 (0.3%)
- Long-distance train or commuter rail: 19 (0.0%)
- Taxi: 577 (1.3%)
- Bicycle: 205 (0.5%)
- Walked: 492 (1.1%)
- Worked at home: 7,049 (15.7%)
- Unemployment by race in 2022
- Unemployment rate for White non-Hispanic residents
- 1.5%Males
- Unemployment rate for Black residents
- 0.1%Males
- 12.0%Females
- Unemployment rate for Asian residents
- 4.9%Females
- Unemployment rate for other race residents
- 2.8%Males
- Unemployment rate for two or more race residents
- 3.9%Males
- 1.5%Females
- Unemployment rate for Hispanic or Latino residents
- 3.0%Males
- 1.1%Females
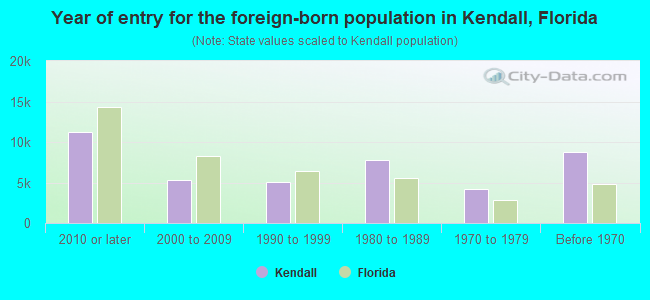
- Year of entry for the foreign-born population in Kendall, Florida
- 11,2072010 or later
- 5,3652000 to 2009
- 5,0051990 to 1999
- 7,8221980 to 1989
- 4,2431970 to 1979
- 8,734Before 1970
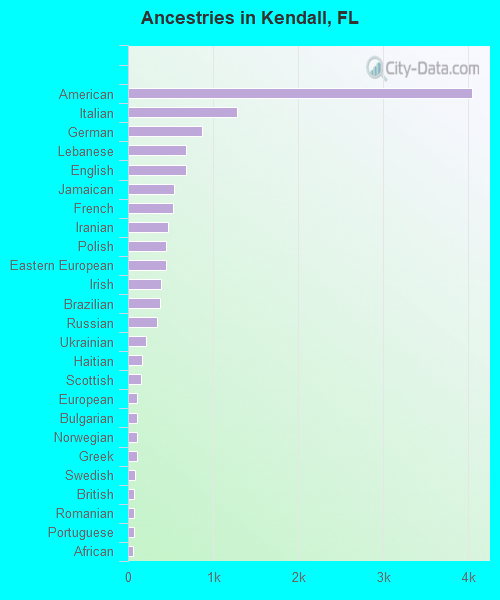
First ancestries reported:
- American: 4,043 (8.3%)
- Italian: 1,282 (2.6%)
- German: 865 (1.8%)
- Lebanese: 678 (1.4%)
- English: 677 (1.4%)
- Jamaican: 540 (1.1%)
- French: 524 (1.1%)
- Iranian: 474 (1.0%)
- Polish: 452 (0.9%)
- Eastern European: 444 (0.9%)
- Irish: 385 (0.8%)
- Brazilian: 372 (0.8%)
- Russian: 345 (0.7%)
- Ukrainian: 212 (0.4%)
- Haitian: 163 (0.3%)
- Scottish: 147 (0.3%)
- European: 106 (0.2%)
- Bulgarian: 104 (0.2%)
- Norwegian: 103 (0.2%)
- Greek: 101 (0.2%)
- Swedish: 88 (0.2%)
- British: 74 (0.2%)
- Romanian: 72 (0.1%)
- Portuguese: 66 (0.1%)
- African: 64 (0.1%)
- Arab: 56 (0.1%)
- Trinidadian and Tobagonian: 45 (0.09%)
- Austrian: 40 (0.08%)
- Danish: 40 (0.08%)
- Hungarian: 38 (0.08%)
- Bermudan: 33 (0.07%)
- Basque: 33 (0.07%)
- Kenyan: 33 (0.07%)
- Dutch: 25 (0.05%)
- Latvian: 21 (0.04%)
- Canadian: 18 (0.04%)
- Lithuanian: 17 (0.03%)
- Welsh: 16 (0.03%)
- Swiss: 15 (0.03%)
- Albanian: 15 (0.03%)
- Slovak: 14 (0.03%)
- Belgian: 13 (0.03%)
- Armenian: 12 (0.02%)
- Scotch-Irish: 11 (0.02%)
- Turkish: 11 (0.02%)
- Bahamian: 11 (0.02%)
- British West Indian: 11 (0.02%)
- Slavic: 10 (0.02%)
- Barbadian: 10 (0.02%)
- Northern European: 9 (0.02%)
- South African: 9 (0.02%)
- Syrian: 8 (0.02%)
- Czech: 7 (0.01%)
- Moroccan: 7 (0.01%)
- Croatian: 6 (0.01%)
- French Canadian: 6 (0.01%)
- Finnish: 5 (0.01%)
- Palestinian: 4 (0.01%)
Most common places of birth for foreign-born residents (%):
| Kendall: | 42.3% (14,953) |
| Florida: | 22.0% (1,006,576) |
| Kendall: | 9.0% (3,179) |
| Florida: | 6.5% (298,669) |
| Kendall: | 5.8% (2,046) |
| Florida: | 2.3% (105,066) |
| Kendall: | 5.1% (1,798) |
| Florida: | 2.1% (96,693) |
| Kendall: | 5.0% (1,771) |
| Florida: | 5.7% (262,042) |
| Kendall: | 2.7% (945) |
| Florida: | 0.5% (21,571) |
| Kendall: | 2.5% (887) |
| Florida: | 5.6% (257,152) |
| Kendall: | 2.4% (851) |
| Florida: | 5.0% (227,319) |
| Kendall: | 2.1% (746) |
| Florida: | 3.0% (137,727) |
| Kendall: | 1.9% (660) |
| Florida: | 1.2% (54,585) |
| Kendall: | 1.8% (637) |
| Florida: | 1.3% (57,263) |
| Kendall: | 1.6% (564) |
| Florida: | 2.3% (107,160) |
Place of birth for U.S.-born residents:
- This state: 30,415
- Other state: 12,064
- Northeast: 5,942
- Midwest: 1,798
- South: 2,619
- West: 1,705
91.7% of Kendall residents lived in the same house 1 years ago.
Out of people who lived in different houses, 42.9% lived in this county.
Out of people who lived in different counties, 38.7% lived in Florida.
| Kendall: | 91.7% |
| State average: | 86.3% |
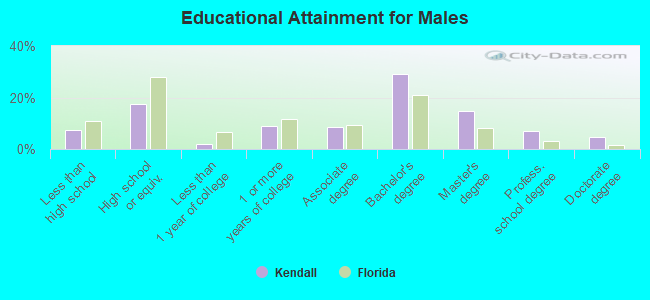
Education attainment for males 25 years and older:
- No schooling: 540
- Nursery to 4th grade: 0
- 5th and 6th grade: 0
- 7th and 8th grade: 54
- 9th grade: 4
- 10th grade: 380
- 11th grade: 363
- 12th grade, no diploma: 639
- High school graduate (or equivalency): 4,816
- Less than 1 year of college: 536
- Some college more than 1 year, no degree: 2,468
- Associate degree: 2,374
- Bachelor's degree: 8,001
- Master's degree: 4,059
- Professional school degree: 1,859
- Doctorate degree: 1,265
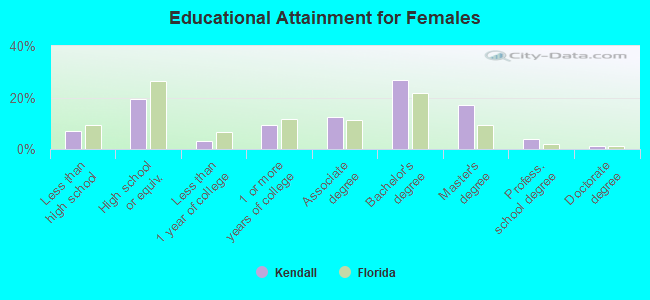
Education attainment for females 25 years and older:
- No schooling: 382
- Nursery to 4th grade: 0
- 5th and 6th grade: 184
- 7th and 8th grade: 65
- 9th grade: 87
- 10th grade: 184
- 11th grade: 698
- 12th grade, no diploma: 754
- High school graduate (or equivalency): 6,482
- Less than 1 year of college: 1,045
- Some college more than 1 year, no degree: 3,103
- Associate degree: 4,070
- Bachelor's degree: 8,823
- Master's degree: 5,609
- Professional school degree: 1,306
- Doctorate degree: 352
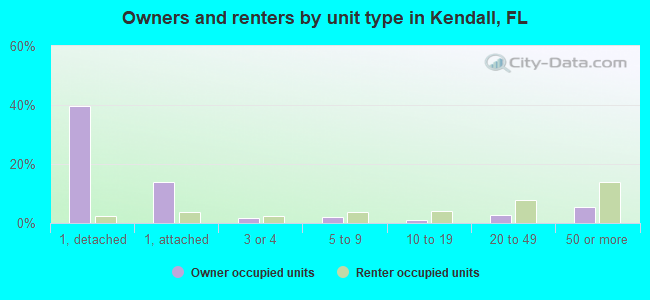
Housing units in structures:
- One, detached: 14,843
- One, attached: 5,023
- Two: 367
- 3 or 4: 844
- 5 to 9: 2,421
- 10 to 19: 1,282
- 20 to 49: 2,969
- 50 or more: 4,999
- Mobile homes: 192
Housing units lacking complete kitchen facilities in 2022: 1.6%
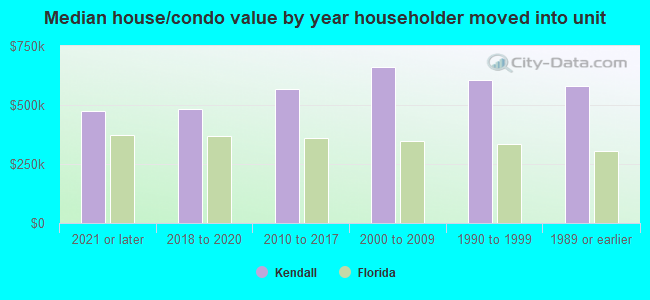
House/condo owner moved in on average 12 years ago
Renter moved in on average 3 years ago
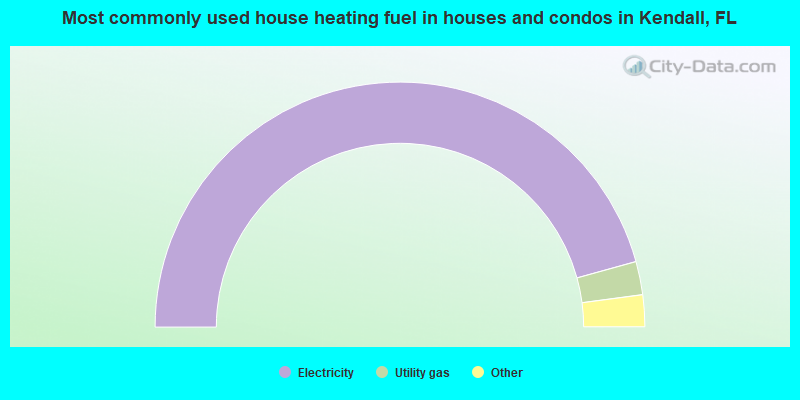
- 91.4%Electricity
- 4.4%Utility gas
- 3.1%No fuel used
- 0.7%Bottled, tank, or LP gas
- 0.2%Fuel oil, kerosene, etc.
- 0.2%Solar energy
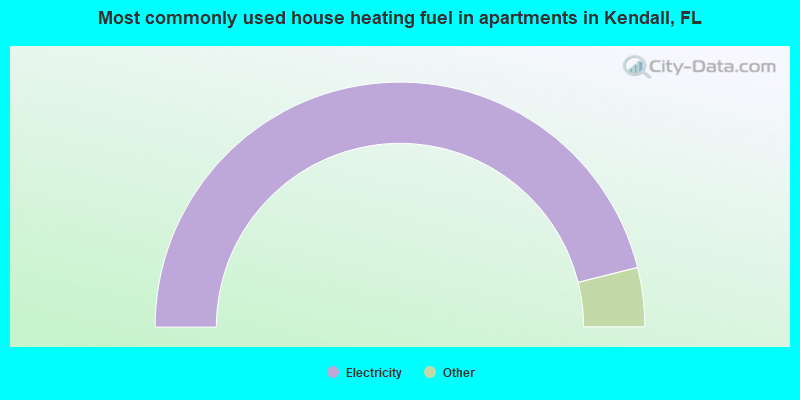
- 92.2%Electricity
- 4.0%No fuel used
- 3.1%Utility gas
- 0.3%Bottled, tank, or LP gas
- 0.3%Fuel oil, kerosene, etc.
- 0.1%Wood
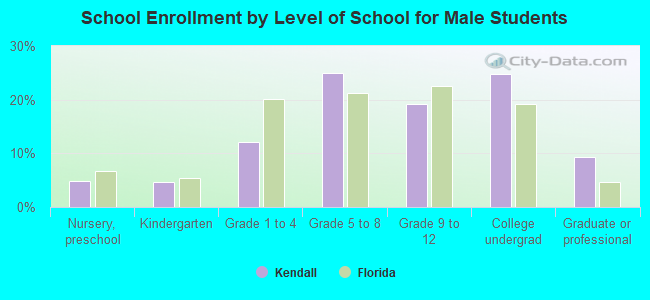
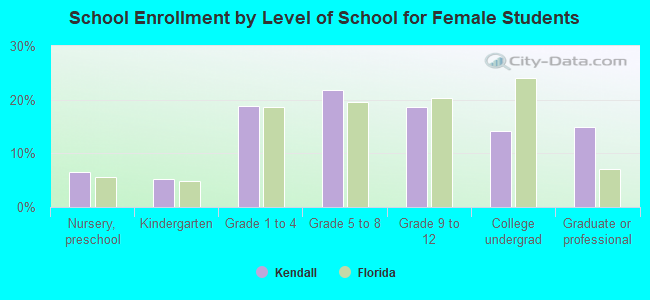
Private vs. public school enrollment:
| Here: | 17.5% |
| Florida: | 15.8% |
| Here: | 12.0% |
| Florida: | 12.9% |
| Here: | 15.6% |
| Florida: | 23.6% |