Kenhorst, PA (Pennsylvania) Houses and Residents
| Kenhorst: | $181,669 |
| Pennsylvania: | $245,500 |
Mean price in 2022:
Detached houses: $194,930
Here: $194,930 State: $317,202 Townhouses or other attached units: $134,391
Here: $134,391 State: $254,369
Total population: 2,864 (Urban population: 2,662, Rural population: 0)
Houses: 1,228 (1,211 occupied: 957 owner occupied, 253 renter occupied)
| % of renters here: | 21% |
| State: | 31% |
Housing density: 2,086 houses/condos per square mile
Median price asked for vacant for-sale houses and condos in 2022 in this county: $196,460.
Median contract rent in 2022: $1,160 (lower quartile is $1,018, upper quartile is $1,264)
Median rent asked for vacant for-rent units in 2022: $809
Median gross rent in Kenhorst, PA in 2022: $1,223
Housing units in Kenhorst with a mortgage: 748 (66 second mortgage, 0 home equity loan, 62 both second mortgage and home equity loan)
Houses without a mortgage: 82
Median household income for houses/condos with a mortgage: $81,682
Median household income for apartments without a mortgage: $67,739
Median monthly housing costs: $1,207
Compare current foreclosures near Kenhorst, PA:
| Photo | Address | Area | Beds / Baths | Price | Details |
|---|---|---|---|---|---|

|
#1
Black Matt Rd
Douglassville, PA 19518
|
2,268 sq. feet
|
1 baths 4 beds |
$135,200
|
show details |

|
#2
Pine St
Honey Brook, PA 19344
|
1,232 sq. feet
|
1 baths 3 beds |
$88,729
|
show details |

|
#3
E Glen Tilt Ave
Wernersville, PA 19565
|
1,656 sq. feet
|
1 baths 3 beds |
$144,755
|
show details |

|
#4
Cupola Rd
Honey Brook, PA 19344
|
2,112 sq. feet
|
1 baths 4 beds |
$165,679
|
show details |

|
#5
Linden St
Reading, PA 19604
|
1,236 sq. feet
|
1 baths 3 beds |
$40,706
|
show details |

|
#6
Callery Dr
Blandon, PA 19510
|
1,616 sq. feet
|
2 baths 3 beds |
$188,265
|
show details |

|
#7
W Broad St
Reading, PA 19607
|
1,620 sq. feet
|
1 baths 4 beds |
show details | |

|
#8
S Hanover St
Pottstown, PA 19465
|
1,294 sq. feet
|
1 baths 3 beds |
show details | |

|
#9
Fairview Ave
Reading, PA 19606
|
1,316 sq. feet
|
2 baths 3 beds |
show details | |

|
#10
Overlook Pointe
Douglassville, PA 19518
|
2,424 sq. feet
|
2 baths 4 beds |
show details |
| Photo | Address | Area | Beds / Baths | Price | Details |
|---|---|---|---|---|---|

|
#11
N King St
Denver, PA 17517
|
1,188 sq. feet
|
1 baths 3 beds |
show details | |

|
#12
E Jackson St
New Holland, PA 17557
|
1,464 sq. feet
|
1 baths 4 beds |
show details | |

|
#13
Main St
Shoemakersville, PA 19555
|
1,936 sq. feet
|
1 baths 4 beds |
show details | |

|
#14
N York St
Pottstown, PA 19464
|
2,352 sq. feet
|
1 baths 5 beds |
show details | |

|
#15
W 2nd St
Birdsboro, PA 19508
|
1,176 sq. feet
|
1 baths 3 beds |
show details | |

|
#16
Moselem Spring Rd
Hamburg, PA 19526
|
1,056 sq. feet
|
2 baths 3 beds |
show details | |

|
#17
N Front St
Reading, PA 19601
|
1,897 sq. feet
|
2 baths 4 beds |
show details | |

|
#18
Pear St
Reading, PA 19601
|
1,573 sq. feet
|
1 baths 3 beds |
show details | |

|
#19
Muhlenberg St
Reading, PA 19602
|
1,516 sq. feet
|
1 baths 4 beds |
show details | |

|
#20
Friedensburg Rd
Reading, PA 19606
|
1,084 sq. feet
|
1 baths 3 beds |
show details |
| Photo | Address | Area | Beds / Baths | Price | Details |
|---|---|---|---|---|---|

|
#21
N Canal St
Leesport, PA 19533
|
1,140 sq. feet
|
1 baths 3 beds |
show details | |

|
#22
Lincoln St
Reading, PA 19601
|
1,372 sq. feet
|
1 baths 2 beds |
show details | |

|
#23
S 15th St
Reading, PA 19602
|
2,086 sq. feet
|
1 baths 4 beds |
show details | |

|
#24
E Howard St
Pottstown, PA 19464
|
688 sq. feet
|
1 baths 3 beds |
show details | |

|
#25
Mechanic St
Reinholds, PA 17569
|
1,636 sq. feet
|
1 baths 3 beds |
show details | |

|
#26
Ardmore Ave
Reading, PA 19607
|
2,145 sq. feet
|
3 baths 4 beds |
show details | |

|
#27
Dry Tavern Rd
Denver, PA 17517
|
1,616 sq. feet
|
2 baths 4 beds |
show details | |

|
#28
Rivervale Rd
Reading, PA 19605
|
3,036 sq. feet
|
3 baths 4 beds |
show details | |

|
#29
Wilshire Rd
Temple, PA 19560
|
1,272 sq. feet
|
1 baths 4 beds |
show details | |

|
#30
Girard Ave
Reading, PA 19605
|
1,309 sq. feet
|
1 baths 3 beds |
show details |
| Photo | Address | Area | Beds / Baths | Price | Details |
|---|---|---|---|---|---|

|
#31
West St
Pottstown, PA 19464
|
1,044 sq. feet
|
1 baths 2 beds |
show details | |

|
#32
Fairview Ave
Reading, PA 19606
|
2,042 sq. feet
|
2 baths 4 beds |
show details | |

|
#33
Frush Valley Rd
Reading, PA 19605
|
1,040 sq. feet
|
1 baths 3 beds |
show details | |

|
#34
S Park St
Richland, PA 17087
|
1,380 sq. feet
|
1 baths 3 beds |
show details | |

|
#35
Montgomery Ave
New Berlinville, PA 19545
|
1,768 sq. feet
|
2 baths 3 beds |
show details | |

|
#36
Park Rd
Boyertown, PA 19512
|
1,404 sq. feet
|
2 baths 3 beds |
show details | |

|
#37
Hazel St
Reading, PA 19611
|
1,076 sq. feet
|
1 baths 3 beds |
show details | |

|
#38
Chestnut St
Reading, PA 19605
|
964 sq. feet
|
1 baths 2 beds |
show details | |

|
#39
Beech St
Denver, PA 17517
|
1,482 sq. feet
|
3 baths 3 beds |
show details | |

|
#40
Willow Rd
Fleetwood, PA 19522
|
1,604 sq. feet
|
2 baths 4 beds |
show details |
| Photo | Address | Area | Beds / Baths | Price | Details |
|---|---|---|---|---|---|

|
#41
Grandview Cir
Honey Brook, PA 19344
|
1,142 sq. feet
|
2 baths 3 beds |
show details | |

|
#42
N Reading Ave
Boyertown, PA 19512
|
1,312 sq. feet
|
1 baths 3 beds |
show details | |

|
#43
Baltzer Ave
Bernville, PA 19506
|
- sq. feet
|
2 baths 4 beds |
show details | |

|
#44
Boyertown Pike
Douglassville, PA 19518
|
1,915 sq. feet
|
1 baths 4 beds |
show details | |

|
#45
Marden Dr
Blandon, PA 19510
|
1,380 sq. feet
|
2 baths 3 beds |
show details | |

|
#46
Park Rd
Fleetwood, PA 19522
|
1,040 sq. feet
|
1 baths 3 beds |
show details | |

|
#47
Ridgeview Dr
Morgantown, PA 19543
|
2,384 sq. feet
|
2 baths 3 beds |
show details | |

|
#48
Bellemans Church Rd
Mohrsville, PA 19541
|
1,767 sq. feet
|
1 baths 3 beds |
show details | |

|
#49
N 4th St
Denver, PA 17517
|
1,008 sq. feet
|
1 baths 3 beds |
show details | |

|
Check over 1 million property listings on Foreclosure.com!
|
browse all offers | |||

Latest news about housing in Kenhorst, PA collected exclusively by city-data.com from local newspapers, TV, and radio stations

 | What's with Mohnton? (3 replies) |
| Seeking Housing in Reading and have pets (1 reply) |
| Is Pittsburgh America's Most Livable City? - Parts 1 & 2 (171 replies) |
| Reading PA neighborhoods (26 replies) |
| Where to move around Reading, Pa? (18 replies) |
| Good places in Reading, PA (5 replies) |

Median year apartment built: 1959
Household type by relationship:
Households: 2,997- Male householders: 643 (183 living alone), Female householders: 565 (155 living alone)
460 spouses (453 opposite-sex spouses), 256 unmarried partners, (256 opposite-sex unmarried partners), 822 children (804 natural, 13 adopted, 5 stepchildren), 36 grandchildren, 66 brothers or sisters, 12 parents, 0 foster children, 54 other relatives, 70 non-relatives
- In group quarters: 10
Size of family households: 266 2-persons, 242 3-persons, 106 4-persons, 41 5-persons, 72 6-persons.
Size of nonfamily households: 338 1-person, 134 2-persons.
276 married couples with children.
415 single-parent households (349 men, 66 women).
78.0% of residents of Kenhorst speak English at home.
18.4% of residents speak Spanish at home (76% speak English very well, 14% speak English well, 10% speak English not well).
1.0% of residents speak other Indo-European language at home (100% speak English very well).
0.1% of residents speak Asian or Pacific Island language at home (100% speak English very well).
Foreign born population: 150 (5.0%)
(41.3% of them are naturalized citizens)
| Here: | 6.2 |
| State: | 6.8 |
| Here: | 5.2 |
| State: | 4.3 |

- Bedrooms in owner-occupied houses and condos in Kenhorst, Pennsylvania
- 0no bedroom
- 191 bedroom
- 1472 bedrooms
- 6853 bedrooms
- 814 bedrooms
- 265+ bedrooms

- Bedrooms in renter-occupied apartments in Kenhorst, Pennsylvania
- 0no bedroom
- 121 bedroom
- 1312 bedrooms
- 1113 bedrooms
- 04 bedrooms
- 05+ bedrooms

- Cars and other vehicles available in Kenhorst in owner-occupied houses/condos
- 38no vehicle
- 3461 vehicle
- 3952 vehicles
- 1113 vehicles
- 414 vehicles
- 265+ vehicles

- Cars and other vehicles available in Kenhorst in renter-occupied apartments
- 7no vehicle
- 401 vehicle
- 1862 vehicles
- 203 vehicles
- 04 vehicles
- 05+ vehicles

- Rooms in owner-occupied houses in Kenhorst, Pennsylvania
- 01 room
- 02 rooms
- 113 rooms
- 584 rooms
- 2005 rooms
- 3246 rooms
- 1737 rooms
- 1048 rooms
- 889+ rooms

- Rooms in renter-occupied apartments in Kenhorst, Pennsylvania
- 01 room
- 02 rooms
- 53 rooms
- 284 rooms
- 1265 rooms
- 666 rooms
- 87 rooms
- 08 rooms
- 209+ rooms


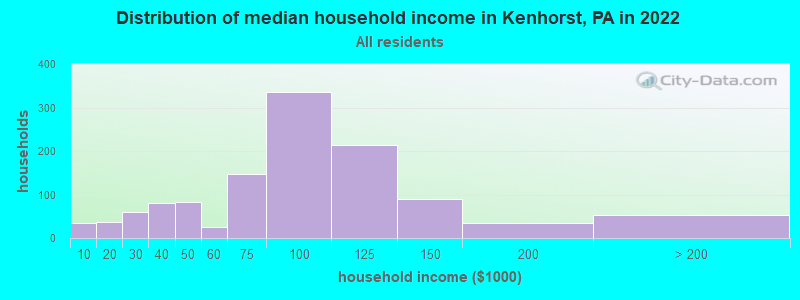
Kenhorst, PA household income distribution

- 35Less than $10,000
- 36$10,000 to $19,999
- 59$20,000 to $29,999
- 81$30,000 to $39,999
- 83$40,000 to $49,999
- 26$50,000 to $59,999
- 147$60,000 to $74,999
- 335$75,000 to $99,999
- 213$100,000 to $124,999
- 89$125,000 to $149,999
- 35$150,000 to $199,999
- 53$200,000 or more
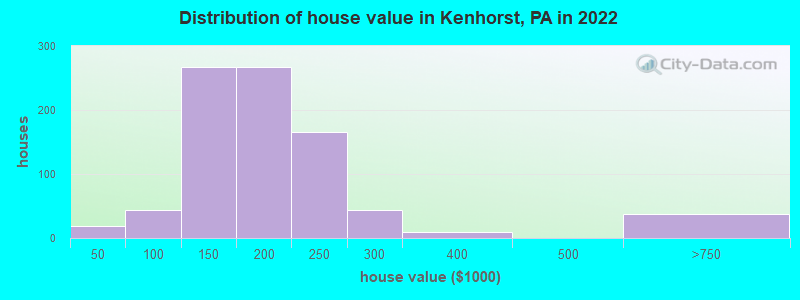
Home value of owner - occupied houses in 2022 in Kenhorst, PA
-
- 7Less than $10,000
- 10$10,000 to $14,999
- 14$70,000 to $79,999
- 20$80,000 to $89,999
- 8$90,000 to $99,999
- 107$100,000 to $124,999
- 159$125,000 to $149,999
- 130$150,000 to $174,999
- 137$175,000 to $199,999
- 164$200,000 to $249,999
- 42$250,000 to $299,999
- 8$300,000 to $399,999
- 36$500,000 to $749,999
Rent paid by renters in 2022 in Kenhorst, PA
-
- 5$600 to $649
- 5$700 to $749
- 30$800 to $899
- 18$900 to $999
- 143$1,000 to $1,249
- 46$1,250 to $1,499
- 6$1,500 to $1,999


Percentage of workers working in this county: 86.3%
Number of people working at home: 321 (18.9% of all workers)
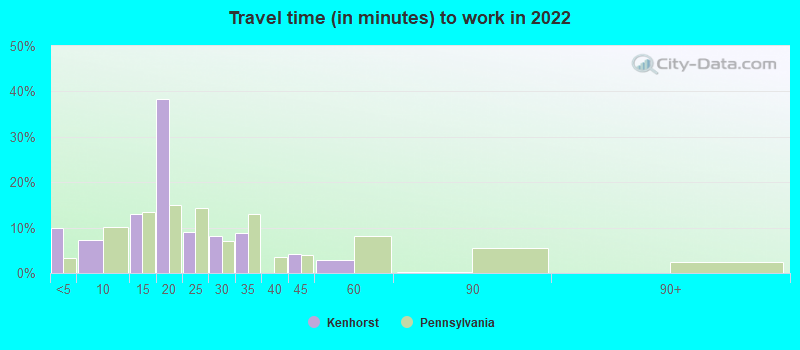
Travel time to work (commute)
- Less than 5 minutes: 29
- 5 to 9 minutes: 161
- 10 to 14 minutes: 356
- 15 to 19 minutes: 259
- 20 to 24 minutes: 124
- 25 to 29 minutes: 32
- 30 to 34 minutes: 126
- 35 to 39 minutes: 44
- 40 to 44 minutes: 13
- 45 to 59 minutes: 105
- 60 to 89 minutes: 47
- 90 or more minutes: 97
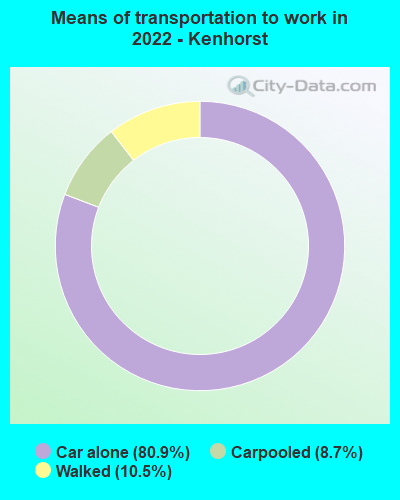
Means of transportation to work:
- Drove a car alone: 408 (52.9%)
- Carpooled: 53 (6.9%)
- Walked: 33 (4.3%)
- Worked at home: 321 (41.6%)

- Unemployment by race in 2022
- Unemployment rate for White non-Hispanic residents
- 2.4%Males
- 2.8%Females
- Unemployment rate for other race residents
- 23.2%Males
- 14.9%Females
- Unemployment rate for Hispanic or Latino residents
- 8.0%Males
- 14.2%Females

- Year of entry for the foreign-born population in Kenhorst, Pennsylvania
- 1192010 or later
- 302000 to 2009
- 71990 to 1999
- 01980 to 1989
- 171970 to 1979
- 37Before 1970
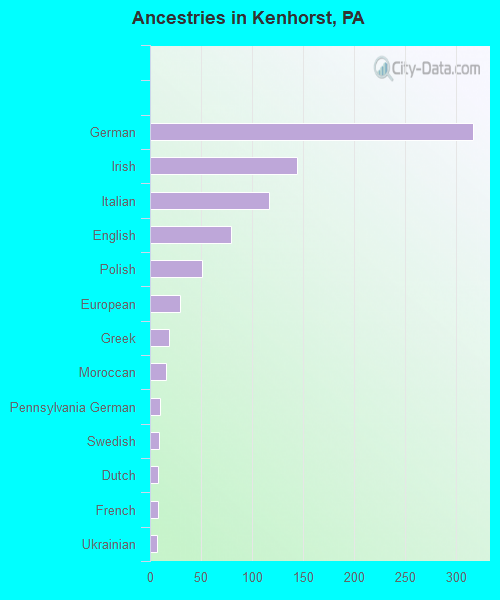
First ancestries reported:
- German: 317 (24.2%)
- Irish: 144 (11.0%)
- Italian: 117 (8.9%)
- English: 80 (6.1%)
- Polish: 51 (3.9%)
- European: 29 (2.2%)
- Greek: 19 (1.5%)
- Moroccan: 16 (1.2%)
- Pennsylvania German: 10 (0.8%)
- Swedish: 9 (0.7%)
- Dutch: 8 (0.6%)
- French: 8 (0.6%)
- Ukrainian: 7 (0.5%)
Most common places of birth for foreign-born residents (%):
| Kenhorst: | 53.6% (75) |
| Pennsylvania: | 9.2% (86,544) |
| Kenhorst: | 40.7% (57) |
| Pennsylvania: | 0.4% (4,198) |
| Kenhorst: | 8.6% (12) |
| Pennsylvania: | 0.5% (4,483) |
| Kenhorst: | 5.7% (8) |
| Pennsylvania: | 1.4% (13,077) |
Place of birth for U.S.-born residents:
- This state: 2,300
- Other state: 366
- Northeast: 216
- Midwest: 79
- South: 53
- West: 19
78.3% of Kenhorst residents lived in the same house 1 years ago.
Out of people who lived in different houses, 41.3% lived in this county.
Out of people who lived in different counties, 71.3% lived in Pennsylvania.
| Kenhorst: | 78.3% |
| State average: | 89.3% |
Education attainment for males 25 years and older:
- No schooling: 0
- Nursery to 4th grade: 0
- 5th and 6th grade: 0
- 7th and 8th grade: 0
- 9th grade: 6
- 10th grade: 10
- 11th grade: 12
- 12th grade, no diploma: 7
- High school graduate (or equivalency): 427
- Less than 1 year of college: 111
- Some college more than 1 year, no degree: 108
- Associate degree: 143
- Bachelor's degree: 120
- Master's degree: 73
- Professional school degree: 10
- Doctorate degree: 0

Education attainment for females 25 years and older:
- No schooling: 10
- Nursery to 4th grade: 6
- 5th and 6th grade: 0
- 7th and 8th grade: 0
- 9th grade: 10
- 10th grade: 9
- 11th grade: 0
- 12th grade, no diploma: 0
- High school graduate (or equivalency): 419
- Less than 1 year of college: 59
- Some college more than 1 year, no degree: 128
- Associate degree: 143
- Bachelor's degree: 180
- Master's degree: 86
- Professional school degree: 4
- Doctorate degree: 0


Housing units in structures:
- One, detached: 853
- One, attached: 305
- Two: 21
- 3 or 4: 16
- 5 to 9: 12
- 20 to 49: 20
House/condo owner moved in on average 12 years ago
Renter moved in on average 0 years ago

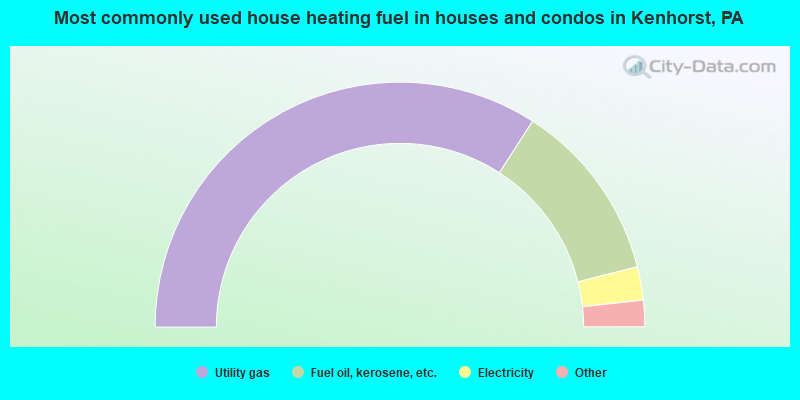
- 68.3%Utility gas
- 23.9%Fuel oil, kerosene, etc.
- 4.4%Electricity
- 1.9%Coal or coke
- 1.5%Bottled, tank, or LP gas
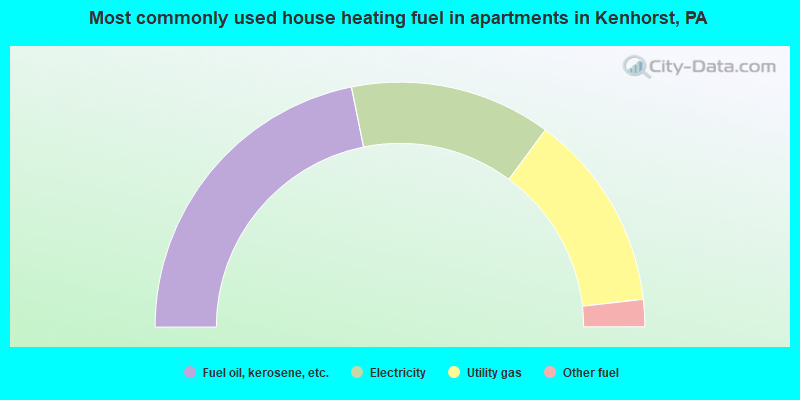
- 43.7%Fuel oil, kerosene, etc.
- 26.6%Electricity
- 26.2%Utility gas
- 3.6%Other fuel
Private vs. public school enrollment:
| Here: | 2.8% |
| Pennsylvania: | 15.7% |
| Here: | 0.0% |
| Pennsylvania: | 13.4% |
| Here: | 28.0% |
| Pennsylvania: | 39.8% |


