Kenilworth, PA (Pennsylvania) Houses and Residents
| Kenilworth: | $353,256 |
| Pennsylvania: | $245,500 |
Mean price in 2022:
Detached houses: $337,419
Here: $337,419 State: $317,202
Total population: 1,907 (Urban population: 1,434, Rural population: 60 (all nonfarm))
Houses: 887 (851 occupied: 613 owner occupied, 237 renter occupied)
| % of renters here: | 28% |
| State: | 31% |
Housing density: 520 houses/condos per square mile
Median price asked for vacant for-sale houses and condos in 2022 in this county: $402,427.
Median contract rent in 2022: $1,104 (lower quartile is $924, upper quartile is $1,194)
Median rent asked for vacant for-rent units in 2022: $1,015
Median gross rent in Kenilworth, PA in 2022: $1,119
Housing units in Kenilworth with a mortgage: 445 (99 second mortgage, 11 home equity loan, 58 both second mortgage and home equity loan)
Houses without a mortgage: 0
Median household income for houses/condos with a mortgage: $140,986
Median household income for apartments without a mortgage: $96,046
Median monthly housing costs: $1,463
Compare current foreclosures near Kenilworth, PA:
| Photo | Address | Area | Beds / Baths | Price | Details |
|---|---|---|---|---|---|

|
#1
N Parkview Dr
Norristown, PA 19403
|
2,602 sq. feet
|
2 baths 4 beds |
$240,000
|
show details |

|
#2
Black Matt Rd
Douglassville, PA 19518
|
2,268 sq. feet
|
1 baths 4 beds |
$135,200
|
show details |

|
#3
Richmond Rd
Paoli, PA 19301
|
1,706 sq. feet
|
2 baths 2 beds |
$179,198
|
show details |

|
#4
Grove Rd
West Chester, PA 19380
|
875 sq. feet
|
1 baths 3 beds |
$19,782
|
show details |

|
#5
2nd Ave
Phoenixville, PA 19460
|
1,120 sq. feet
|
1 baths 3 beds |
$39,472
|
show details |

|
#6
Humpton Rd
Downingtown, PA 19335
|
1,896 sq. feet
|
1 baths 4 beds |
$6,080
|
show details |

|
#7
L Fleur
Devon, PA 19333
|
1,412 sq. feet
|
1 baths 2 beds |
$50,690
|
show details |

|
#8
Astor Ct
Downingtown, PA 19335
|
1,439 sq. feet
|
2 baths 3 beds |
$3,245
|
show details |

|
#9
Woodside Ave
Berwyn, PA 19312
|
2,080 sq. feet
|
2 baths 5 beds |
$525,082
|
show details |

|
#10
Larson Dr
Downingtown, PA 19335
|
1,594 sq. feet
|
2 baths 2 beds |
$5,454
|
show details |
| Photo | Address | Area | Beds / Baths | Price | Details |
|---|---|---|---|---|---|

|
#11
Linden St
Reading, PA 19604
|
1,236 sq. feet
|
1 baths 3 beds |
$40,706
|
show details |

|
#12
Josephs Way
Malvern, PA 19355
|
1,853 sq. feet
|
2 baths 3 beds |
$128,821
|
show details |

|
#13
Carlyn Ct
Downingtown, PA 19335
|
1,599 sq. feet
|
2 baths 3 beds |
$139,895
|
show details |

|
#14
South St
Phoenixville, PA 19460
|
1,568 sq. feet
|
1 baths 3 beds |
$178,971
|
show details |

|
#15
Harvey Ln
Malvern, PA 19355
|
2,163 sq. feet
|
2 baths 4 beds |
$61,867
|
show details |

|
#16
Ridge Rd
Spring City, PA 19475
|
1,456 sq. feet
|
2 baths 3 beds |
$235,715
|
show details |

|
#17
Lewisville Ct
Phoenixville, PA 19460
|
1,605 sq. feet
|
2 baths 2 beds |
$51,546
|
show details |

|
#18
Cupola Rd
Honey Brook, PA 19344
|
2,112 sq. feet
|
1 baths 4 beds |
$165,679
|
show details |

|
#19
Hoffecker Rd
Phoenixville, PA 19460
|
1,260 sq. feet
|
2 baths 3 beds |
$217,558
|
show details |

|
#20
Shady Brook Ln
Malvern, PA 19355
|
3,974 sq. feet
|
3 baths 4 beds |
$185,445
|
show details |
| Photo | Address | Area | Beds / Baths | Price | Details |
|---|---|---|---|---|---|

|
#21
Bridge St
Spring City, PA 19475
|
1,686 sq. feet
|
3 baths 3 beds |
$252,371
|
show details |

|
#22
Richmond Rd
Paoli, PA 19301
|
1,215 sq. feet
|
1 baths 2 beds |
$263,438
|
show details |

|
#23
Hunter Dr
Glenmoore, PA 19343
|
1,981 sq. feet
|
2 baths 4 beds |
$180,354
|
show details |

|
#24
New Market Ct
Wayne, PA 19087
|
1,080 sq. feet
|
1 baths 2 beds |
$98,656
|
show details |

|
#25
Stirling Ct
West Chester, PA 19380
|
1,050 sq. feet
|
1 baths 2 beds |
$30,983
|
show details |

|
#26
Gulph Rd
Wayne, PA 19087
|
3,262 sq. feet
|
2 baths 4 beds |
$651,481
|
show details |

|
#27
Bala Ter W
West Chester, PA 19380
|
1,632 sq. feet
|
1 baths 3 beds |
$180,258
|
show details |

|
#28
W Central Ave
Paoli, PA 19301
|
1,939 sq. feet
|
2 baths 4 beds |
$438,947
|
show details |

|
#29
Mulberry St
Chester Springs, PA 19425
|
6,298 sq. feet
|
5 baths 5 beds |
$619,328
|
show details |

|
#30
Hopkinson Ct # 160
Wayne, PA 19087
|
1,656 sq. feet
|
2 baths 2 beds |
$214,896
|
show details |
| Photo | Address | Area | Beds / Baths | Price | Details |
|---|---|---|---|---|---|

|
#31
Gwynedd Ct
Exton, PA 19341
|
1,760 sq. feet
|
2 baths 3 beds |
$296,451
|
show details |

|
#32
Seabury Ln
Downingtown, PA 19335
|
2,640 sq. feet
|
2 baths 4 beds |
$451,499
|
show details |

|
#33
Denton Dr
Glenmoore, PA 19343
|
1,590 sq. feet
|
1 baths 3 beds |
$34,159
|
show details |

|
#34
Bowman Ave
West Chester, PA 19380
|
1,031 sq. feet
|
1 baths 3 beds |
show details | |

|
#35
S 15th St
Reading, PA 19602
|
2,086 sq. feet
|
1 baths 4 beds |
show details | |

|
#36
E Fisherville Rd
Downingtown, PA 19335
|
1,720 sq. feet
|
2 baths 2 beds |
show details | |

|
#37
S Hanover St
Pottstown, PA 19465
|
1,294 sq. feet
|
1 baths 3 beds |
show details | |

|
#38
West St
Pottstown, PA 19464
|
1,044 sq. feet
|
1 baths 2 beds |
show details | |

|
#39
Main St
Royersford, PA 19468
|
- sq. feet
|
2 baths 5 beds |
show details | |

|
#40
Muhlenberg St
Reading, PA 19602
|
1,516 sq. feet
|
1 baths 4 beds |
show details |
| Photo | Address | Area | Beds / Baths | Price | Details |
|---|---|---|---|---|---|

|
#41
Woodlawn Ave
Phoenixville, PA 19460
|
1,197 sq. feet
|
1 baths 1 beds |
show details | |

|
#42
S Trooper Rd
Norristown, PA 19403
|
1,061 sq. feet
|
1 baths 4 beds |
show details | |

|
#43
Willow Brook Ln
Pottstown, PA 19464
|
1,566 sq. feet
|
2 baths 3 beds |
show details | |

|
#44
E Howard St
Pottstown, PA 19464
|
688 sq. feet
|
1 baths 3 beds |
show details | |

|
#45
Ridge Rd
Phoenixville, PA 19460
|
1,486 sq. feet
|
2 baths 4 beds |
show details | |

|
#46
Hagey Pl # 2602
Collegeville, PA 19426
|
1,856 sq. feet
|
2 baths 2 beds |
show details | |

|
#47
Hilltop Rd
Pottstown, PA 19464
|
1,155 sq. feet
|
2 baths 2 beds |
show details | |

|
#48
Willow Rd
Fleetwood, PA 19522
|
1,604 sq. feet
|
2 baths 4 beds |
show details | |

|
#49
Benfield Rd
Macungie, PA 18062
|
1,400 sq. feet
|
1 baths 3 beds |
show details | |

|
Check over 1 million property listings on Foreclosure.com!
|
browse all offers | |||

Latest news about housing in Kenilworth, PA collected exclusively by city-data.com from local newspapers, TV, and radio stations

 | Terrain apartments or Maiden Bridge/Canongate apartments?? (5 replies) |
| Philadelphia 2035 (9298 replies) |
| Moving to Bethlehem/Nazareth area- need your help (2 replies) |
| Not sure where in Pennsylvania is for us... (14 replies) |
| Can we afford to relocate to pittsburgh? (199 replies) |
| Living around Pottstown (0 replies) |

Median year apartment built: 1965
Household type by relationship:
Households: 2,080- Male householders: 364 (110 living alone), Female householders: 485 (96 living alone)
452 spouses (452 opposite-sex spouses), 78 unmarried partners, (78 opposite-sex unmarried partners), 591 children (526 natural, 8 adopted, 56 stepchildren), 23 grandchildren, 51 brothers or sisters, 23 parents, 0 foster children, 10 other relatives, 0 non-relatives
Size of family households: 299 2-persons, 161 3-persons, 123 4-persons, 34 5-persons, 6 6-persons, 13 7-or-more-persons.
Size of nonfamily households: 195 1-person, 17 2-persons.
246 married couples with children.
83 single-parent households (13 men, 70 women).
95.3% of residents of Kenilworth speak English at home.
0.4% of residents speak Spanish at home (100% speak English very well).
1.9% of residents speak other Indo-European language at home (100% speak English very well).
2.3% of residents speak Asian or Pacific Island language at home (100% speak English well).
Foreign born population: 52 (2.5%)
(48.1% of them are naturalized citizens)
| Here: | 7.7 |
| State: | 6.8 |
| Here: | 3.4 |
| State: | 4.3 |

- Bedrooms in owner-occupied houses and condos in Kenilworth, Pennsylvania
- 0no bedroom
- 01 bedroom
- 162 bedrooms
- 2443 bedrooms
- 2314 bedrooms
- 1215+ bedrooms

- Bedrooms in renter-occupied apartments in Kenilworth, Pennsylvania
- 0no bedroom
- 1581 bedroom
- 732 bedrooms
- 63 bedrooms
- 04 bedrooms
- 05+ bedrooms

- Cars and other vehicles available in Kenilworth in owner-occupied houses/condos
- 63no vehicle
- 391 vehicle
- 3302 vehicles
- 1273 vehicles
- 394 vehicles
- 155+ vehicles

- Cars and other vehicles available in Kenilworth in renter-occupied apartments
- 0no vehicle
- 2001 vehicle
- 62 vehicles
- 323 vehicles
- 04 vehicles
- 05+ vehicles

- Rooms in owner-occupied houses in Kenilworth, Pennsylvania
- 01 room
- 02 rooms
- 03 rooms
- 114 rooms
- 495 rooms
- 386 rooms
- 2007 rooms
- 318 rooms
- 2859+ rooms

- Rooms in renter-occupied apartments in Kenilworth, Pennsylvania
- 01 room
- 02 rooms
- 1193 rooms
- 1024 rooms
- 105 rooms
- 66 rooms
- 07 rooms
- 08 rooms
- 09+ rooms


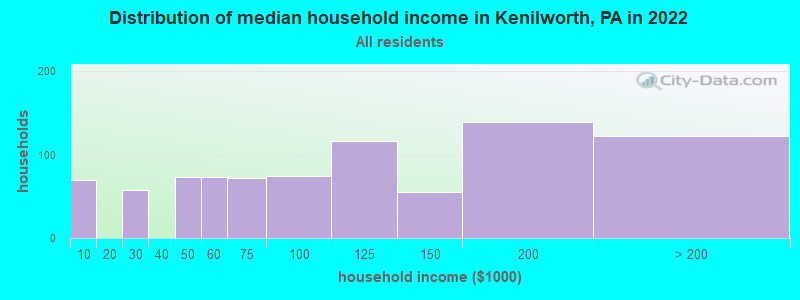
Kenilworth, PA household income distribution

- 70Less than $10,000
- 58$20,000 to $29,999
- 73$40,000 to $49,999
- 73$50,000 to $59,999
- 72$60,000 to $74,999
- 74$75,000 to $99,999
- 116$100,000 to $124,999
- 55$125,000 to $149,999
- 139$150,000 to $199,999
- 122$200,000 or more
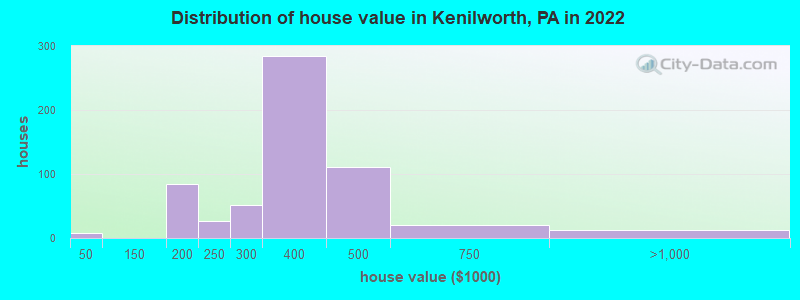
Home value of owner - occupied houses in 2022 in Kenilworth, PA
-
- 8$25,000 to $29,999
- 58$150,000 to $174,999
- 26$175,000 to $199,999
- 26$200,000 to $249,999
- 52$250,000 to $299,999
- 284$300,000 to $399,999
- 111$400,000 to $499,999
- 20$500,000 to $749,999
- 13$750,000 to $999,999
Rent paid by renters in 2022 in Kenilworth, PA
-
- 80$800 to $899
- 7$900 to $999
- 141$1,000 to $1,249
- 15$1,250 to $1,499

Percentage of workers working in this county: 49.3%
Number of people working at home: 199 (16.2% of all workers)
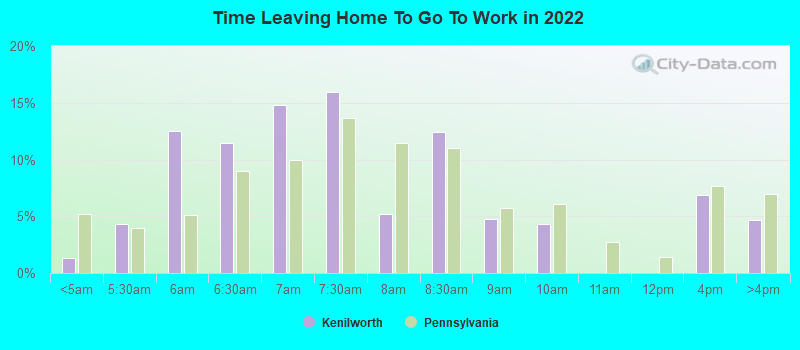
Travel time to work (commute)
- Less than 5 minutes: 0
- 5 to 9 minutes: 76
- 10 to 14 minutes: 148
- 15 to 19 minutes: 102
- 20 to 24 minutes: 200
- 25 to 29 minutes: 26
- 30 to 34 minutes: 94
- 35 to 39 minutes: 107
- 40 to 44 minutes: 133
- 45 to 59 minutes: 22
- 60 to 89 minutes: 61
- 90 or more minutes: 34
Means of transportation to work:
- Drove a car alone: 695 (86.6%)
- Carpooled: 84 (10.5%)
- Bicycle: 12 (1.5%)
- Other means: 4 (0.5%)
- Worked at home: 8 (1.0%)
- Unemployment by race in 2022
- Unemployment rate for White non-Hispanic residents
- 0.6%Males
- 2.0%Females

- Year of entry for the foreign-born population in Kenilworth, Pennsylvania
- 102010 or later
- 02000 to 2009
- 01990 to 1999
- 01980 to 1989
- 51970 to 1979
- 16Before 1970
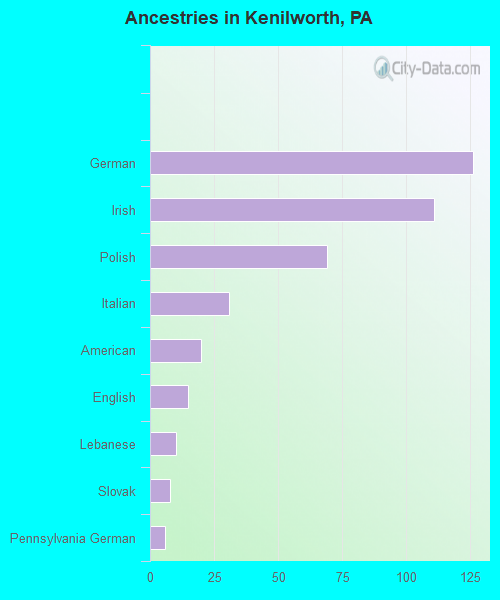
First ancestries reported:
- German: 126 (25.0%)
- Irish: 111 (22.0%)
- Polish: 69 (13.7%)
- Italian: 31 (6.1%)
- American: 20 (4.0%)
- English: 15 (3.0%)
- Lebanese: 10 (2.0%)
- Slovak: 8 (1.6%)
- Pennsylvania German: 6 (1.2%)
Most common places of birth for foreign-born residents (%):
| Kenilworth: | 44.2% (23) |
| Pennsylvania: | 0.5% (4,648) |
| Kenilworth: | 15.4% (8) |
| Pennsylvania: | 1.9% (18,065) |
| Kenilworth: | 15.4% (8) |
| Pennsylvania: | 0.3% (2,787) |
| Kenilworth: | 11.5% (6) |
| Pennsylvania: | 2.9% (27,433) |
| Kenilworth: | 9.6% (5) |
| Pennsylvania: | 1.3% (12,172) |
Place of birth for U.S.-born residents:
- This state: 1,556
- Other state: 433
- Northeast: 220
- Midwest: 137
- South: 70
- West: 8
96.1% of Kenilworth residents lived in the same house 1 years ago.
Out of people who lived in different houses, 23.5% lived in this county.
Out of people who lived in different counties, 100.0% lived in Pennsylvania.
| Kenilworth: | 96.1% |
| State average: | 89.3% |
Education attainment for males 25 years and older:
- No schooling: 0
- Nursery to 4th grade: 0
- 5th and 6th grade: 0
- 7th and 8th grade: 0
- 9th grade: 21
- 10th grade: 33
- 11th grade: 0
- 12th grade, no diploma: 0
- High school graduate (or equivalency): 276
- Less than 1 year of college: 18
- Some college more than 1 year, no degree: 106
- Associate degree: 110
- Bachelor's degree: 175
- Master's degree: 54
- Professional school degree: 15
- Doctorate degree: 0

Education attainment for females 25 years and older:
- No schooling: 11
- Nursery to 4th grade: 0
- 5th and 6th grade: 0
- 7th and 8th grade: 0
- 9th grade: 0
- 10th grade: 35
- 11th grade: 0
- 12th grade, no diploma: 0
- High school graduate (or equivalency): 235
- Less than 1 year of college: 24
- Some college more than 1 year, no degree: 112
- Associate degree: 59
- Bachelor's degree: 131
- Master's degree: 74
- Professional school degree: 11
- Doctorate degree: 21


Housing units in structures:
- One, detached: 581
- Two: 14
- 5 to 9: 41
- 10 to 19: 183
- 20 to 49: 42
- Mobile homes: 24
House/condo owner moved in on average 12 years ago
Renter moved in on average 4 years ago

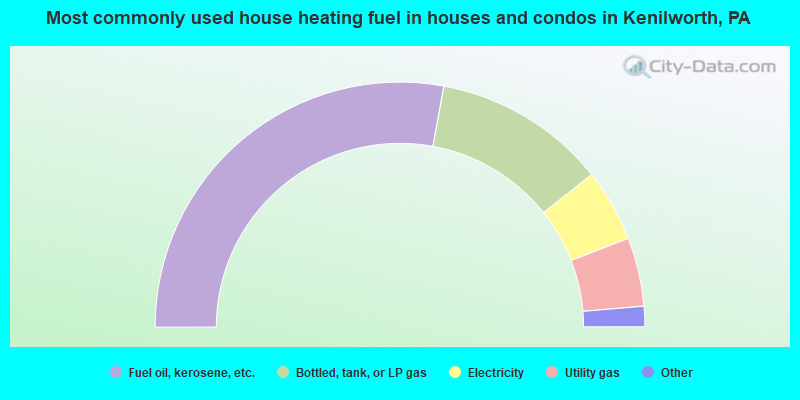
- 55.8%Fuel oil, kerosene, etc.
- 22.9%Bottled, tank, or LP gas
- 9.6%Electricity
- 9.1%Utility gas
- 1.8%Wood
- 0.7%Other fuel
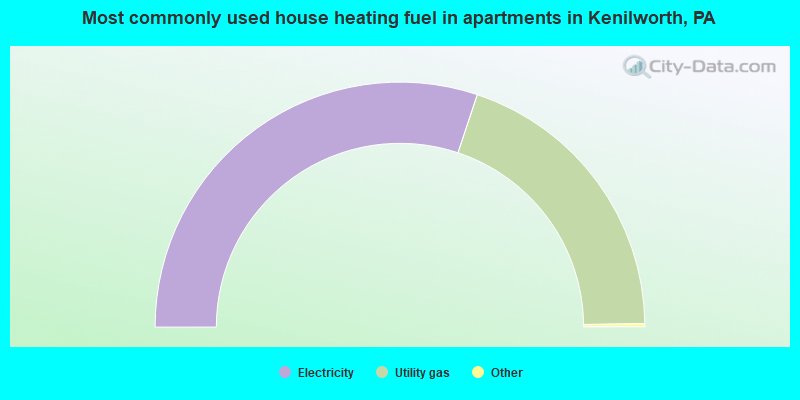
- 60.5%Electricity
- 39.5%Utility gas
Private vs. public school enrollment:
| Here: | 0.0% |
| Pennsylvania: | 15.7% |
| Here: | 25.0% |
| Pennsylvania: | 13.4% |
| Here: | 19.5% |
| Pennsylvania: | 39.8% |


