Kenova, WV (West Virginia) Houses and Residents
| Kenova: | $99,996 |
| West Virginia: | $155,100 |
Mean price in 2022:
Detached houses: $143,301
Here: $143,301 State: $206,655 Mobile homes: $12,925
Here: $12,925 State: $63,963
Total population: 3,096 (All urban)
Houses: 1,489 (1,350 occupied: 753 owner occupied, 631 renter occupied)
| % of renters here: | 46% |
| State: | 26% |
Housing density: 1,234 houses/condos per square mile
Median price asked for vacant for-sale houses and condos in 2022 in this county: $97,691.
Median contract rent in 2022: $501 (lower quartile is $295, upper quartile is $611)
Median rent asked for vacant for-rent units in 2022: $1,345
Median gross rent in Kenova, WV in 2022: $769
Housing units in Kenova with a mortgage: 212 (0 second mortgage, 0 home equity loan, 0 both second mortgage and home equity loan)
Houses without a mortgage: 0
Median household income for houses/condos with a mortgage: $43,821
Median household income for apartments without a mortgage: $50,335
Median monthly housing costs: $585
Compare current foreclosures near Kenova, WV:
| Photo | Address | Area | Beds / Baths | Price | Details |
|---|---|---|---|---|---|

|
#1
Route 75
Kenova, WV 25530
|
1,580 sq. feet
|
2 baths 3 beds |
$174,995
|
show details |

|
#2
Walnut St
Kenova, WV 25530
|
2,063 sq. feet
|
2 baths 4 beds |
$220,000
|
show details |

|
#3
Oak St
Kenova, WV 25530
|
1,152 sq. feet
|
1 baths 3 beds |
show details | |

|
#4
Maple St
Kenova, WV 25530
|
1,030 sq. feet
|
1 baths 3 beds |
show details | |

|
#5
Walnut St
Kenova, WV 25530
|
2,142 sq. feet
|
1 baths 3 beds |
show details | |

|
#6
Maple St
Kenova, WV 25530
|
- sq. feet
|
- baths - beds |
show details | |

|
#7
Barger Hill Rd
Kenova, WV 25530
|
- sq. feet
|
- baths - beds |
show details | |

|
#8
Pinto Ln
Kenova, WV 25530
|
- sq. feet
|
- baths - beds |
show details | |

|
#9
Oak St Apt 4
Kenova, WV 25530
|
- sq. feet
|
- baths - beds |
show details | |

|
#10
Hidden Meadows Ln
Kenova, WV 25530
|
- sq. feet
|
- baths - beds |
show details |
| Photo | Address | Area | Beds / Baths | Price | Details |
|---|---|---|---|---|---|

|
#11
Valley St
Catlettsburg, KY 41129
|
1,324 sq. feet
|
1 baths 3 beds |
$115,000
|
show details |

|
#12
& 3328 Crane Avenue
Huntington, WV 25705
|
950 sq. feet
|
1 baths 3 beds |
$42,500
|
show details |

|
#13
Township Rd 1007
Chesapeake, OH 45619
|
1,560 sq. feet
|
2 baths 3 beds |
$54,500
|
show details |

|
#14
Co Rd 181
Ironton, OH 45638
|
988 sq. feet
|
1 baths 3 beds |
$124,900
|
show details |

|
#15
Jackson Ave
Huntington, WV 25704
|
1,450 sq. feet
|
2 baths 2 beds |
$145,000
|
show details |

|
#16
Twp. Rd 1366
South Point, OH 45680
|
1,144 sq. feet
|
1 baths 2 beds |
$124,900
|
show details |

|
#17
Charleston Ave
Huntington, WV 25701
|
1,200 sq. feet
|
2 baths 4 beds |
$27,900
|
show details |

|
#18
S 5th St
Ironton, OH 45638
|
2,214 sq. feet
|
2 baths 3 beds |
$20,900
|
show details |

|
#19
Olivia Jamison Rd
Wayne, WV 25570
|
- sq. feet
|
2 baths 3 beds |
$72,800
|
show details |

|
#20
4th Ave
Huntington, WV 25702
|
1,305 sq. feet
|
2 baths 3 beds |
$37,900
|
show details |
| Photo | Address | Area | Beds / Baths | Price | Details |
|---|---|---|---|---|---|

|
#21
Beech St
Huntington, WV 25701
|
1,524 sq. feet
|
1 baths 3 beds |
$9,900
|
show details |

|
#22
Doss Hill Rd
Barboursville, WV 25504
|
1,040 sq. feet
|
1 baths 2 beds |
$23,900
|
show details |

|
#23
Central Ave
Ashland, KY 41101
|
2 sq. feet
|
1 baths 3 beds |
show details | |

|
#24
State Route 5
Ashland, KY 41102
|
1,791 sq. feet
|
2 baths 2 beds |
show details | |

|
#25
Township Road 301a
Ironton, OH 45638
|
1,363 sq. feet
|
1 baths 3 beds |
show details | |

|
#26
Richmond St
Huntington, WV 25702
|
1,896 sq. feet
|
2 baths 3 beds |
show details | |

|
#27
County Road 15
South Point, OH 45680
|
2,368 sq. feet
|
2 baths 4 beds |
show details | |

|
#28
Norway Ave
Huntington, WV 25705
|
1,302 sq. feet
|
2 baths 3 beds |
show details | |

|
#29
Hite Ave
Huntington, WV 25705
|
728 sq. feet
|
1 baths 2 beds |
show details | |

|
#30
10th Ave
Huntington, WV 25701
|
2,128 sq. feet
|
2 baths 3 beds |
show details |
| Photo | Address | Area | Beds / Baths | Price | Details |
|---|---|---|---|---|---|

|
#31
Terrace Blvd
Ashland, KY 41102
|
960 sq. feet
|
1 baths 2 beds |
show details | |

|
#32
Route 75
Huntington, WV 25704
|
1,092 sq. feet
|
2 baths 3 beds |
show details | |

|
#33
Johnson Ave
Ashland, KY 41102
|
1,950 sq. feet
|
2 baths 3 beds |
show details | |

|
#34
Nickel Plate Dr
Huntington, WV 25705
|
- sq. feet
|
4 baths 3 beds |
show details | |

|
#35
County Road 1
South Point, OH 45680
|
1,152 sq. feet
|
1 baths 3 beds |
show details | |

|
#36
Countryside Dr
Ashland, KY 41102
|
1,040 sq. feet
|
1 baths 3 beds |
show details | |

|
#37
Howland Ave
Russell, KY 41169
|
1,216 sq. feet
|
1 baths 3 beds |
show details | |

|
#38
Doss Hill Rd
Barboursville, WV 25504
|
2,046 sq. feet
|
1 baths 2 beds |
show details | |

|
#39
Florence St
Ashland, KY 41101
|
1,200 sq. feet
|
1 baths 3 beds |
show details | |

|
#40
Lynn Creek Rd
Lavalette, WV 25535
|
1,381 sq. feet
|
1 baths 3 beds |
show details |
| Photo | Address | Area | Beds / Baths | Price | Details |
|---|---|---|---|---|---|

|
#41
Boone St
Ashland, KY 41101
|
720 sq. feet
|
1 baths 3 beds |
show details | |

|
#42
3rd St W
Huntington, WV 25701
|
1,366 sq. feet
|
1 baths 2 beds |
show details | |

|
#43
Camelot Dr
Huntington, WV 25701
|
2,600 sq. feet
|
2 baths 3 beds |
show details | |

|
#44
Rt. 5
Ashland, KY 41102
|
1,228 sq. feet
|
1 baths 4 beds |
show details | |

|
#45
8th Street Rd
Huntington, WV 25701
|
1,279 sq. feet
|
1 baths 3 beds |
show details | |

|
#46
State Route 5
Ashland, KY 41102
|
1,623 sq. feet
|
1 baths 2 beds |
show details | |

|
#47
Heritage Park Rd
Huntington, WV 25704
|
1,360 sq. feet
|
2 baths 3 beds |
show details | |

|
#48
Roberson Rd
Ashland, KY 41102
|
1,728 sq. feet
|
1 baths 4 beds |
show details | |

|
#49
W Old Buckley Rd
Ashland, KY 41102
|
876 sq. feet
|
1 baths 2 beds |
show details | |

|
Check over 1 million property listings on Foreclosure.com!
|
browse all offers | |||

Latest news about housing in Kenova, WV collected exclusively by city-data.com from local newspapers, TV, and radio stations

 | The north/south dividing line in West Virginia? (170 replies) |
| Huntington continues to seek ways to improve (1008 replies) |
| Housing in the Huntington/Kenova/Ceredo area? (1 reply) |
| What Will Huntington Be Like In Ten Years? Twenty Years (Please No Political Diatribes) (58 replies) |
| Tell me about where you live. (5 replies) |
| Possibly moving to the Huntington WV area (10 replies) |

Median year apartment built: 1964
Household type by relationship:
Households: 2,989- Male householders: 549 (135 living alone), Female householders: 784 (334 living alone)
592 spouses (592 opposite-sex spouses), 94 unmarried partners, (94 opposite-sex unmarried partners), 611 children (499 natural, 21 adopted, 90 stepchildren), 59 grandchildren, 0 brothers or sisters, 51 parents, 0 foster children, 31 other relatives, 210 non-relatives
- In group quarters: 3
Size of family households: 488 2-persons, 226 3-persons, 147 4-persons, 17 6-persons.
Size of nonfamily households: 486 1-person, 18 2-persons.
74 married couples with children.
226 single-parent households (87 men, 139 women).
100.1% of residents of Kenova speak English at home.
Foreign born population: 14 (0.5%)
(0.0% of them are naturalized citizens)
| Here: | 6.3 |
| State: | 6.5 |
| Here: | 5.0 |
| State: | 4.7 |

- Bedrooms in owner-occupied houses and condos in Kenova, West Virginia
- 0no bedroom
- 01 bedroom
- 2972 bedrooms
- 4053 bedrooms
- 514 bedrooms
- 05+ bedrooms

- Bedrooms in renter-occupied apartments in Kenova, West Virginia
- 103no bedroom
- 651 bedroom
- 2292 bedrooms
- 2343 bedrooms
- 04 bedrooms
- 05+ bedrooms

- Cars and other vehicles available in Kenova in owner-occupied houses/condos
- 13no vehicle
- 3711 vehicle
- 2242 vehicles
- 1353 vehicles
- 104 vehicles
- 05+ vehicles

- Cars and other vehicles available in Kenova in renter-occupied apartments
- 30no vehicle
- 4921 vehicle
- 832 vehicles
- 273 vehicles
- 04 vehicles
- 05+ vehicles

- Rooms in owner-occupied houses in Kenova, West Virginia
- 01 room
- 02 rooms
- 03 rooms
- 754 rooms
- 1665 rooms
- 1956 rooms
- 1517 rooms
- 788 rooms
- 889+ rooms

- Rooms in renter-occupied apartments in Kenova, West Virginia
- 1031 room
- 02 rooms
- 293 rooms
- 964 rooms
- 1735 rooms
- 1246 rooms
- 07 rooms
- 148 rooms
- 939+ rooms


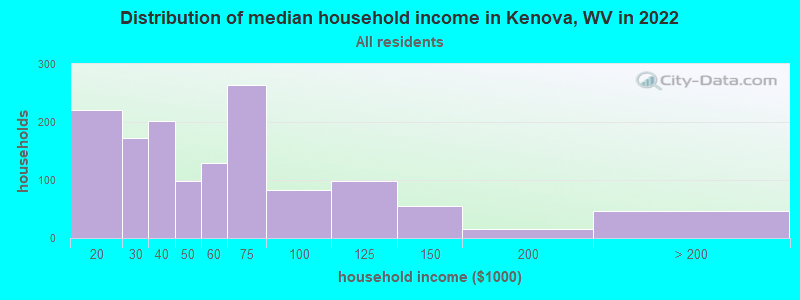
Kenova, WV household income distribution

- 221$10,000 to $19,999
- 172$20,000 to $29,999
- 202$30,000 to $39,999
- 99$40,000 to $49,999
- 130$50,000 to $59,999
- 264$60,000 to $74,999
- 82$75,000 to $99,999
- 98$100,000 to $124,999
- 55$125,000 to $149,999
- 16$150,000 to $199,999
- 46$200,000 or more
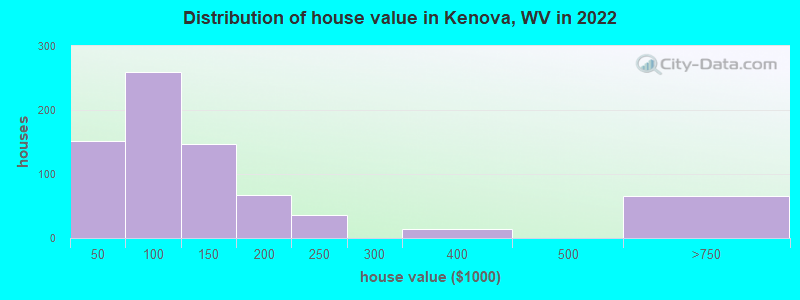
Home value of owner - occupied houses in 2022 in Kenova, WV
-
- 46Less than $10,000
- 89$20,000 to $24,999
- 14$40,000 to $49,999
- 54$50,000 to $59,999
- 59$60,000 to $69,999
- 73$80,000 to $89,999
- 58$90,000 to $99,999
- 101$100,000 to $124,999
- 45$125,000 to $149,999
- 51$150,000 to $174,999
- 15$175,000 to $199,999
- 35$200,000 to $249,999
- 13$300,000 to $399,999
- 65$500,000 to $749,999
Rent paid by renters in 2022 in Kenova, WV
-
- 20$100 to $149
- 90$250 to $299
- 55$300 to $349
- 56$400 to $449
- 25$450 to $499
- 22$500 to $549
- 58$550 to $599
- 131$600 to $649
- 68$700 to $749
- 61No cash rent


Percentage of workers working in this county: 69.5%
Number of people working at home: 134 (9.5% of all workers)
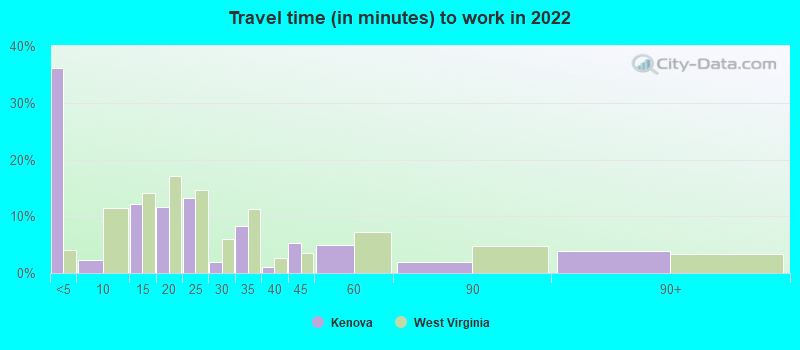
Travel time to work (commute)
- Less than 5 minutes: 783
- 5 to 9 minutes: 98
- 10 to 14 minutes: 78
- 15 to 19 minutes: 116
- 20 to 24 minutes: 58
- 25 to 29 minutes: 52
- 30 to 34 minutes: 112
- 35 to 39 minutes: 0
- 40 to 44 minutes: 0
- 45 to 59 minutes: 16
- 60 to 89 minutes: 24
- 90 or more minutes: 0
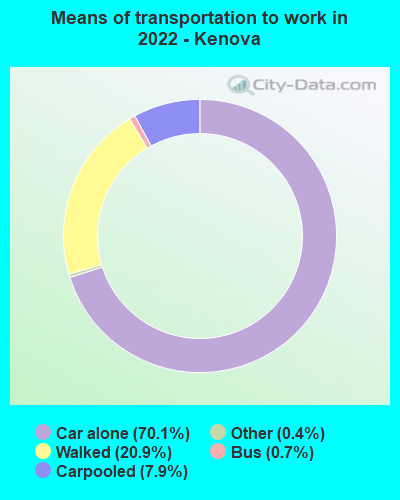
Means of transportation to work:
- Drove a car alone: 1,171 (64.7%)
- Carpooled: 132 (7.3%)
- Bus: 11 (0.6%)
- Taxi: 6 (0.3%)
- Walked: 325 (17.9%)
- Worked at home: 134 (7.4%)

- Unemployment by race in 2022
- Unemployment rate for White non-Hispanic residents
- 2.4%Males

- Year of entry for the foreign-born population in Kenova, West Virginia
- 02010 or later
- 02000 to 2009
- 01990 to 1999
- 01980 to 1989
- 01970 to 1979
- 7Before 1970

First ancestries reported:
- English: 411 (39.9%)
- American: 164 (15.9%)
- German: 93 (9.0%)
- Welsh: 58 (5.6%)
- Irish: 56 (5.4%)
- Scotch-Irish: 55 (5.3%)
- European: 26 (2.5%)
- Italian: 15 (1.5%)
- Australian: 12 (1.2%)
- British: 11 (1.1%)
Most common places of birth for foreign-born residents (%):
| Kenova: | 92.3% (12) |
| West Virginia: | 0.5% (148) |
Place of birth for U.S.-born residents:
- This state: 2,033
- Other state: 902
- Northeast: 171
- Midwest: 240
- South: 451
- West: 37
79.0% of Kenova residents lived in the same house 1 years ago.
Out of people who lived in different houses, 44.5% lived in this county.
Out of people who lived in different counties, 100.0% lived in West Virginia.
| Kenova: | 79.0% |
| State average: | 89.6% |
Education attainment for males 25 years and older:
- No schooling: 0
- Nursery to 4th grade: 0
- 5th and 6th grade: 0
- 7th and 8th grade: 36
- 9th grade: 0
- 10th grade: 0
- 11th grade: 0
- 12th grade, no diploma: 36
- High school graduate (or equivalency): 555
- Less than 1 year of college: 15
- Some college more than 1 year, no degree: 183
- Associate degree: 105
- Bachelor's degree: 158
- Master's degree: 41
- Professional school degree: 0
- Doctorate degree: 0

Education attainment for females 25 years and older:
- No schooling: 0
- Nursery to 4th grade: 17
- 5th and 6th grade: 0
- 7th and 8th grade: 11
- 9th grade: 0
- 10th grade: 10
- 11th grade: 63
- 12th grade, no diploma: 0
- High school graduate (or equivalency): 570
- Less than 1 year of college: 126
- Some college more than 1 year, no degree: 136
- Associate degree: 146
- Bachelor's degree: 117
- Master's degree: 47
- Professional school degree: 0
- Doctorate degree: 64


Housing units in structures:
- One, detached: 1,184
- 3 or 4: 153
- 50 or more: 14
- Mobile homes: 123
- Boats, RVs, vans, etc.: 14
Median worth of mobile homes: $21,623
Housing units lacking complete kitchen facilities in 2022: 3.6%
House/condo owner moved in on average 21 years ago
Renter moved in on average 2 years ago

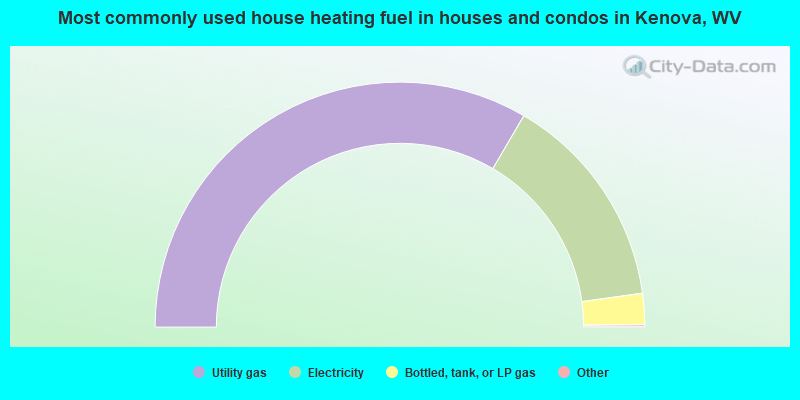
- 67.1%Utility gas
- 28.8%Electricity
- 4.1%Bottled, tank, or LP gas
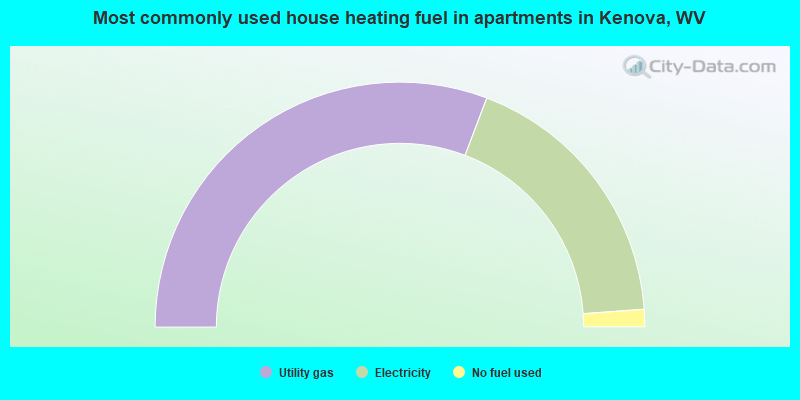
- 61.6%Utility gas
- 36.2%Electricity
- 2.3%No fuel used
Private vs. public school enrollment:
| Here: | 63.4% |
| West Virginia: | 12.2% |
| Here: | 53.5% |
| West Virginia: | 8.8% |
| Here: | 0.0% |
| West Virginia: | 17.3% |


