Kensington, CT (Connecticut) Houses and Residents
| Kensington: | $310,517 |
| Connecticut: | $347,200 |
Total population: 8,459 (All urban)
Houses: 4,428 (4,208 occupied: 3,513 owner occupied, 741 renter occupied)
| % of renters here: | 17% |
| State: | 34% |
Housing density: 841 houses/condos per square mile
Median price asked for vacant for-sale houses and condos in 2022 in this county: $360,195.
Median contract rent in 2022: $1,148 (lower quartile is $1,010, upper quartile is $1,332)
Median rent asked for vacant for-rent units in 2022: $277
Median gross rent in Kensington, CT in 2022: $1,375
Housing units in Kensington with a mortgage: 2,106 (288 second mortgage, 0 home equity loan, 277 both second mortgage and home equity loan)
Houses without a mortgage: 79
Median household income for houses/condos with a mortgage: $115,204
Median household income for apartments without a mortgage: $88,882
Median monthly housing costs: $1,589
Compare current foreclosures near Kensington, CT:
| Photo | Address | Area | Beds / Baths | Price | Details |
|---|---|---|---|---|---|

|
#1
Mountain Rd
Windsor, CT 06095
|
1,144 sq. feet
|
2 baths 3 beds |
$230,000
|
show details |

|
#2
Janwood Rd
Waterbury, CT 06708
|
1,200 sq. feet
|
2 baths 3 beds |
$275,000
|
show details |

|
#3
Birchwood Dr
Hamden, CT 06518
|
2,604 sq. feet
|
2 baths 3 beds |
$614,900
|
show details |

|
#4
Allen St
Bristol, CT 06010
|
1,092 sq. feet
|
1 baths 3 beds |
$215,000
|
show details |

|
#5
Dowd Ave
Canton, CT 06019
|
1,190 sq. feet
|
1 baths 2 beds |
$239,900
|
show details |

|
#6
Willis Ave
Meriden, CT 06450
|
1,008 sq. feet
|
1 baths 2 beds |
$299,900
|
show details |

|
#7
Roosevelt St
New Britain, CT 06051
|
1,536 sq. feet
|
2 baths 3 beds |
$299,900
|
show details |

|
#8
Newberry Rd
South Windsor, CT 06074
|
3,386 sq. feet
|
2 baths 4 beds |
$649,900
|
show details |

|
#9
Irving St
Manchester, CT 06042
|
1,335 sq. feet
|
2 baths 3 beds |
$251,750
|
show details |

|
#10
Clinton Hill Rd
Wolcott, CT 06716
|
1,828 sq. feet
|
1 baths 3 beds |
$240,000
|
show details |
| Photo | Address | Area | Beds / Baths | Price | Details |
|---|---|---|---|---|---|

|
#11
Peck St
Berlin, CT 06037
|
608 sq. feet
|
1 baths 1 beds |
$144,900
|
show details |

|
#12
Winthrop Blvd
Cromwell, CT 06416
|
1,092 sq. feet
|
1 baths 3 beds |
$220,000
|
show details |

|
#13
Pratt St
Meriden, CT 06450
|
1,040 sq. feet
|
2 baths 3 beds |
show details | |

|
#14
Center St
Wallingford, CT 06492
|
2,412 sq. feet
|
1 baths 2 beds |
show details | |

|
#15
Butternut Ln
Rocky Hill, CT 06067
|
1,176 sq. feet
|
1 baths 2 beds |
show details | |

|
#16
Cedarwood Ln
Newington, CT 06111
|
2,111 sq. feet
|
1 baths 2 beds |
show details | |

|
#17
Carter Rd
Plymouth, CT 06782
|
2,192 sq. feet
|
2 baths 3 beds |
show details | |

|
#18
Main St
Newington, CT 06111
|
1,880 sq. feet
|
1 baths 3 beds |
show details | |

|
#19
Rena Ln
Waterbury, CT 06705
|
1,080 sq. feet
|
1 baths 3 beds |
show details | |

|
#20
Thompson Rd # 2g
Manchester, CT 06040
|
734 sq. feet
|
1 baths 1 beds |
show details |
| Photo | Address | Area | Beds / Baths | Price | Details |
|---|---|---|---|---|---|

|
#21
Park Ave
Windsor, CT 06095
|
969 sq. feet
|
2 baths 3 beds |
show details | |

|
#22
Fawn Dr
Meriden, CT 06451
|
1,766 sq. feet
|
2 baths 4 beds |
show details | |

|
#23
Amity St
Meriden, CT 06450
|
1,568 sq. feet
|
2 baths 3 beds |
show details | |

|
#24
Hidden Valley Dr
Meriden, CT 06451
|
2,264 sq. feet
|
2 baths 4 beds |
show details | |

|
#25
Lockhart Ave
Waterbury, CT 06705
|
- sq. feet
|
2 baths 3 beds |
show details | |

|
#26
Robbins Ave
Newington, CT 06111
|
1,346 sq. feet
|
2 baths 3 beds |
show details | |

|
#27
Orient St
Meriden, CT 06450
|
1,780 sq. feet
|
3 baths 3 beds |
show details | |

|
#28
Park Rd
Marlborough, CT 06447
|
1,134 sq. feet
|
1 baths 3 beds |
show details | |

|
#29
Cornwall St
Hartford, CT 06112
|
1,248 sq. feet
|
1 baths 3 beds |
show details | |

|
#30
Surrey Dr
Bristol, CT 06010
|
1,079 sq. feet
|
1 baths 3 beds |
show details |
| Photo | Address | Area | Beds / Baths | Price | Details |
|---|---|---|---|---|---|

|
#31
Jones Hollow Rd
Marlborough, CT 06447
|
1,984 sq. feet
|
2 baths 3 beds |
show details | |

|
#32
Fairfield Ave
Waterbury, CT 06708
|
1,538 sq. feet
|
1 baths 2 beds |
show details | |

|
#33
Fawn Meadow Dr
Naugatuck, CT 06770
|
3,052 sq. feet
|
3 baths 4 beds |
show details | |

|
#34
Evansville Ave
Meriden, CT 06451
|
624 sq. feet
|
1 baths 3 beds |
show details | |

|
#35
Cheshire St
Hartford, CT 06114
|
3,279 sq. feet
|
2 baths 4 beds |
show details | |

|
#36
Vanderbilt Rd
Bristol, CT 06010
|
1,803 sq. feet
|
1 baths 5 beds |
show details | |

|
#37
Broadview Ter
Hartford, CT 06106
|
1,821 sq. feet
|
2 baths 7 beds |
show details | |

|
#38
Maple Hill Rd
Naugatuck, CT 06770
|
1,600 sq. feet
|
2 baths 3 beds |
show details | |

|
#39
Clairmont Ave
Waterbury, CT 06708
|
1,564 sq. feet
|
2 baths 4 beds |
show details | |

|
#40
Farmington Chase Cre
Farmington, CT 06032
|
1,317 sq. feet
|
1 baths 2 beds |
show details |
| Photo | Address | Area | Beds / Baths | Price | Details |
|---|---|---|---|---|---|

|
#41
Barbara Dr
Waterbury, CT 06705
|
1,248 sq. feet
|
2 baths 3 beds |
show details | |

|
#42
E Hill Rd Apt 4d
Canton, CT 06019
|
1,116 sq. feet
|
2 baths 2 beds |
show details | |

|
#43
Spencer Dr
Middletown, CT 06457
|
912 sq. feet
|
1 baths 3 beds |
show details | |

|
#44
Hollister Dr
East Hartford, CT 06118
|
1,300 sq. feet
|
1 baths 3 beds |
show details | |

|
#45
Horne Cir
Southington, CT 06489
|
1,902 sq. feet
|
2 baths 4 beds |
show details | |

|
#46
Robin Ln
Cheshire, CT 06410
|
1,641 sq. feet
|
2 baths 3 beds |
show details | |

|
#47
Spring St
Meriden, CT 06451
|
660 sq. feet
|
1 baths 3 beds |
show details | |

|
#48
Lydale Pl
Meriden, CT 06450
|
1,716 sq. feet
|
2 baths 3 beds |
show details | |

|
#49
Bell Ct Apt C1
East Hartford, CT 06108
|
890 sq. feet
|
1 baths 2 beds |
show details | |

|
Check over 1 million property listings on Foreclosure.com!
|
browse all offers | |||

Latest news about housing in Kensington, CT collected exclusively by city-data.com from local newspapers, TV, and radio stations


Median year apartment built: 1959
Household type by relationship:
Households: 9,619- Male householders: 2,332 (444 living alone), Female householders: 1,868 (699 living alone)
2,212 spouses (2,199 opposite-sex spouses), 149 unmarried partners, (136 opposite-sex unmarried partners), 2,437 children (2,231 natural, 160 adopted, 45 stepchildren), 139 grandchildren, 20 brothers or sisters, 155 parents, 0 foster children, 148 other relatives, 90 non-relatives
- In group quarters: 65
Size of family households: 1,386 2-persons, 851 3-persons, 492 4-persons, 179 5-persons, 31 6-persons.
Size of nonfamily households: 1,208 1-person, 57 2-persons, 13 3-persons.
1,247 married couples with children.
518 single-parent households (193 men, 325 women).
83.6% of residents of Kensington speak English at home.
5.2% of residents speak Spanish at home (100% speak English very well).
8.0% of residents speak other Indo-European language at home (67% speak English very well, 24% speak English well, 8% speak English not well).
2.9% of residents speak Asian or Pacific Island language at home (72% speak English very well, 8% speak English well, 3% speak English not well, 17% don't speak English at all).
0.8% of residents speak other language at home (100% speak English very well).
Foreign born population: 877 (9.1%)
(66.5% of them are naturalized citizens)
| Here: | 6.3 |
| State: | 6.5 |
| Here: | 3.9 |
| State: | 4.0 |

- Bedrooms in owner-occupied houses and condos in Kensington, Connecticut
- 0no bedroom
- 2461 bedroom
- 5822 bedrooms
- 2,2023 bedrooms
- 4334 bedrooms
- 515+ bedrooms

- Bedrooms in renter-occupied apartments in Kensington, Connecticut
- 46no bedroom
- 1131 bedroom
- 4052 bedrooms
- 1713 bedrooms
- 74 bedrooms
- 05+ bedrooms

- Cars and other vehicles available in Kensington in owner-occupied houses/condos
- 86no vehicle
- 6911 vehicle
- 1,7292 vehicles
- 6803 vehicles
- 3264 vehicles
- 05+ vehicles

- Cars and other vehicles available in Kensington in renter-occupied apartments
- 63no vehicle
- 3131 vehicle
- 2032 vehicles
- 1623 vehicles
- 04 vehicles
- 05+ vehicles

- Rooms in owner-occupied houses in Kensington, Connecticut
- 01 room
- 122 rooms
- 2313 rooms
- 2444 rooms
- 4795 rooms
- 1,0066 rooms
- 8827 rooms
- 3298 rooms
- 3309+ rooms

- Rooms in renter-occupied apartments in Kensington, Connecticut
- 461 room
- 352 rooms
- 1113 rooms
- 3384 rooms
- 1745 rooms
- 186 rooms
- 137 rooms
- 78 rooms
- 09+ rooms


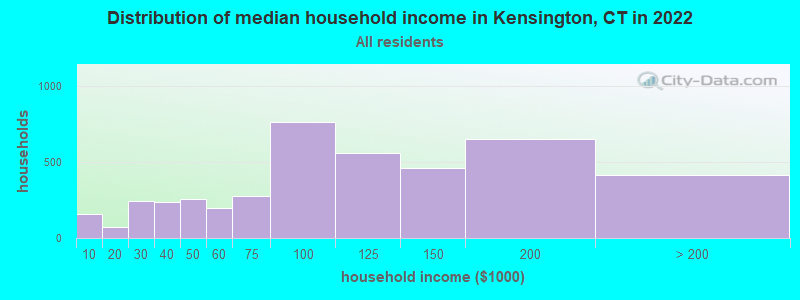
Kensington, CT household income distribution

- 155Less than $10,000
- 75$10,000 to $19,999
- 242$20,000 to $29,999
- 237$30,000 to $39,999
- 257$40,000 to $49,999
- 197$50,000 to $59,999
- 279$60,000 to $74,999
- 765$75,000 to $99,999
- 559$100,000 to $124,999
- 462$125,000 to $149,999
- 652$150,000 to $199,999
- 416$200,000 or more
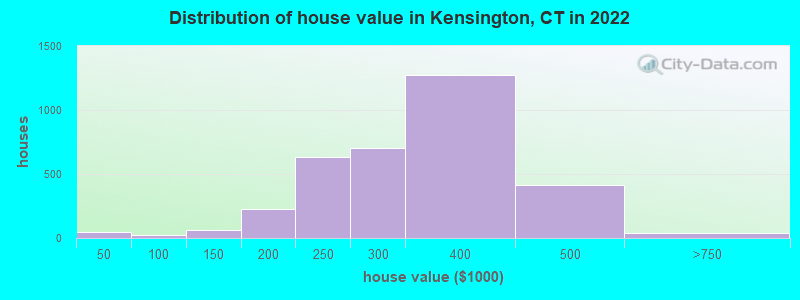
Home value of owner - occupied houses in 2022 in Kensington, CT
-
- 20Less than $10,000
- 21$25,000 to $29,999
- 19$90,000 to $99,999
- 61$125,000 to $149,999
- 80$150,000 to $174,999
- 145$175,000 to $199,999
- 633$200,000 to $249,999
- 700$250,000 to $299,999
- 1,274$300,000 to $399,999
- 415$400,000 to $499,999
- 23$500,000 to $749,999
- 11$1,500,000 to $1,999,999
Rent paid by renters in 2022 in Kensington, CT
-
- 10$400 to $449
- 15$450 to $499
- 37$550 to $599
- 15$800 to $899
- 44$900 to $999
- 358$1,000 to $1,249
- 128$1,250 to $1,499
- 53$1,500 to $1,999
- 11$2,000 to $2,499
- 17$2,500 to $2,999
- 24No cash rent


Percentage of workers working in this county: 89.9%
Number of people working at home: 992 (17.9% of all workers)
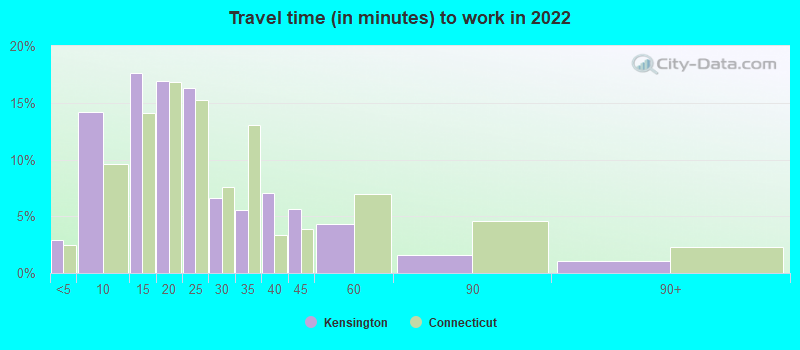
Travel time to work (commute)
- Less than 5 minutes: 171
- 5 to 9 minutes: 903
- 10 to 14 minutes: 532
- 15 to 19 minutes: 646
- 20 to 24 minutes: 892
- 25 to 29 minutes: 256
- 30 to 34 minutes: 482
- 35 to 39 minutes: 259
- 40 to 44 minutes: 69
- 45 to 59 minutes: 186
- 60 to 89 minutes: 118
- 90 or more minutes: 59
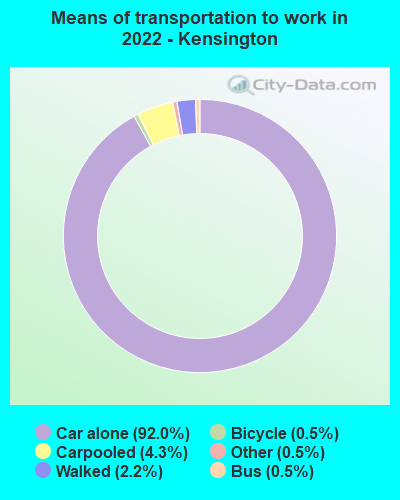
Means of transportation to work:
- Drove a car alone: 3,810 (74.1%)
- Carpooled: 188 (3.7%)
- Bus: 21 (0.4%)
- Taxi: 25 (0.5%)
- Bicycle: 18 (0.4%)
- Walked: 96 (1.9%)
- Worked at home: 992 (19.3%)

- Unemployment by race in 2022
- Unemployment rate for White non-Hispanic residents
- 1.9%Males
- 0.4%Females
- Unemployment rate for Asian residents
- 31.6%Females

- Year of entry for the foreign-born population in Kensington, Connecticut
- 2972010 or later
- 1042000 to 2009
- 2231990 to 1999
- 1321980 to 1989
- 1761970 to 1979
- 469Before 1970
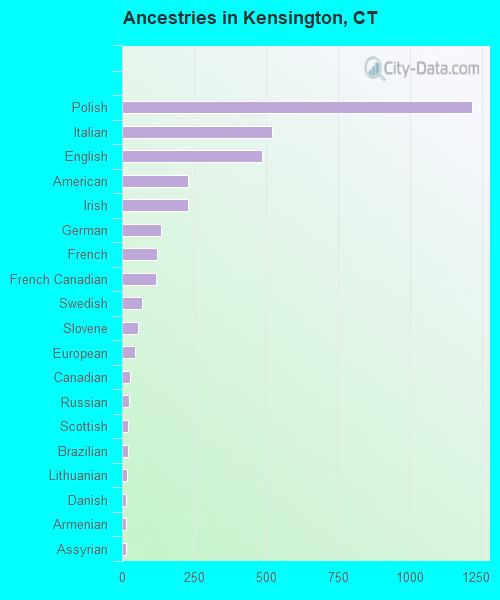
First ancestries reported:
- Polish: 1,214 (26.6%)
- Italian: 520 (11.4%)
- English: 487 (10.7%)
- American: 228 (5.0%)
- Irish: 228 (5.0%)
- German: 135 (3.0%)
- French: 123 (2.7%)
- French Canadian: 117 (2.6%)
- Swedish: 70 (1.5%)
- Slovene: 56 (1.2%)
- European: 46 (1.0%)
- Canadian: 29 (0.6%)
- Russian: 26 (0.6%)
- Scottish: 21 (0.5%)
- Brazilian: 20 (0.4%)
- Lithuanian: 18 (0.4%)
- Danish: 14 (0.3%)
- Armenian: 13 (0.3%)
- Assyrian: 13 (0.3%)
- Romanian: 11 (0.2%)
- Slovak: 10 (0.2%)
- Northern European: 9 (0.2%)
- Hungarian: 4 (0.09%)
Most common places of birth for foreign-born residents (%):
| Kensington: | 28.1% (246) |
| Connecticut: | 4.0% (21,729) |
| Kensington: | 12.0% (105) |
| Connecticut: | 4.4% (24,001) |
| Kensington: | 10.4% (91) |
| Connecticut: | 1.9% (10,545) |
| Kensington: | 8.2% (72) |
| Connecticut: | 0.3% (1,499) |
| Kensington: | 6.5% (57) |
| Connecticut: | 2.8% (15,141) |
| Kensington: | 6.2% (54) |
| Connecticut: | 7.3% (39,879) |
| Kensington: | 4.6% (40) |
| Connecticut: | 0.0% (259) |
| Kensington: | 4.4% (39) |
| Connecticut: | 2.3% (12,380) |
| Kensington: | 4.2% (37) |
| Connecticut: | 1.3% (7,149) |
| Kensington: | 2.3% (20) |
| Connecticut: | 1.2% (6,448) |
| Kensington: | 2.1% (18) |
| Connecticut: | 4.7% (25,461) |
Place of birth for U.S.-born residents:
- This state: 7,251
- Other state: 1,254
- Northeast: 820
- Midwest: 196
- South: 51
- West: 200
93.8% of Kensington residents lived in the same house 1 years ago.
Out of people who lived in different houses, 37.5% lived in this county.
Out of people who lived in different counties, 72.9% lived in Connecticut.
| Kensington: | 93.8% |
| State average: | 88.4% |
Education attainment for males 25 years and older:
- No schooling: 77
- Nursery to 4th grade: 0
- 5th and 6th grade: 0
- 7th and 8th grade: 14
- 9th grade: 7
- 10th grade: 5
- 11th grade: 76
- 12th grade, no diploma: 14
- High school graduate (or equivalency): 907
- Less than 1 year of college: 238
- Some college more than 1 year, no degree: 245
- Associate degree: 313
- Bachelor's degree: 1,094
- Master's degree: 322
- Professional school degree: 236
- Doctorate degree: 6

Education attainment for females 25 years and older:
- No schooling: 94
- Nursery to 4th grade: 0
- 5th and 6th grade: 25
- 7th and 8th grade: 9
- 9th grade: 70
- 10th grade: 39
- 11th grade: 12
- 12th grade, no diploma: 0
- High school graduate (or equivalency): 953
- Less than 1 year of college: 361
- Some college more than 1 year, no degree: 413
- Associate degree: 328
- Bachelor's degree: 747
- Master's degree: 642
- Professional school degree: 26
- Doctorate degree: 37


Housing units in structures:
- One, detached: 3,359
- One, attached: 35
- Two: 734
- 3 or 4: 32
- 5 to 9: 71
- 10 to 19: 14
- 20 to 49: 67
- 50 or more: 114
House/condo owner moved in on average 17 years ago
Renter moved in on average 3 years ago

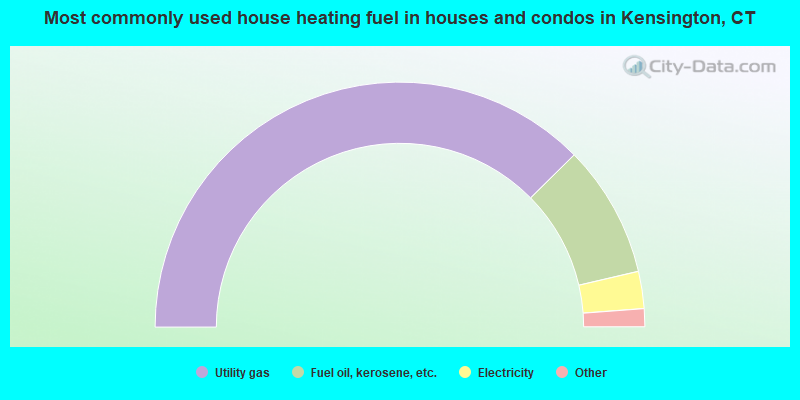
- 75.2%Utility gas
- 17.5%Fuel oil, kerosene, etc.
- 4.9%Electricity
- 1.0%Wood
- 1.0%Bottled, tank, or LP gas
- 0.3%Other fuel
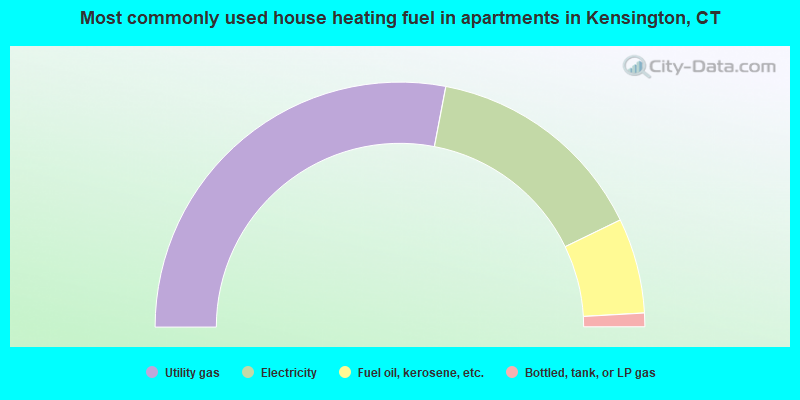
- 56.0%Utility gas
- 29.6%Electricity
- 12.6%Fuel oil, kerosene, etc.
- 1.8%Bottled, tank, or LP gas
Private vs. public school enrollment:
| Here: | 0.0% |
| Connecticut: | 9.5% |
| Here: | 2.8% |
| Connecticut: | 12.9% |
| Here: | 47.7% |
| Connecticut: | 35.5% |


