Kent, WA (Washington) Houses and Residents
Estimated median house or condo value in 2022: $561,400 (it was $168,100 in 2000 )
Kent:
$561,400Washington:
$569,500
Lower value quartile - upper value quartile: $403,100 - $701,800Mean price in 2022: Detached houses: $648,462 Here:
$648,462State:
$734,307
Townhouses or other attached units: $468,383 Here:
$468,383State:
$657,697
In 3-to-4-unit structures: $298,232 Here:
$298,232State:
$510,239
In 5-or-more-unit structures: $271,794 Here:
$271,794State:
$503,183
Mobile homes: $95,088 Here:
$95,088State:
$218,362
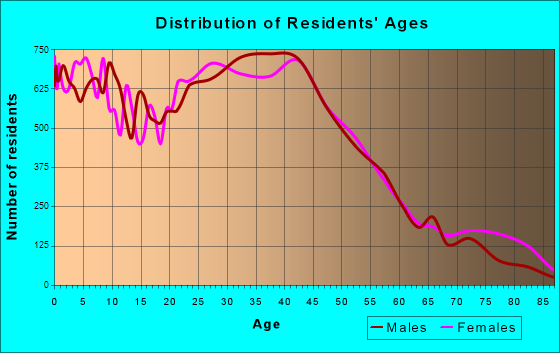
Total population: 125,560 (Urban population: 79,005, Rural population: 320 (all nonfarm) )
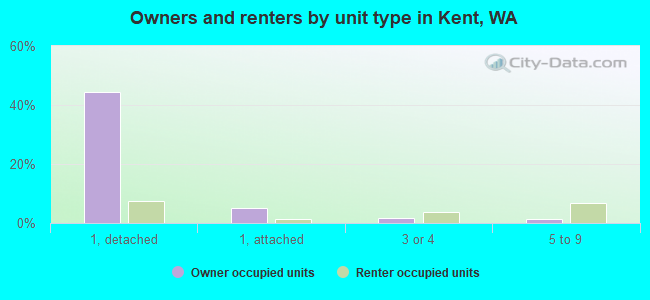
Houses: 49,410 (46,661 occupied: 26,228 owner occupied, 20,433 renter occupied )
% of renters here:
44%State:
36%
Housing density: 1,763 houses/condos per square mile
Median price asked for vacant for-sale houses and condos in 2022: $348,520.
Median contract rent in 2022: $1,510 (lower quartile is $1,264, upper quartile is $1,819)
Median rent asked for vacant for-rent units in 2022: $1,385
Median gross rent in Kent, WA in 2022: $1,703
Housing units in Kent with a mortgage: 17,381 (1,991 second mortgage, 369 home equity loan, 1,545 both second mortgage and home equity loan )Houses without a mortgage: 571
Median household income for houses/condos with a mortgage: $119,702
Median household income for apartments without a mortgage: $89,759
Median monthly housing costs: $1,704
Data:
Median house or condo value ($)
Median house or condo value ($ change since 2000)
Median house or condo value ($) - White
Median house or condo value ($) - Black or African American
Median house or condo value ($) - Asian
Median house or condo value ($) - Hispanic or Latino
Median house or condo value ($) - American Indian and Alaska Native
Median house or condo value ($) - Multirace
Median house or condo value ($) - Other Race
Median price asked for mobile homes ($)
Household density (households per square mile)
Mean house or condo value by units in structure - 1, detached ($)
Mean house or condo value by units in structure - 1, attached ($)
Mean house or condo value by units in structure - 2 ($)
Mean house or condo value by units in structure by units in structure - 3 or 4 ($)
Mean house or condo value by units in structure - 5 or more ($)
Mean house or condo value by units in structure - Boat, RV, van, etc. ($)
Mean house or condo value by units in structure - Mobile home ($)
Median contract rent ($)
Median contract rent - Lower quartile ($)
Median contract rent - Upper quartile ($)
Median gross rent ($)
Urban houses (%)
Rural houses (%)
Houses occupied (%)
Houses occupied (% change since 2000)
Houses owner occupied (%)
Houses owner occupied (% change since 2000)
Houses renter occupied (%)
Houses renter occupied (% change since 2000)
Vacant housing units - For rent (%)
Vacant housing units - For rent (% change since 2000)
Vacant housing units - For sale only (%)
Vacant housing units - For sale only (% change since 2000)
Vacant housing units - Rented or sold, not occupied (%)
Vacant housing units - Rented or sold, not occupied (% change since 2000)
Vacant housing units - For seasonal, recreational, or occasional use (%)
Vacant housing units - For seasonal, recreational, or occasional use (% change since 2000)
Vacant housing units - For migrant workers (%)
Vacant housing units - For migrant workers (% change since 2000)
Vacant housing units - Other vacant (%)
Vacant housing units - Other vacant (% change since 2000)
Median monthly housing costs ($)
Median household income for houses/condos with a mortgage ($)
Median household income for houses/condos without a mortgage ($)
Median household income ($)
Median household income ($) - White
Median household income ($) - Black or African American
Median household income ($) - Asian
Median household income ($) - Hispanic or Latino
Median household income ($) - American Indian and Alaska Native
Median household income ($) - Multirace
Median household income ($) - Other Race
Mortgage status - with mortgage (%)
Mortgage status - with second mortgage (%)
Mortgage status - with home equity loan (%)
Mortgage status - with both second mortgage and home equity loan (%)
Mortgage status - without a mortgage (%)
Median year house/condo built
Median year apartment built
Household type by relationship - Male householder living alone (%)
Household type by relationship - Male householder not living alone (%)
Household type by relationship - Female householder living alone (%)
Household type by relationship - Female householder not living alone (%)
Household type by relationship - Opposite-Sex spouse (%)
Household type by relationship - Same-Sex spouse (%)
Household type by relationship - Opposite-Sex unmarried partner (%)
Household type by relationship - Same-Sex unmarried partner (%)
Household type by relationship - In group quarters (%)
Size of family households - 2-person household (%)
Size of family households - 3-person household (%)
Size of family households - 4-person household (%)
Size of family households - 5-person household (%)
Size of family households - 6-person household (%)
Size of family households - 7-or-more-person household (%)
Size of nonfamily households - 1-person household (%)
Size of nonfamily households - 2-person household (%)
Size of nonfamily households - 3-person household (%)
Size of nonfamily households - 4-person household (%)
Size of nonfamily households - 5-person household (%)
Size of nonfamily households - 6-person household (%)
Size of nonfamily households - 7-or-moreperson household (%)
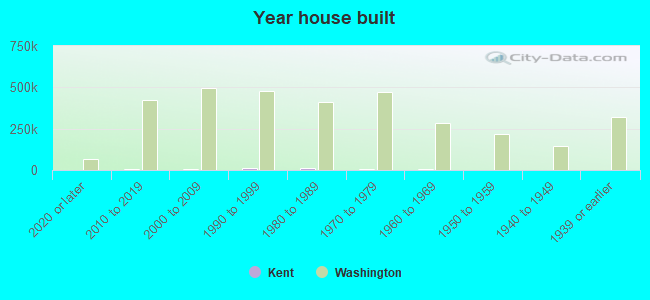
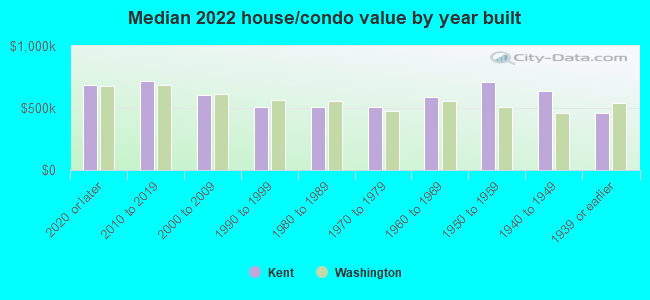
Year house built - Built 2010 or later (%)
Year house built - Built 2000 to 2009 (%)
Year house built - Built 1990 to 1999 (%)
Year house built - Built 1980 to 1989 (%)
Year house built - Built 1970 to 1979 (%)
Year house built - Built 1960 to 1969 (%)
Year house built - Built 1950 to 1959 (%)
Year house built - Built 1940 to 1949 (%)
Year house built - Built 1939 or earlier (%)
Median number of rooms in houses and condos
Median number of rooms in apartments
Median number of bedrooms in owner occupied houses
Mean number of bedrooms in owner occupied houses
Median number of bedrooms in renter occupied houses
Mean number of bedrooms in renter occupied houses
Median number of vehichles in owner occupied houses
Mean number of vehichles in owner occupied houses
Median number of vehichles in renter occupied houses
Mean number of vehichles in renter occupied houses
Rooms in owner-occupied houses - 1 room (%)
Rooms in owner-occupied houses - 2 rooms (%)
Rooms in owner-occupied houses - 3 rooms (%)
Rooms in owner-occupied houses - 4 rooms (%)
Rooms in owner-occupied houses - 5 rooms (%)
Rooms in owner-occupied houses - 6 rooms (%)
Rooms in owner-occupied houses - 7 rooms (%)
Rooms in owner-occupied houses - 8 rooms (%)
Rooms in owner-occupied houses - 9+ rooms (%)
Rooms in renter-occupied houses - 1 room (%)
Rooms in renter-occupied houses - 2 rooms (%)
Rooms in renter-occupied houses - 3 rooms (%)
Rooms in renter-occupied houses - 4 rooms (%)
Rooms in renter-occupied houses - 5 rooms (%)
Rooms in renter-occupied houses - 6 rooms (%)
Rooms in renter-occupied houses - 7 rooms (%)
Rooms in renter-occupied houses - 8 rooms (%)
Rooms in renter-occupied houses - 9+ rooms (%)
Bedrooms in owner-occupied houses - no bedrooms (%)
Bedrooms in owner-occupied houses - 1 bedroom (%)
Bedrooms in owner-occupied houses - 2 bedrooms (%)
Bedrooms in owner-occupied houses - 3 bedrooms (%)
Bedrooms in owner-occupied houses - 4 bedrooms (%)
Bedrooms in owner-occupied houses - 5+ bedrooms (%)
Bedrooms in renter-occupied houses - no bedrooms (%)
Bedrooms in renter-occupied houses - 1 bedroom (%)
Bedrooms in renter-occupied houses - 2 bedrooms (%)
Bedrooms in renter-occupied houses - 3 bedrooms (%)
Bedrooms in renter-occupied houses - 4 bedrooms (%)
Bedrooms in renter-occupied houses - 5+ bedrooms (%)
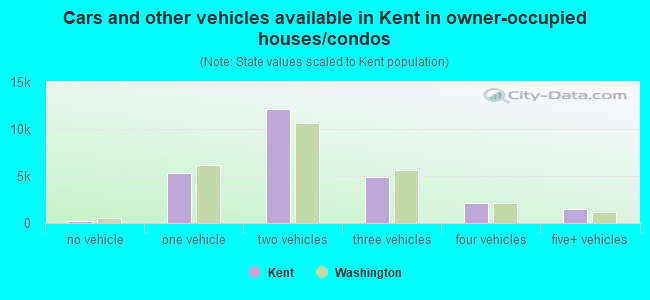
Vehicles available in owner-occupied houses - no vehicle available (%)
Vehicles available in owner-occupied houses - 1 vehicle available(%)
Vehicles available in owner-occupied houses - 2 Vehicles available (%)
Vehicles available in owner-occupied houses - 3 Vehicles available (%)
Vehicles available in owner-occupied houses - 4 Vehicles available (%)
Vehicles available in owner-occupied houses - 5+ Vehicles available (%)
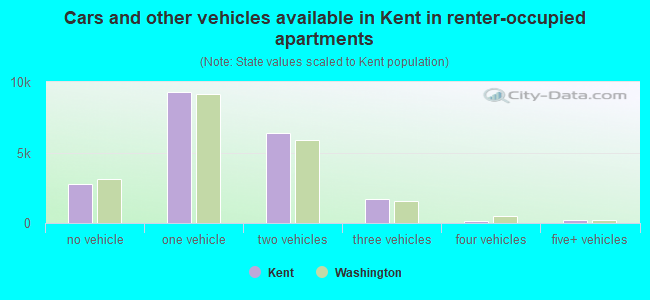
Vehicles available in renter-occupied houses - no vehicle available (%)
Vehicles available in renter-occupied houses - 1 vehicle available (%)
Vehicles available in renter-occupied houses - 2 Vehicles available (%)
Vehicles available in renter-occupied houses - 3 Vehicles available (%)
Vehicles available in renter-occupied houses - 4 Vehicles available (%)
Vehicles available in renter-occupied houses - 5+ Vehicles available (%)
Housing units in structures - 1, detached (%)
Housing units in structures - 1, attached (%)
Housing units in structures - 2 (%)
Housing units in structures - 3 or 4 (%)
Housing units in structures - 5 to 9 (%)
Housing units in structures - 10 to 19 (%)
Housing units in structures - 20 to 49 (%)
Housing units in structures - 50 or more (%)
Housing units in structures - Mobile home (%)
Housing units in structures - Boat, RV, van, etc. (%)
Housing units in structures - Owners - 1, detached (%)
Housing units in structures - Owners - 1, attached (%)
Housing units in structures - Owners - 2 (%)
Housing units in structures - Owners - 3 or 4 (%)
Housing units in structures - Owners - 5 to 9 (%)
Housing units in structures - Owners - 10 to 19 (%)
Housing units in structures - Owners - 20 to 49 (%)
Housing units in structures - Owners - 50 or more (%)
Housing units in structures - Owners - Mobile home (%)
Housing units in structures - Owners - Boat, RV, van, etc. (%)
Housing units in structures - Renters - 1, detached (%)
Housing units in structures - Renters - 1, attached (%)
Housing units in structures - Renters - 2 (%)
Housing units in structures - Renters - 3 or 4 (%)
Housing units in structures - Renters - 5 to 9 (%)
Housing units in structures - Renters - 10 to 19 (%)
Housing units in structures - Renters - 20 to 49 (%)
Housing units in structures - Renters - 50 or more (%)
Housing units in structures - Renters - Mobile home (%)
Housing units in structures - Renters - Boat, RV, van, etc. (%)
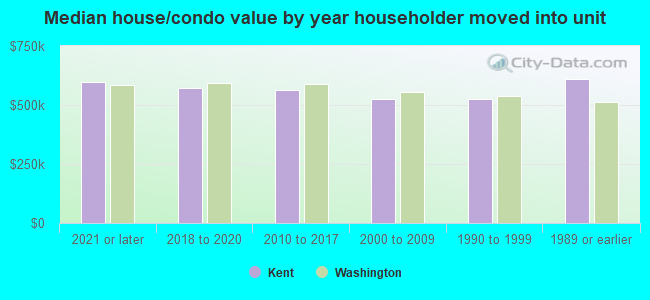
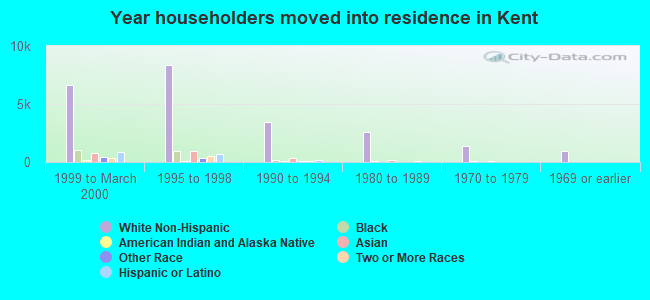
House/condo owner moved in on average (years ago)
Renter moved in on average (years ago)
Year householder moved into unit - Moved in 1999 to March 2000 (%)
Year householder moved into unit - Moved in 1999 to March 2000 (%) - White
Year householder moved into unit - Moved in 1999 to March 2000 (%) - Black or African American
Year householder moved into unit - Moved in 1999 to March 2000 (%) - Asian
Year householder moved into unit - Moved in 1999 to March 2000 (%) - Hispanic or Latino
Year householder moved into unit - Moved in 1999 to March 2000 (%) - American Indian and Alaska Native
Year householder moved into unit - Moved in 1999 to March 2000 (%) - Multirace
Year householder moved into unit - Moved in 1999 to March 2000 (%) - Other Race
Year householder moved into unit - Moved in 1995 to 1998 (%)
Year householder moved into unit - Moved in 1995 to 1998 (%) - White
Year householder moved into unit - Moved in 1995 to 1998 (%) - Black or African American
Year householder moved into unit - Moved in 1995 to 1998 (%) - Asian
Year householder moved into unit - Moved in 1995 to 1998 (%) - Hispanic or Latino
Year householder moved into unit - Moved in 1995 to 1998 (%) - American Indian and Alaska Native
Year householder moved into unit - Moved in 1995 to 1998 (%) - Multirace
Year householder moved into unit - Moved in 1995 to 1998 (%) - Other Race
Year householder moved into unit - Moved in 1990 to 1994 (%)
Year householder moved into unit - Moved in 1990 to 1994 (%) - White
Year householder moved into unit - Moved in 1990 to 1994 (%) - Black or African American
Year householder moved into unit - Moved in 1990 to 1994 (%) - Asian
Year householder moved into unit - Moved in 1990 to 1994 (%) - Hispanic or Latino
Year householder moved into unit - Moved in 1990 to 1994 (%) - American Indian and Alaska Native
Year householder moved into unit - Moved in 1990 to 1994 (%) - Multirace
Year householder moved into unit - Moved in 1990 to 1994 (%) - Other Race
Year householder moved into unit - Moved in 1980 to 1989 (%)
Year householder moved into unit - Moved in 1980 to 1989 (%) - White
Year householder moved into unit - Moved in 1980 to 1989 (%) - Black or African American
Year householder moved into unit - Moved in 1980 to 1989 (%) - Asian
Year householder moved into unit - Moved in 1980 to 1989 (%) - Hispanic or Latino
Year householder moved into unit - Moved in 1980 to 1989 (%) - American Indian and Alaska Native
Year householder moved into unit - Moved in 1980 to 1989 (%) - Multirace
Year householder moved into unit - Moved in 1980 to 1989 (%) - Other Race
Year householder moved into unit - Moved in 1970 to 1979 (%)
Year householder moved into unit - Moved in 1970 to 1979 (%) - White
Year householder moved into unit - Moved in 1970 to 1979 (%) - Black or African American
Year householder moved into unit - Moved in 1970 to 1979 (%) - Asian
Year householder moved into unit - Moved in 1970 to 1979 (%) - Hispanic or Latino
Year householder moved into unit - Moved in 1970 to 1979 (%) - American Indian and Alaska Native
Year householder moved into unit - Moved in 1970 to 1979 (%) - Multirace
Year householder moved into unit - Moved in 1970 to 1979 (%) - Other Race
Year householder moved into unit - Moved in 1969 or earlier (%)
Year householder moved into unit - Moved in 1969 or earlier (%) - White
Year householder moved into unit - Moved in 1969 or earlier (%) - Black or African American
Year householder moved into unit - Moved in 1969 or earlier (%) - Asian
Year householder moved into unit - Moved in 1969 or earlier (%) - Hispanic or Latino
Year householder moved into unit - Moved in 1969 or earlier (%) - American Indian and Alaska Native
Year householder moved into unit - Moved in 1969 or earlier (%) - Multirace
Year householder moved into unit - Moved in 1969 or earlier (%) - Other Race
Housing units lacking complete plumbing facilities (%)
Housing units lacking complete kitchen facilities (%)
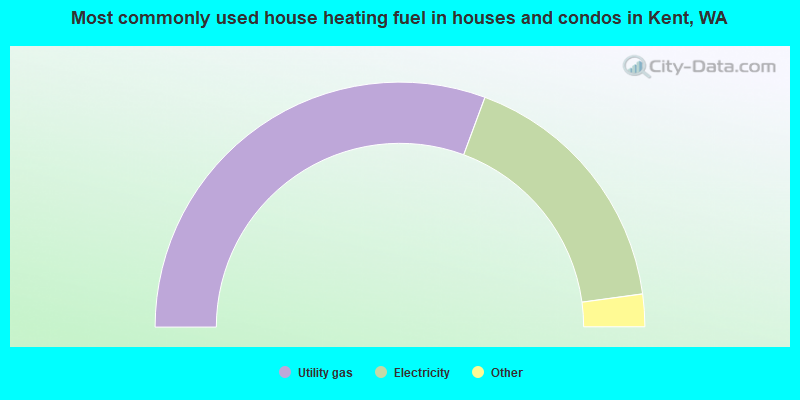
House heating fuel used in houses and condos - Utility gas (%)
House heating fuel used in houses and condos - Bottled, tank, or LP gas (%)
House heating fuel used in houses and condos - Electricity (%)
House heating fuel used in houses and condos - Fuel oil, kerosene, etc. (%)
House heating fuel used in houses and condos - Coal or coke (%)
House heating fuel used in houses and condos - Wood (%)
House heating fuel used in houses and condos - Solar energy (%)
House heating fuel used in houses and condos - Other fuel (%)
House heating fuel used in houses and condos - No fuel used (%)
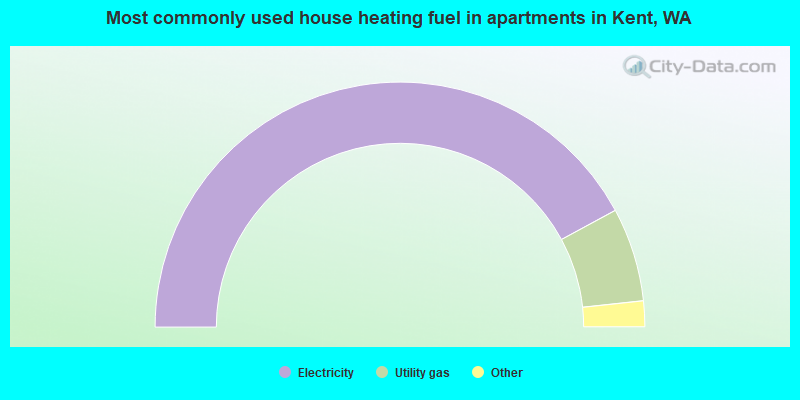
House heating fuel used in apartments - Utility gas (%)
House heating fuel used in apartments - Bottled, tank, or LP gas (%)
House heating fuel used in apartments - Electricity (%)
House heating fuel used in apartments - Fuel oil, kerosene, etc. (%)
House heating fuel used in apartments - Coal or coke (%)
House heating fuel used in apartments - Wood (%)
House heating fuel used in apartments - Solar energy (%)
House heating fuel used in apartments - Other fuel (%)
House heating fuel used in apartments - No fuel used (%)
Latest news about housing in Kent, WA collected exclusively by city-data.com from local newspapers, TV, and radio stations
Median year house/condo built: 1985Median year apartment built: 1986Household type by relationship:
Households: 134,400
Male householders: 22,831 (4,790 living alone ), Female householders: 23,830 (6,297 living alone )21,641 spouses (21,246 opposite-sex spouses ), 4,060 unmarried partners , (4,003 opposite-sex unmarried partners ), 40,874 children (38,190 natural , 670 adopted , 2,014 stepchildren ), 2,673 grandchildren , 3,634 brothers or sisters , 3,870 parents , 364 foster children , 3,346 other relatives , 5,699 non-relatives In group quarters: 1,578
Size of family households: 11,144 2-persons , 8,040 3-persons , 5,039 4-persons , 4,003 5-persons , 1,449 6-persons , 1,292 7-or-more-persons .
Size of nonfamily households: 11,087 1-person , 3,766 2-persons , 483 3-persons , 300 4-persons , 58 5-persons .
16,094 married couples with children. single-parent households (2,011 men , 7,090 women ).
56.8% of residents of Kent speak English at home. of residents speak Spanish at home (58% speak English very well , 20% speak English well , 20% speak English not well , 2% don't speak English at all ).of residents speak other Indo-European language at home (45% speak English very well , 30% speak English well , 24% speak English not well , 1% don't speak English at all ).of residents speak Asian or Pacific Island language at home (46% speak English very well , 26% speak English well , 24% speak English not well , 5% don't speak English at all ).of residents speak other language at home (67% speak English very well , 26% speak English well , 7% speak English not well ).
Foreign born population: 42,810 (31.9%)of them are naturalized citizens )
Median number of rooms in houses and condos:
Median number of rooms in apartments
Owner-occupied Renter-occupied
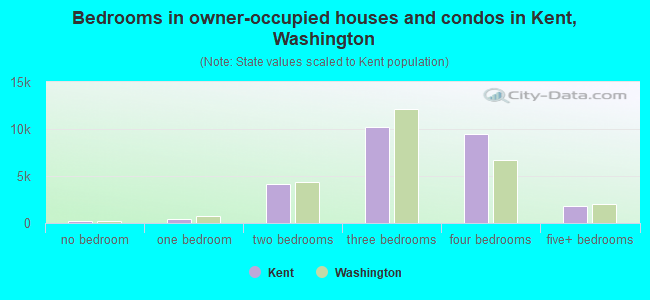
Bedrooms in owner-occupied houses and condos in Kent, Washington
181 no bedroom 475 1 bedroom 4,096 2 bedrooms 10,244 3 bedrooms 9,421 4 bedrooms 1,811 5+ bedrooms
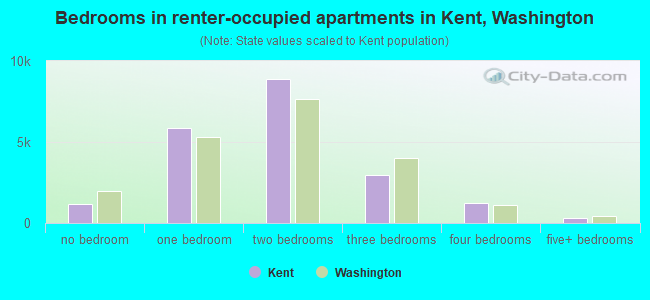
Bedrooms in renter-occupied apartments in Kent, Washington
1,194 no bedroom 5,868 1 bedroom 8,864 2 bedrooms 2,959 3 bedrooms 1,258 4 bedrooms 290 5+ bedrooms
Owner-occupied Renter-occupied
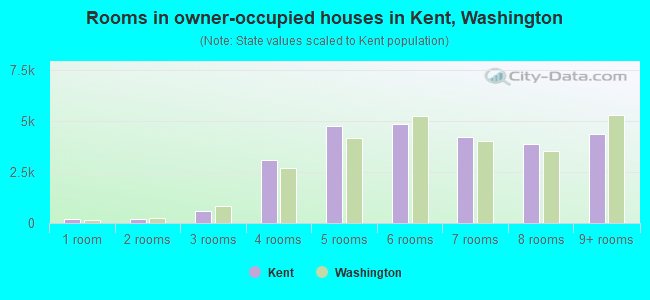
Rooms in owner-occupied houses in Kent, Washington
181 1 room 183 2 rooms 602 3 rooms 3,104 4 rooms 4,787 5 rooms 4,869 6 rooms 4,221 7 rooms 3,882 8 rooms 4,399 9+ rooms
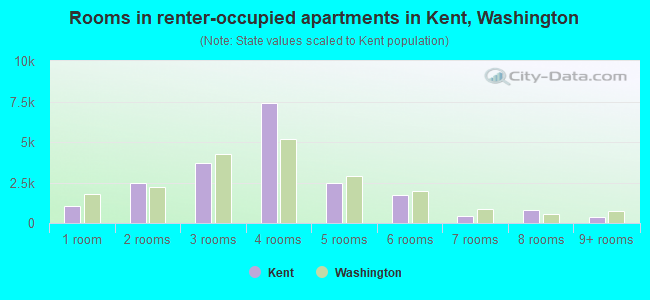
Rooms in renter-occupied apartments in Kent, Washington
1,063 1 room 2,451 2 rooms 3,711 3 rooms 7,382 4 rooms 2,481 5 rooms 1,740 6 rooms 433 7 rooms 776 8 rooms 396 9+ rooms
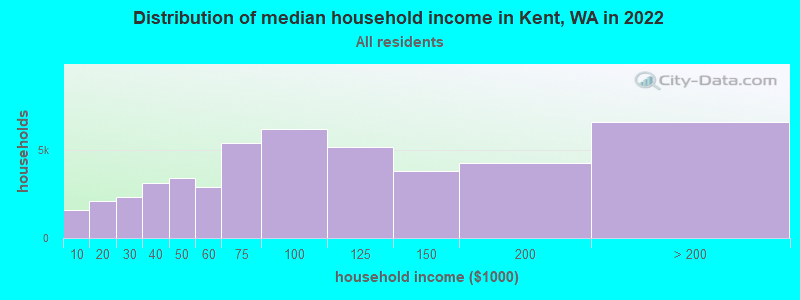
Kent, WA household income distribution 1,607 Less than $10,0002,093 $10,000 to $19,9992,323 $20,000 to $29,9993,134 $30,000 to $39,9993,409 $40,000 to $49,9992,861 $50,000 to $59,9995,348 $60,000 to $74,9996,154 $75,000 to $99,9995,137 $100,000 to $124,9993,791 $125,000 to $149,9994,244 $150,000 to $199,9996,560 $200,000 or more
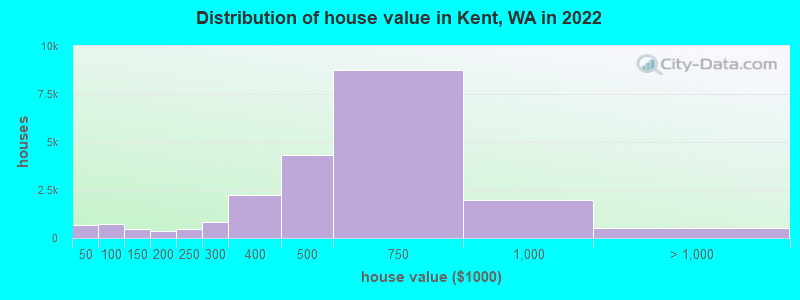
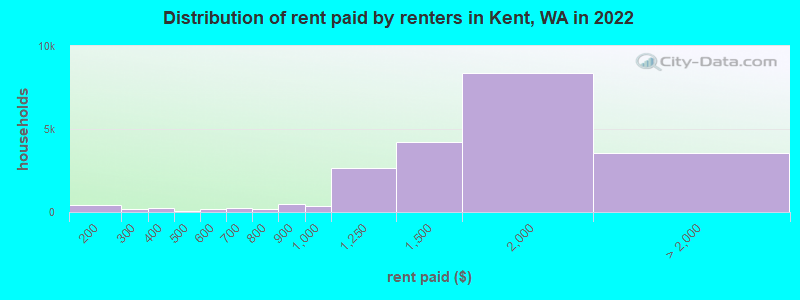
Home value of owner - occupied houses in 2022 in Kent, WA 218 Less than $10,00023 $10,000 to $14,999137 $15,000 to $19,99950 $20,000 to $24,9994 $25,000 to $29,999157 $30,000 to $34,99914 $35,000 to $39,99948 $40,000 to $49,999252 $50,000 to $59,999151 $60,000 to $69,999137 $70,000 to $79,99988 $80,000 to $89,99961 $90,000 to $99,999381 $100,000 to $124,999108 $125,000 to $149,999239 $150,000 to $174,999100 $175,000 to $199,999455 $200,000 to $249,999821 $250,000 to $299,9992,254 $300,000 to $399,9994,299 $400,000 to $499,9998,731 $500,000 to $749,9992,005 $750,000 to $999,999277 $1,000,000 to $1,499,99975 $1,500,000 to $1,999,999184 $2,000,000 or moreRent paid by renters in 2022 in Kent, WA 59 Less than $100265 $100 to $149176 $150 to $19986 $200 to $249113 $250 to $299124 $300 to $349123 $350 to $39944 $400 to $44932 $450 to $499125 $500 to $54983 $550 to $599192 $600 to $64919 $650 to $69995 $700 to $74976 $750 to $799483 $800 to $899356 $900 to $9992,625 $1,000 to $1,2494,232 $1,250 to $1,4998,367 $1,500 to $1,9992,144 $2,000 to $2,499825 $2,500 to $2,999206 $3,000 to $3,499121 $3,500 or more277 No cash rent
Percentage of workers working in this county: 94.8%Number of people working at home: 8,828 (12.9% of all workers )
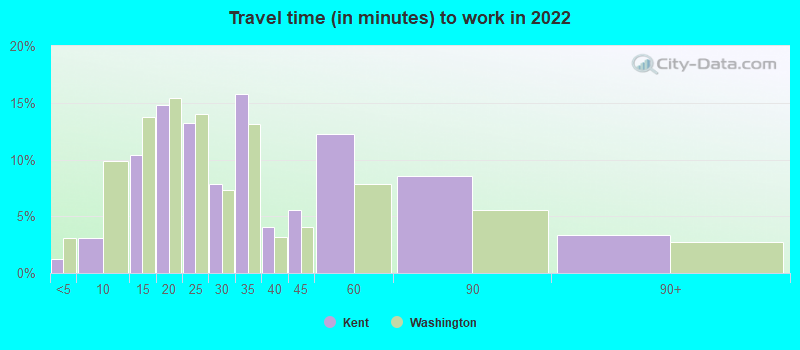
Travel time to work (commute)
Less than 5 minutes: 8065 to 9 minutes: 3,26010 to 14 minutes: 6,91515 to 19 minutes: 8,85620 to 24 minutes: 8,02425 to 29 minutes: 4,29430 to 34 minutes: 9,98635 to 39 minutes: 1,20840 to 44 minutes: 3,55245 to 59 minutes: 5,68060 to 89 minutes: 5,51990 or more minutes: 1,547
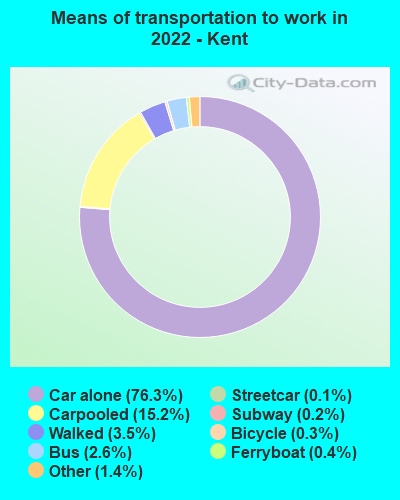
Means of transportation to work:
Drove a car alone: 46,358 (66.6%)Carpooled: 9,203 (13.2%)Bus : 1,549 (2.2%)Subway or elevated rail : 86 (0.1%)Long-distance train or commuter rail : 107 (0.2%)Light rail, streetcar or trolley : 46 (0.1%)Ferryboat: 215 (0.3%)Taxi: 826 (1.2%)Bicycle: 187 (0.3%)Walked: 2,151 (3.1%)Worked at home: 8,828 (12.7%)
Unemployment by race in 2022
Unemployment rate for White non-Hispanic residents 7.8% Males5.8% FemalesUnemployment rate for Black residents 7.0% Males6.6% FemalesUnemployment rate for American Indian and Alaska Native residents 2.2% MalesUnemployment rate for Asian residents 1.9% Males1.6% FemalesUnemployment rate for other race residents 3.1% Males8.1% FemalesUnemployment rate for two or more race residents 9.3% Males11.6% FemalesUnemployment rate for Hispanic or Latino residents 7.3% Females
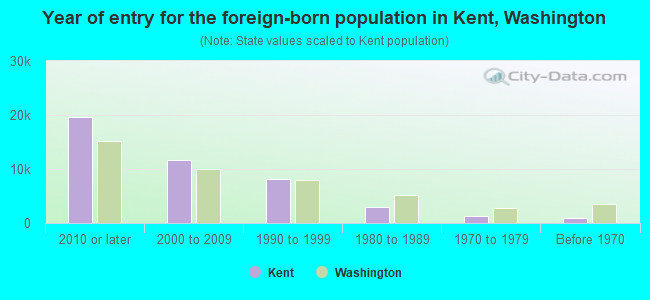
Year of entry for the foreign-born population in Kent, Washington
19,547 2010 or later 11,643 2000 to 2009 8,191 1990 to 1999 2,994 1980 to 1989 1,287 1970 to 1979 929 Before 1970
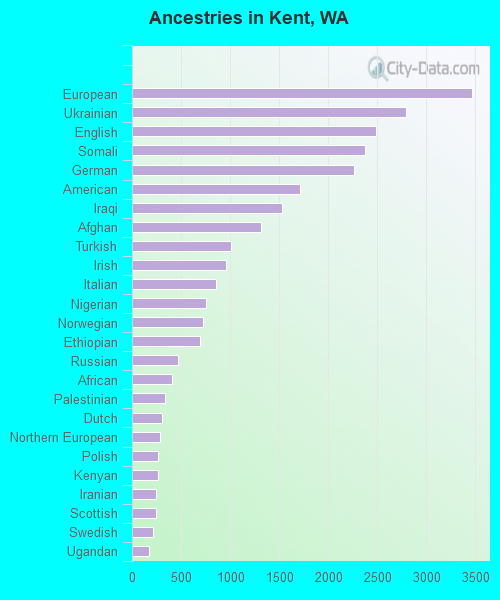
First ancestries reported:
European: 3,469 (4.6%)
Ukrainian: 2,799 (3.7%)
English: 2,486 (3.3%)
Somali: 2,380 (3.1%)
German: 2,269 (3.0%)
American: 1,709 (2.3%)
Iraqi: 1,530 (2.0%)
Afghan: 1,312 (1.7%)
Turkish: 1,006 (1.3%)
Irish: 954 (1.3%)
Italian: 862 (1.1%)
Nigerian: 750 (1.0%)
Norwegian: 727 (1.0%)
Ethiopian: 695 (0.9%)
Russian: 471 (0.6%)
African: 412 (0.5%)
Palestinian: 340 (0.4%)
Dutch: 304 (0.4%)
Northern European: 286 (0.4%)
Polish: 267 (0.4%)
Kenyan: 261 (0.3%)
Iranian: 246 (0.3%)
Scottish: 240 (0.3%)
Swedish: 218 (0.3%)
Ugandan: 176 (0.2%)
Ghanaian: 154 (0.2%)
Haitian: 143 (0.2%)
British: 141 (0.2%)
Scotch-Irish: 118 (0.2%)
Yugoslavian: 112 (0.1%)
French: 111 (0.1%)
Welsh: 102 (0.1%)
Scandinavian: 99 (0.1%)
French Canadian: 88 (0.1%)
Bulgarian: 79 (0.1%)
Lebanese: 79 (0.1%)
Canadian: 74 (0.10%)
Czech: 68 (0.09%)
Danish: 67 (0.09%)
Romanian: 66 (0.09%)
Arab: 59 (0.08%)
Egyptian: 55 (0.07%)
Finnish: 51 (0.07%)
Jamaican: 50 (0.07%)
Portuguese: 36 (0.05%)
Liberian: 36 (0.05%)
Slovak: 35 (0.05%)
Senegalese: 31 (0.04%)
Icelander: 28 (0.04%)
Pennsylvania German: 26 (0.03%)
Swiss: 26 (0.03%)
Armenian: 25 (0.03%)
Hungarian: 24 (0.03%)
Eastern European: 21 (0.03%)
Brazilian: 21 (0.03%)
Jordanian: 20 (0.03%)
Austrian: 17 (0.02%)
Sudanese: 16 (0.02%)
Slavic: 10 (0.01%)
Guyanese: 9 (0.01%)
Australian: 9 (0.01%)
West Indian: 9 (0.01%)
Syrian: 7 (0.01%)
Belgian: 6 (0.01%)
Croatian: 5 (0.01%)
Most common places of birth for foreign-born residents (%): Mexico Kent:
14.1% (6,410)Washington:
21.1% (241,655)
India Kent:
10.5% (4,768)Washington:
8.9% (101,353)
Philippines Kent:
10.1% (4,592)Washington:
6.3% (71,661)
Vietnam Kent:
9.1% (4,164)Washington:
5.4% (62,003)
Ukraine Kent:
5.4% (2,481)Washington:
3.1% (35,872)
China, excluding Hong Kong and Taiwan Kent:
4.5% (2,055)Washington:
7.4% (84,470)
Iraq Kent:
3.6% (1,657)Washington:
0.5% (6,259)
Afghanistan Kent:
3.3% (1,527)Washington:
0.5% (5,851)
Burma (Myanmar) Kent:
2.6% (1,169)Washington:
0.3% (3,171)
Other Western Africa Kent:
2.2% (1,025)Washington:
0.3% (3,638)
Somalia Kent:
2.0% (900)Washington:
0.7% (8,540)
Thailand Kent:
2.0% (892)Washington:
0.9% (9,937)
Ethiopia Kent:
1.8% (811)Washington:
1.6% (17,938)
Kenya Kent:
1.8% (801)Washington:
1.1% (12,735)
Guatemala Kent:
1.7% (757)Washington:
1.2% (13,855)
Place of birth for U.S.-born residents:
This state: 55,872Other state: 32,474Northeast: 3,299Midwest: 5,781South: 5,672West: 17,722 86.2% of Kent residents lived in the same house 1 years ago.
Out of people who lived in different houses, 42.4% lived in this county.
Out of people who lived in different counties, 45.5% lived in Washington.
Kent:
86.2%State average:
85.2%
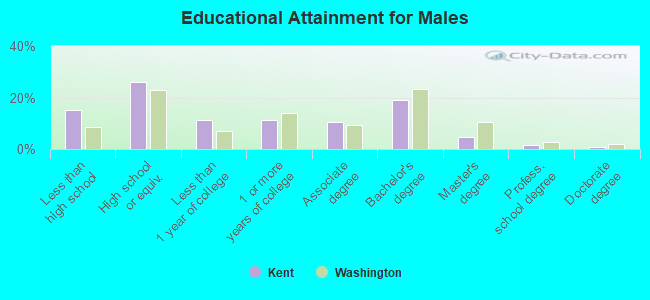
Education attainment for males 25 years and older:
No schooling: 2,046Nursery to 4th grade: 855th and 6th grade: 6607th and 8th grade: 1509th grade: 81410th grade: 15911th grade: 56712th grade, no diploma: 2,204High school graduate (or equivalency): 11,529Less than 1 year of college: 4,981Some college more than 1 year, no degree: 5,091Associate degree: 4,733Bachelor's degree: 8,474Master's degree: 1,989Professional school degree: 711Doctorate degree: 331
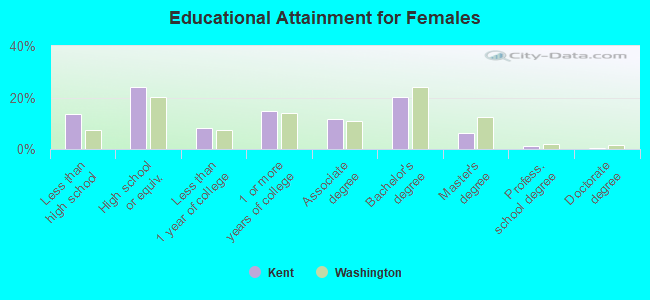
Education attainment for females 25 years and older:
No schooling: 1,688Nursery to 4th grade: 1945th and 6th grade: 9967th and 8th grade: 5959th grade: 47810th grade: 44611th grade: 39112th grade, no diploma: 1,387High school graduate (or equivalency): 11,032Less than 1 year of college: 3,769Some college more than 1 year, no degree: 6,803Associate degree: 5,409Bachelor's degree: 9,174Master's degree: 2,855Professional school degree: 513Doctorate degree: 98
Housing units in structures:
One, detached: 22,964One, attached: 3,833Two: 4633 or 4: 1,6625 to 9: 5,01610 to 19: 5,75420 to 49: 1,51550 or more: 6,097Mobile homes: 2,028Boats, RVs, vans, etc.: 78Median worth of mobile homes: $85,100
Housing units lacking complete plumbing facilities in 2022: 0.7%Housing units lacking complete kitchen facilities in 2022: 1.2%House/condo owner moved in on average 12 years ago
Renter moved in on average 2 years ago
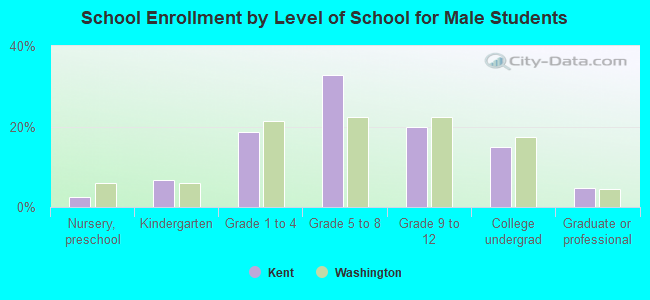
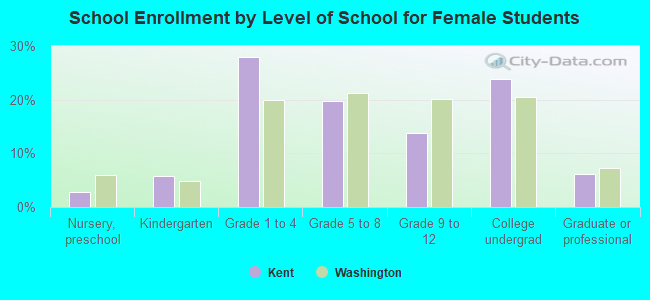
Private vs. public school enrollment:
Students in private schools in grades 1 to 8 (elementary and middle school): 647 Here:
4.4%Washington:
12.4%
Students in private schools in grades 9 to 12 (high school): 127 Students in private undergraduate colleges: 342 Here:
5.8%Washington:
16.5%