Kildeer, IL (Illinois) Houses and Residents
| Kildeer: | $714,640 |
| Illinois: | $251,600 |
Mean price in 2022:
Detached houses: $748,067
Here: $748,067 State: $310,164
Total population: 3,958 (Urban population: 3,574, Rural population: 0)
Houses: 1,389 (1,345 occupied: 1,356 owner occupied, 14 renter occupied)
| % of renters here: | 1% |
| State: | 33% |
Housing density: 400 houses/condos per square mile
Median price asked for vacant for-sale houses and condos in 2022 in this county: $314,142.
Median gross rent in Kildeer, IL in 2022: $-674,867,341
Housing units in Kildeer with a mortgage: 869 (110 second mortgage, 0 home equity loan, 97 both second mortgage and home equity loan)
Houses without a mortgage: 25
Median household income for houses/condos with a mortgage: $243,892
Median household income for apartments without a mortgage: $215,671
Median monthly housing costs: $3,503
Compare current foreclosures near Kildeer, IL:
| Photo | Address | Area | Beds / Baths | Price | Details |
|---|---|---|---|---|---|

|
#1
Briar Hill Dr
Schaumburg, IL 60194
|
1,600 sq. feet
|
2 baths 4 beds |
$410,400
|
show details |

|
#2
Wisconsin Ave
Barrington, IL 60010
|
1,297 sq. feet
|
2 baths 3 beds |
$489,900
|
show details |

|
#3
N 4th Ave
Des Plaines, IL 60016
|
1,381 sq. feet
|
1 baths 3 beds |
$335,000
|
show details |

|
#4
Carriage Way Dr
Arlington Heights, IL 60004
|
- sq. feet
|
2 baths 2 beds |
$179,900
|
show details |

|
#5
Webster Ln
Des Plaines, IL 60018
|
1,608 sq. feet
|
3 baths 3 beds |
$515,000
|
show details |

|
#6
S Lyman Ave
Des Plaines, IL 60016
|
2,233 sq. feet
|
2 baths 4 beds |
$330,000
|
show details |

|
#7
E Crest Ave
Addison, IL 60101
|
2,023 sq. feet
|
1 baths 5 beds |
$329,000
|
show details |

|
#8
Clover Ct
Round Lake, IL 60073
|
1,682 sq. feet
|
1 baths 3 beds |
$273,000
|
show details |

|
#9
Avenida Serra Test
Des Plaines, IL 60018
|
- sq. feet
|
2 baths 3 beds |
$100,000
|
show details |

|
#10
Clover Ln
Round Lake, IL 60073
|
- sq. feet
|
2 baths 3 beds |
$130,000
|
show details |
| Photo | Address | Area | Beds / Baths | Price | Details |
|---|---|---|---|---|---|

|
#11
Scarsdale Ct Unit C2
Schaumburg, IL 60193
|
950 sq. feet
|
1 baths 2 beds |
show details | |

|
#12
Thompson Blvd
Buffalo Grove, IL 60089
|
1,670 sq. feet
|
3 baths 4 beds |
show details | |

|
#13
N Lancaster St
Mount Prospect, IL 60056
|
1,521 sq. feet
|
1 baths 4 beds |
show details | |

|
#14
W Kinley Blvd
Mchenry, IL 60050
|
1,068 sq. feet
|
3 baths 3 beds |
show details | |

|
#15
Meadow Hill Ln
Round Lake, IL 60073
|
1,176 sq. feet
|
2 baths 3 beds |
show details | |

|
#16
Otis Rd
Barrington, IL 60010
|
5,900 sq. feet
|
9 baths 7 beds |
show details | |

|
#17
N Gilmer Rd
Mundelein, IL 60060
|
1,908 sq. feet
|
2 baths 4 beds |
show details | |

|
#18
Sequoia Dr
Hanover Park, IL 60133
|
1,773 sq. feet
|
2 baths 3 beds |
show details | |

|
#19
Fernwood Ln
Algonquin, IL 60102
|
5,776 sq. feet
|
5 baths 5 beds |
show details | |

|
#20
Jester Ln
Algonquin, IL 60102
|
1,299 sq. feet
|
2 baths 4 beds |
show details |
| Photo | Address | Area | Beds / Baths | Price | Details |
|---|---|---|---|---|---|

|
#21
Sprucewood Ln
Lake Villa, IL 60046
|
1,291 sq. feet
|
1 baths 3 beds |
show details | |

|
#22
Cherokee Dr
Round Lake, IL 60073
|
1,136 sq. feet
|
2 baths 4 beds |
show details | |

|
#23
Dee Rd
Des Plaines, IL 60016
|
1,500 sq. feet
|
2 baths 3 beds |
show details | |

|
#24
Brookwood Trl
Mchenry, IL 60050
|
1,140 sq. feet
|
3 baths 3 beds |
show details | |

|
#25
Sheryl Ln
Glenview, IL 60025
|
1,269 sq. feet
|
2 baths 3 beds |
show details | |

|
#26
Newcastle Dr
Roselle, IL 60172
|
1,743 sq. feet
|
3 baths 3 beds |
show details | |

|
#27
Upper Pond Rd
Barrington, IL 60010
|
2,820 sq. feet
|
3 baths 4 beds |
show details | |

|
#28
Ridgewood Ave
Bensenville, IL 60106
|
1,378 sq. feet
|
2 baths 4 beds |
show details | |

|
#29
Sarazen Dr
Vernon Hills, IL 60061
|
3,576 sq. feet
|
2 baths 4 beds |
show details | |

|
#30
Cherry Ave
Hanover Park, IL 60133
|
1,246 sq. feet
|
1 baths 3 beds |
show details |
| Photo | Address | Area | Beds / Baths | Price | Details |
|---|---|---|---|---|---|

|
#31
E Church St
Des Plaines, IL 60016
|
- sq. feet
|
- baths - beds |
$185,500
|
show details |

|
#32
W Larkdale Ln
Mount Prospect, IL 60056
|
1,920 sq. feet
|
2 baths 4 beds |
show details | |

|
#33
Glenwood Ave
Mchenry, IL 60051
|
780 sq. feet
|
1 baths 3 beds |
show details | |

|
#34
N Tallyho Dr
Addison, IL 60101
|
3,346 sq. feet
|
2 baths 4 beds |
show details | |

|
#35
Dove St
Rolling Meadows, IL 60008
|
2,632 sq. feet
|
2 baths 3 beds |
show details | |

|
#36
Flora Ave
Glenview, IL 60025
|
2,100 sq. feet
|
3 baths 4 beds |
show details | |

|
#37
S Fulton Ave
Waukegan, IL 60085
|
1,365 sq. feet
|
1 baths 4 beds |
show details | |

|
#38
S Hart St
Palatine, IL 60067
|
1,183 sq. feet
|
1 baths 3 beds |
show details | |

|
#39
W Washington St
Palatine, IL 60067
|
1,040 sq. feet
|
1 baths 3 beds |
show details | |

|
#40
Bentley Pl
Buffalo Grove, IL 60089
|
1,592 sq. feet
|
2 baths 2 beds |
show details |
| Photo | Address | Area | Beds / Baths | Price | Details |
|---|---|---|---|---|---|

|
#41
Old Barn Rd
Barrington, IL 60010
|
2,371 sq. feet
|
5 baths 4 beds |
show details | |

|
#42
Lindy St
Ingleside, IL 60041
|
1,926 sq. feet
|
2 baths 3 beds |
show details | |

|
#43
Douglas Ave
Elgin, IL 60120
|
3,302 sq. feet
|
2 baths 5 beds |
show details | |

|
#44
N Buck Ct
Lake Villa, IL 60046
|
3,192 sq. feet
|
3 baths 5 beds |
show details | |

|
#45
W Engle Dr
Lake Villa, IL 60046
|
1,456 sq. feet
|
1 baths 3 beds |
show details | |

|
#46
Getty St
Elgin, IL 60120
|
1,280 sq. feet
|
3 baths 3 beds |
show details | |

|
#47
Woodstone Ct
Buffalo Grove, IL 60089
|
2,536 sq. feet
|
2 baths 3 beds |
show details | |

|
#48
Thistle Ln
Glencoe, IL 60022
|
- sq. feet
|
- baths - beds |
$650,000
|
show details |

|
#49
Fairway Cir
Barrington, IL 60010
|
1,610 sq. feet
|
2 baths 3 beds |
show details | |

|
Check over 1 million property listings on Foreclosure.com!
|
browse all offers | |||

Latest news about housing in Kildeer, IL collected exclusively by city-data.com from local newspapers, TV, and radio stations

 | Rent or buy? Good deal and a good time to buy? (43 replies) |
| Kildeer or Barrington? What would you do? (15 replies) |
| Is it wise to buy a house in Riverwoods, IL? (5 replies) |
| Good schools, newer housing near Schaumburg IL (9 replies) |
| Relocating & buying a home in hoffman estates, il!??! Good or bad choice? (18 replies) |
| It's really hard to find a house in Hinsdale! (65 replies) |

Household type by relationship:
Households: 4,109- Male householders: 764 (30 living alone), Female householders: 566 (43 living alone)
1,219 spouses (1,207 opposite-sex spouses), 11 unmarried partners, (11 opposite-sex unmarried partners), 1,508 children (1,482 natural, 25 adopted, 0 stepchildren), 0 grandchildren, 10 brothers or sisters, 7 parents, 0 foster children, 19 other relatives, 0 non-relatives
Size of family households: 449 2-persons, 307 3-persons, 413 4-persons, 100 5-persons, 6 6-persons.
Size of nonfamily households: 78 1-person, 12 2-persons.
1,091 married couples with children.
24 single-parent households (21 men, 3 women).
74.4% of residents of Kildeer speak English at home.
1.6% of residents speak Spanish at home (31% speak English very well, 59% speak English well, 10% speak English not well).
11.9% of residents speak other Indo-European language at home (73% speak English very well, 24% speak English well, 3% speak English not well).
11.9% of residents speak Asian or Pacific Island language at home (87% speak English very well, 13% speak English well).
0.5% of residents speak other language at home (100% speak English very well).
Foreign born population: 833 (20.3%)
(77.7% of them are naturalized citizens)
| Here: | 10.0 |
| State: | 6.4 |
| Here: | -666666666.0 |
| State: | 4.1 |

- Bedrooms in owner-occupied houses and condos in Kildeer, Illinois
- 0no bedroom
- 01 bedroom
- 122 bedrooms
- 2643 bedrooms
- 7724 bedrooms
- 3085+ bedrooms

- Bedrooms in renter-occupied apartments in Kildeer, Illinois
- 0no bedroom
- 71 bedroom
- 02 bedrooms
- 03 bedrooms
- 74 bedrooms
- 05+ bedrooms

- Cars and other vehicles available in Kildeer in owner-occupied houses/condos
- 0no vehicle
- 611 vehicle
- 8342 vehicles
- 3703 vehicles
- 584 vehicles
- 335+ vehicles

- Cars and other vehicles available in Kildeer in renter-occupied apartments
- 7no vehicle
- 01 vehicle
- 72 vehicles
- 03 vehicles
- 04 vehicles
- 05+ vehicles

- Rooms in owner-occupied houses in Kildeer, Illinois
- 01 room
- 02 rooms
- 03 rooms
- 264 rooms
- 315 rooms
- 806 rooms
- 787 rooms
- 1978 rooms
- 9469+ rooms

- Rooms in renter-occupied apartments in Kildeer, Illinois
- 01 room
- 02 rooms
- 73 rooms
- 04 rooms
- 05 rooms
- 06 rooms
- 07 rooms
- 78 rooms
- 09+ rooms


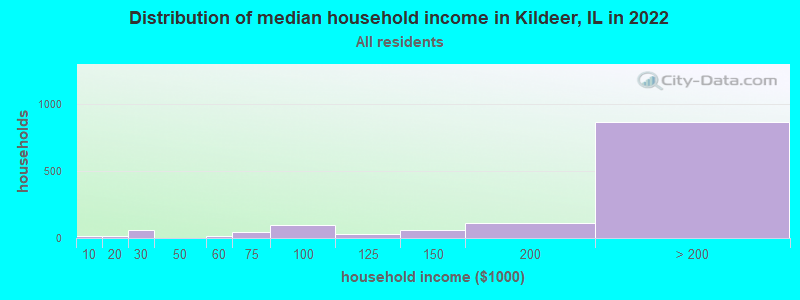
Kildeer, IL household income distribution

- 12Less than $10,000
- 16$10,000 to $19,999
- 60$20,000 to $29,999
- 12$50,000 to $59,999
- 42$60,000 to $74,999
- 97$75,000 to $99,999
- 29$100,000 to $124,999
- 62$125,000 to $149,999
- 112$150,000 to $199,999
- 867$200,000 or more
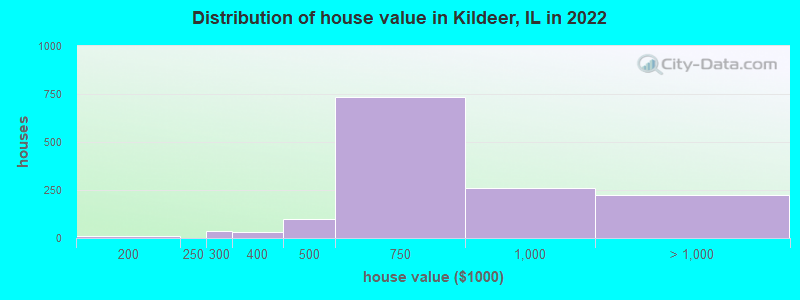
Home value of owner - occupied houses in 2022 in Kildeer, IL
-
- 11$150,000 to $174,999
- 36$250,000 to $299,999
- 31$300,000 to $399,999
- 100$400,000 to $499,999
- 734$500,000 to $749,999
- 261$750,000 to $999,999
- 207$1,000,000 to $1,499,999
- 18$2,000,000 or more
Rent paid by renters in 2022 in Kildeer, IL
-
- 6$650 to $699
- 4$3,000 to $3,499

Percentage of workers working in this county: 59.8%
Number of people working at home: 743 (34.9% of all workers)
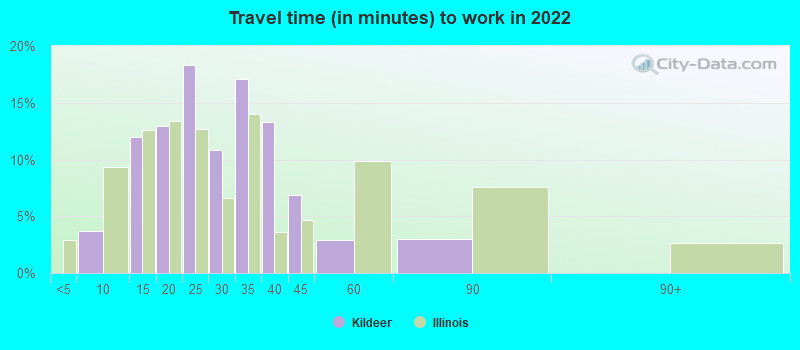
Travel time to work (commute)
- Less than 5 minutes: 0
- 5 to 9 minutes: 50
- 10 to 14 minutes: 64
- 15 to 19 minutes: 67
- 20 to 24 minutes: 153
- 25 to 29 minutes: 179
- 30 to 34 minutes: 317
- 35 to 39 minutes: 141
- 40 to 44 minutes: 158
- 45 to 59 minutes: 161
- 60 to 89 minutes: 109
- 90 or more minutes: 42
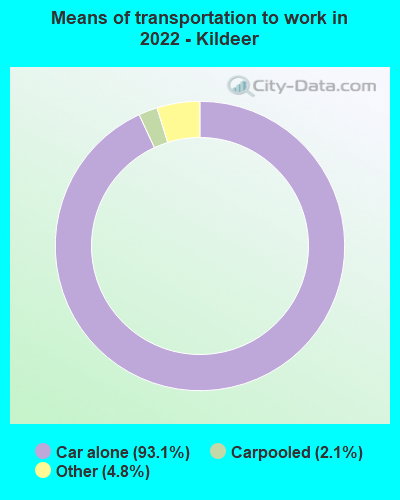
Means of transportation to work:
- Drove a car alone: 953 (57.4%)
- Carpooled: 21 (1.3%)
- Taxi: 51 (3.1%)
- Worked at home: 743 (44.8%)
- Unemployment by race in 2022
- Unemployment rate for White non-Hispanic residents
- 3.1%Males
- 2.0%Females

- Year of entry for the foreign-born population in Kildeer, Illinois
- 1932010 or later
- 832000 to 2009
- 3691990 to 1999
- 981980 to 1989
- 701970 to 1979
- 77Before 1970

First ancestries reported:
- Polish: 289 (14.6%)
- Italian: 167 (8.4%)
- German: 155 (7.8%)
- American: 108 (5.4%)
- Irish: 95 (4.8%)
- Ukrainian: 73 (3.7%)
- Russian: 67 (3.4%)
- Romanian: 51 (2.6%)
- Dutch: 44 (2.2%)
- English: 39 (2.0%)
- Swedish: 36 (1.8%)
- Norwegian: 19 (1.0%)
- Scottish: 16 (0.8%)
- European: 13 (0.7%)
- Czech: 12 (0.6%)
- Israeli: 11 (0.6%)
- Serbian: 11 (0.6%)
- French: 10 (0.5%)
- Hungarian: 8 (0.4%)
- Austrian: 6 (0.3%)
- Northern European: 5 (0.3%)
- British: 4 (0.2%)
Most common places of birth for foreign-born residents (%):
| Kildeer: | 28.8% (230) |
| Illinois: | 4.1% (74,364) |
| Kildeer: | 21.1% (168) |
| Illinois: | 9.2% (166,409) |
| Kildeer: | 11.8% (94) |
| Illinois: | 6.9% (124,474) |
| Kildeer: | 6.5% (52) |
| Illinois: | 1.6% (29,316) |
| Kildeer: | 4.9% (39) |
| Illinois: | 1.0% (18,753) |
| Kildeer: | 3.1% (25) |
| Illinois: | 0.5% (8,235) |
| Kildeer: | 2.9% (23) |
| Illinois: | 0.2% (2,861) |
| Kildeer: | 2.8% (22) |
| Illinois: | 0.5% (8,551) |
| Kildeer: | 2.8% (22) |
| Illinois: | 0.2% (4,177) |
| Kildeer: | 2.0% (16) |
| Illinois: | 2.2% (40,393) |
| Kildeer: | 1.9% (15) |
| Illinois: | 0.5% (9,671) |
| Kildeer: | 1.8% (14) |
| Illinois: | 0.5% (8,778) |
| Kildeer: | 1.6% (13) |
| Illinois: | 34.7% (626,958) |
| Kildeer: | 1.5% (12) |
| Illinois: | 0.8% (14,736) |
Place of birth for U.S.-born residents:
- This state: 2,355
- Other state: 914
- Northeast: 270
- Midwest: 379
- South: 164
- West: 89
92.5% of Kildeer residents lived in the same house 1 years ago.
Out of people who lived in different houses, 23.8% lived in this county.
Out of people who lived in different counties, 96.6% lived in Illinois.
| Kildeer: | 92.5% |
| State average: | 88.3% |
Education attainment for males 25 years and older:
- No schooling: 0
- Nursery to 4th grade: 0
- 5th and 6th grade: 0
- 7th and 8th grade: 0
- 9th grade: 0
- 10th grade: 0
- 11th grade: 0
- 12th grade, no diploma: 0
- High school graduate (or equivalency): 79
- Less than 1 year of college: 33
- Some college more than 1 year, no degree: 37
- Associate degree: 85
- Bachelor's degree: 561
- Master's degree: 382
- Professional school degree: 126
- Doctorate degree: 173

Education attainment for females 25 years and older:
- No schooling: 21
- Nursery to 4th grade: 0
- 5th and 6th grade: 0
- 7th and 8th grade: 0
- 9th grade: 0
- 10th grade: 0
- 11th grade: 0
- 12th grade, no diploma: 0
- High school graduate (or equivalency): 122
- Less than 1 year of college: 40
- Some college more than 1 year, no degree: 67
- Associate degree: 103
- Bachelor's degree: 401
- Master's degree: 449
- Professional school degree: 119
- Doctorate degree: 14


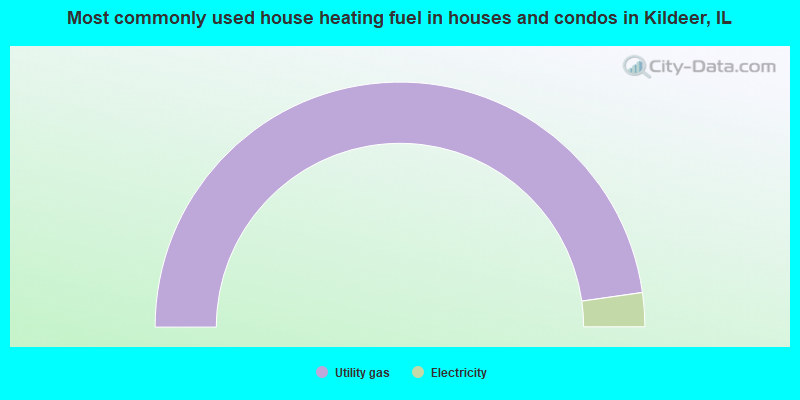
Housing units in structures:
- One, detached: 1,382
- 50 or more: 7
Housing units lacking complete kitchen facilities in 2022: 2.5%

Private vs. public school enrollment:
| Here: | 19.8% |
| Illinois: | 13.3% |
| Here: | 1.5% |
| Illinois: | 9.9% |
| Here: | 40.0% |
| Illinois: | 27.4% |


