Jump to a detailed profile or search site with Google Custom Search

Killington, VT (Vermont) Houses and Residents

Estimated median house or condo value in 2022: $458,071 (it was $195,600 in 2000)
Killington:

$458,071
Vermont:

$304,700
Lower value quartile - upper value quartile: $300,917 - $642,539

Total population: 811 (Urban population: 0, Rural population: 1,095 (all nonfarm))

Houses: 2,528 (500 occupied: 369 owner occupied, 131 renter occupied)

% of renters here:

26%
State:

26%

Housing density: 54 houses/condos per square mile

Median price asked for vacant for-sale houses and condos in 2022 in this county: $156,718.

Median contract rent in 2022: $853 (lower quartile is $627, upper quartile is $1,152)


Median rent asked for vacant for-rent units in 2022: $718


Median gross rent in Killington, VT in 2022: $1,023

Housing units in Killington with a mortgage: 143 (2 second mortgage, 19 home equity loan, 0 both second mortgage and home equity loan)
Houses without a mortgage: 80

Compare current foreclosures near Killington, VT:

Check out more offers near Killington, VT.
Powered by Foreclosure.com


Latest news about housing in Killington, VT collected exclusively by city-data.com from local newspapers, TV, and radio stations

Killington, Vermont Age and Sex of Residents

Household type by relationship:

Households: 59,324
  • In family households: 46,689 (10,990 male householders, 5,028 female householders)
    12,287 spouses, 14,538 children (13,423 natural, 423 adopted, 692 stepchildren), 830 grandchildren, 337 brothers or sisters, 356 parents, foster children, 341 other relatives, 1,706 non-relatives
  • In nonfamily households: 12,635 (4,693 male householders (3,474 living alone)), 5,273 female householders (4,364 living alone)), 2,669 nonrelatives
  • In group quarters: 2,318 (551 institutionalized population)

10,211 married couples with children.
3,525 single-parent households (877 men, 2,648 women).

95.1% of residents of Killington speak English at home.
1.3% of residents speak Spanish at home (71% speak English very well, 29% speak English well).
3.1% of residents speak other Indo-European language at home (97% speak English very well, 3% speak English well).
0.2% of residents speak Asian or Pacific Island language at home (100% speak English very well).
0.3% of residents speak other language at home (100% speak English very well).

Foreign born population: 61 (5.0%)
(75.4% of them are naturalized citizens)

Median number of rooms in houses and condos:
Here:

6.4
State:

6.4

Median number of rooms in apartments
Here:

4.3
State:

3.9

Owner-occupied Renter-occupied
Bedrooms in owner-occupied houses and condos in Killington, Vermont
  • Bedrooms in owner-occupied houses and condos in Killington, Vermont
  • 0no bedroom
  • 181 bedroom
  • 532 bedrooms
  • 1573 bedrooms
  • 834 bedrooms
  • 585+ bedrooms
Bedrooms in renter-occupied apartments in Killington, Vermont
  • Bedrooms in renter-occupied apartments in Killington, Vermont
  • 5no bedroom
  • 311 bedroom
  • 402 bedrooms
  • 413 bedrooms
  • 44 bedrooms
  • 105+ bedrooms
Owner-occupied Renter-occupied
Cars and other vehicles available in Killington in owner-occupied houses/condos
  • Cars and other vehicles available in Killington in owner-occupied houses/condos
  • 0no vehicle
  • 1091 vehicle
  • 1822 vehicles
  • 523 vehicles
  • 204 vehicles
  • 65+ vehicles
Cars and other vehicles available in Killington in renter-occupied apartments
  • Cars and other vehicles available in Killington in renter-occupied apartments
  • 0no vehicle
  • 721 vehicle
  • 552 vehicles
  • 23 vehicles
  • 04 vehicles
  • 25+ vehicles
Owner-occupied Renter-occupied
Rooms in owner-occupied houses in Killington, Vermont
  • Rooms in owner-occupied houses in Killington, Vermont
  • 01 room
  • 22 rooms
  • 203 rooms
  • 384 rooms
  • 545 rooms
  • 686 rooms
  • 507 rooms
  • 628 rooms
  • 759+ rooms
Rooms in renter-occupied apartments in Killington, Vermont
  • Rooms in renter-occupied apartments in Killington, Vermont
  • 51 room
  • 252 rooms
  • 193 rooms
  • 344 rooms
  • 215 rooms
  • 66 rooms
  • 87 rooms
  • 58 rooms
  • 89+ rooms
Year house built
Breakdown of mean house values by ages of householders
Owners and renters by unit type in Killington, VT
  • Killington, VT household income distribution

  • Distribution of median household income in Killington, VT in 2022
  • 5,853Less than $10,000
  • 11,950$10,000 to $19,999
  • 13,720$20,000 to $29,999
  • 15,969$30,000 to $39,999
  • 14,811$40,000 to $49,999
  • 14,432$50,000 to $59,999
  • 19,209$60,000 to $74,999
  • 29,076$75,000 to $99,999
  • 19,254$100,000 to $124,999
  • 15,372$125,000 to $149,999
  • 19,519$150,000 to $199,999
  • 17,631$200,000 or more

Percentage of workers working in this county: 83.5%
Number of people working at home: 126 (17.3% of all workers)

Travel time to work (commute)

  • Less than 5 minutes: 89
  • 5 to 9 minutes: 137
  • 10 to 14 minutes: 88
  • 15 to 19 minutes: 67
  • 20 to 24 minutes: 48
  • 25 to 29 minutes: 44
  • 30 to 34 minutes: 64
  • 35 to 39 minutes: 4
  • 40 to 44 minutes: 17
  • 45 to 59 minutes: 29
  • 60 to 89 minutes: 26
  • 90 or more minutes: 14

Means of transportation to work:

  • Drove a car alone: 554 (82.8%)
  • Carpooled: 44 (6.6%)
  • Bus or trolley bus: 8 (1.2%)
  • Subway or elevated: 1 (0.1%)
  • Railroad: 2 (0.3%)
  • Walked: 10 (1.5%)
  • Other means: 8 (1.2%)
  • Worked at home: 42 (6.3%)
Class of Workers in 2000
Year of entry for the foreign-born population in Killington, Vermont
  • Year of entry for the foreign-born population in Killington, Vermont
  • 91995 to March 2000
  • 31990 to 1994
  • 01985 to 1989
  • 21980 to 1984
  • 01975 to 1979
  • 41970 to 1974
  • 71965 to 1969
  • 31Before 1965
Ancestries in Killington, VT

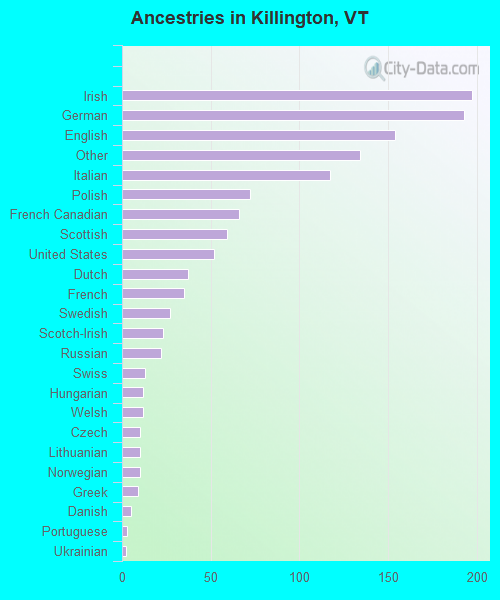
First ancestries reported:

  • Irish: 197 (15.5%)
  • German: 193 (15.1%)
  • English: 154 (12.1%)
  • Other: 134 (10.5%)
  • Italian: 117 (9.2%)
  • Polish: 72 (5.7%)
  • French Canadian: 66 (5.2%)
  • Scottish: 59 (4.6%)
  • United States: 52 (4.1%)
  • Dutch: 37 (2.9%)
  • French: 35 (2.7%)
  • Swedish: 27 (2.1%)
  • Scotch-Irish: 23 (1.8%)
  • Russian: 22 (1.7%)
  • Swiss: 13 (1.0%)
  • Hungarian: 12 (0.9%)
  • Welsh: 12 (0.9%)
  • Czech: 10 (0.8%)
  • Lithuanian: 10 (0.8%)
  • Norwegian: 10 (0.8%)
  • Greek: 9 (0.7%)
  • Danish: 5 (0.4%)
  • Portuguese: 3 (0.2%)
  • Ukrainian: 2 (0.2%)

Most common places of birth for foreign-born residents (%):

Austria
Killington:

19.6% (11)
Vermont:

0.8% (191)

Canada
Killington:

16.1% (9)
Vermont:

34.0% (7,912)

Italy
Killington:

10.7% (6)
Vermont:

1.4% (322)

United Kingdom
Killington:

8.9% (5)
Vermont:

7.5% (1,744)

Cambodia
Killington:

8.9% (5)
Vermont:

0.3% (65)

Philippines
Killington:

7.1% (4)
Vermont:

1.0% (228)

Netherlands
Killington:

5.4% (3)
Vermont:

1.4% (318)

Poland
Killington:

5.4% (3)
Vermont:

1.6% (381)

Sweden
Killington:

3.6% (2)
Vermont:

0.7% (152)

Germany
Killington:

3.6% (2)
Vermont:

7.2% (1,669)

Hong Kong
Killington:

3.6% (2)
Vermont:

0.4% (84)

Other Australian and New Zealand Subregion
Killington:

3.6% (2)
Vermont:

0.2% (40)

Argentina
Killington:

3.6% (2)
Vermont:

0.6% (131)

Place of birth for U.S.-born residents:

  • This state: 223
  • Other state: 816
  • Northeast: 723
  • Midwest: 44
  • South: 37
  • West: 12

62% of Killington residents lived in the same house 5 years ago.
   Out of people who lived in different houses, 34% lived in this county.
   Out of people who lived in different counties, 4% lived in Vermont.

Education attainment for males 25 years and older:

  • No schooling: 4
  • Nursery to 4th grade: 0
  • 5th and 6th grade: 2
  • 7th and 8th grade: 7
  • 9th grade: 3
  • 10th grade: 7
  • 11th grade: 3
  • 12th grade, no diploma: 2
  • High school graduate (or equivalency): 68
  • Less than 1 year of college: 19
  • Some college more than 1 year, no degree: 63
  • Associate degree: 22
  • Bachelor's degree: 165
  • Master's degree: 44
  • Professional school degree: 15
  • Doctorate degree: 8
Educational Attainment for Males

Education attainment for females 25 years and older:

  • No schooling: 0
  • Nursery to 4th grade: 0
  • 5th and 6th grade: 0
  • 7th and 8th grade: 2
  • 9th grade: 0
  • 10th grade: 2
  • 11th grade: 0
  • 12th grade, no diploma: 2
  • High school graduate (or equivalency): 60
  • Less than 1 year of college: 20
  • Some college more than 1 year, no degree: 75
  • Associate degree: 58
  • Bachelor's degree: 104
  • Master's degree: 49
  • Professional school degree: 7
  • Doctorate degree: 5
Educational Attainment for Females
Killington marital status for males
Killington marital status for females

Housing units in structures:

  • One, detached: 813
  • One, attached: 81
  • Two: 217
  • 3 or 4: 226
  • 5 to 9: 366
  • 10 to 19: 186
  • 20 to 49: 415
  • 50 or more: 208
  • Mobile homes: 16

Median worth of mobile homes: $142,388

Housing units lacking complete plumbing facilities: 0.4%

Housing units lacking complete kitchen facilities: 0.6%
Year householders moved into residence in Killington
Houses and condos Apartments
Most commonly used house heating fuel in houses and condos in Killington, VT
  • 46.3%Fuel oil, kerosene, etc.
  • 35.2%Bottled, tank, or LP gas
  • 7.3%Wood
  • 5.7%Electricity
  • 4.9%Utility gas
  • 0.5%Other fuel
Most commonly used house heating fuel in apartments in Killington, VT
  • 38.2%Bottled, tank, or LP gas
  • 33.6%Fuel oil, kerosene, etc.
  • 22.9%Electricity
  • 3.1%Wood
  • 2.3%Utility gas

Private vs. public school enrollment:

Students in private schools in grades 1 to 8 (elementary and middle school): 2
Here:

1.7%
Vermont:

7.2%

Students in private schools in grades 9 to 12 (high school): 7
Here:

12.3%
Vermont:

10.4%

Students in private undergraduate colleges: 13
Here:

26.0%
Vermont:

37.7%
School Enrollment by Level of School for Male Students
School Enrollment by Level of School for Female Students
Age and Sex of Sensory-Disabled Noninstitutionalized Residents
Age and Sex of Physically-Disabled Noninstitutionalized Residents
Age and Sex of Mentally-Disabled Noninstitutionalized Residents
Age and Sex of Self-Care Disabled Noninstitutionalized Residents
Age and Sex of Go-Outside-Home Disabled Noninstitutionalized Residents
Age and Sex of Noninstitutionalized Residents with Employment Disability