Kincaid, IL (Illinois) Houses and Residents
| Kincaid: | $87,444 |
| Illinois: | $251,600 |
Mean price in 2022:
Detached houses: $145,216
Here: $145,216 State: $310,164 Mobile homes: $55,818
Here: $55,818 State: $78,855
Total population: 1,451 (Urban population: 0, Rural population: 1,485 (4 farm, 1,481 nonfarm))
Houses: 623 (574 occupied: 432 owner occupied, 149 renter occupied)
| % of renters here: | 26% |
| State: | 33% |
Housing density: 999 houses/condos per square mile
Median price asked for vacant for-sale houses and condos in 2022 in this county: $64,713.
Median contract rent in 2022: $436 (lower quartile is $343, upper quartile is $581)
Median rent asked for vacant for-rent units in 2022: $1,901
Median gross rent in Kincaid, IL in 2022: $694
Housing units in Kincaid with a mortgage: 172 (29 second mortgage, 0 home equity loan, 29 both second mortgage and home equity loan)
Houses without a mortgage: 3
Median household income for houses/condos with a mortgage: $86,429
Median household income for apartments without a mortgage: $40,625
Median monthly housing costs: $567
Compare current foreclosures near Kincaid, IL:
| Photo | Address | Area | Beds / Baths | Price | Details |
|---|---|---|---|---|---|

|
#1
North Ave
Kincaid, IL 62540
|
- sq. feet
|
- baths 2 beds |
$39,900
|
show details |

|
#2
Summit Ave
Kincaid, IL 62540
|
1,100 sq. feet
|
1 baths 3 beds |
show details | |

|
#3
Mayfair Rd
Springfield, IL 62703
|
1,812 sq. feet
|
2 baths 3 beds |
$189,000
|
show details |

|
#4
Neptune Villa
Springfield, IL 62703
|
1,232 sq. feet
|
2 baths 3 beds |
show details | |

|
#5
Kenton Blvd
Taylorville, IL 62568
|
1,530 sq. feet
|
1 baths 4 beds |
show details | |

|
#6
S 13th St
Springfield, IL 62703
|
610 sq. feet
|
1 baths 1 beds |
show details | |

|
#7
Lancaster Rd
Springfield, IL 62703
|
936 sq. feet
|
1 baths 2 beds |
show details | |

|
#8
N Cherokee St
Taylorville, IL 62568
|
1,088 sq. feet
|
1 baths 3 beds |
show details | |

|
#9
S Elm St
Stonington, IL 62567
|
1,704 sq. feet
|
2 baths 3 beds |
show details | |

|
#10
Leonard St
Farmersville, IL 62533
|
- sq. feet
|
3 baths 3 beds |
show details |
| Photo | Address | Area | Beds / Baths | Price | Details |
|---|---|---|---|---|---|

|
#11
E 2750 North Rd
Blue Mound, IL 62513
|
570 sq. feet
|
- baths 3 beds |
show details | |

|
#12
Ostermeier Rd
Auburn, IL 62615
|
- sq. feet
|
- baths - beds |
show details | |

|
#13
Cravens Rd
Springfield, IL 62712
|
- sq. feet
|
- baths - beds |
show details | |

|
#14
Treviso Dr Apt 203
Springfield, IL 62703
|
- sq. feet
|
- baths - beds |
show details | |

|
#15
Pickfair Rd
Springfield, IL 62703
|
- sq. feet
|
- baths - beds |
show details | |

|
#16
Bullard Rd
Buffalo, IL 62515
|
- sq. feet
|
- baths - beds |
show details | |

|
#17
Railroad St
Mechanicsburg, IL 62545
|
- sq. feet
|
- baths - beds |
show details | |

|
#18
E Southwind Rd Apt 139
Springfield, IL 62703
|
- sq. feet
|
- baths - beds |
show details | |

|
#19
4th Cross St
Mechanicsburg, IL 62545
|
- sq. feet
|
- baths - beds |
show details | |

|
#20
Whitetail Dr Apt 5
Springfield, IL 62703
|
- sq. feet
|
- baths - beds |
show details |
| Photo | Address | Area | Beds / Baths | Price | Details |
|---|---|---|---|---|---|

|
#21
S 6th Street Rd
Springfield, IL 62703
|
- sq. feet
|
- baths - beds |
show details | |

|
#22
S Grand Ave E
Springfield, IL 62712
|
- sq. feet
|
- baths - beds |
show details | |

|
#23
S 6th St Frontage Rd E, # 206
Springfield, IL 62712
|
- sq. feet
|
- baths - beds |
show details | |

|
#24
Waterwheel Dr
Rochester, IL 62563
|
- sq. feet
|
- baths - beds |
show details | |

|
#25
Country Pl
Springfield, IL 62703
|
- sq. feet
|
- baths - beds |
show details | |

|
#26
3rd St
Pawnee, IL 62558
|
- sq. feet
|
- baths - beds |
show details | |

|
#27
W Market St
Taylorville, IL 62568
|
- sq. feet
|
- baths - beds |
show details | |

|
#28
W 4th St
Morrisonville, IL 62546
|
- sq. feet
|
- baths - beds |
show details | |

|
#29
S Main St
Taylorville, IL 62568
|
- sq. feet
|
- baths - beds |
show details | |

|
#30
Thomas St
Morrisonville, IL 62546
|
- sq. feet
|
- baths - beds |
show details |
| Photo | Address | Area | Beds / Baths | Price | Details |
|---|---|---|---|---|---|

|
#31
Jefferson St
Pawnee, IL 62558
|
- sq. feet
|
- baths - beds |
show details | |

|
#32
7th St
Pawnee, IL 62558
|
- sq. feet
|
- baths - beds |
show details | |

|
#33
S Elevator St
Taylorville, IL 62568
|
- sq. feet
|
- baths - beds |
show details | |

|
#34
Kincaid St
Taylorville, IL 62568
|
- sq. feet
|
- baths - beds |
show details | |

|
#35
Adloff Ln
Springfield, IL 62703
|
- sq. feet
|
- baths - beds |
show details | |

|
#36
Sheridan St
Springfield, IL 62703
|
- sq. feet
|
- baths - beds |
show details | |

|
#37
E Hood St
Springfield, IL 62703
|
- sq. feet
|
- baths - beds |
show details | |

|
#38
N 800 East Rd
Edinburg, IL 62531
|
- sq. feet
|
- baths - beds |
show details | |

|
#39
E Spruce St
Chatham, IL 62629
|
- sq. feet
|
- baths - beds |
show details | |

|
#40
Sherman St
Springfield, IL 62703
|
- sq. feet
|
- baths - beds |
show details |
| Photo | Address | Area | Beds / Baths | Price | Details |
|---|---|---|---|---|---|

|
#41
Taylor Ave
Springfield, IL 62703
|
- sq. feet
|
- baths - beds |
show details | |

|
#42
E Locust St
Chatham, IL 62629
|
- sq. feet
|
- baths - beds |
show details | |

|
#43
Warner Dr
Springfield, IL 62703
|
- sq. feet
|
- baths - beds |
show details | |

|
#44
Buckner St
Springfield, IL 62703
|
- sq. feet
|
- baths - beds |
show details | |

|
#45
Magnolia Dr
Chatham, IL 62629
|
- sq. feet
|
- baths - beds |
show details | |

|
#46
Walberta
Rochester, IL 62563
|
- sq. feet
|
- baths - beds |
show details | |

|
#47
Neptune Villa
Springfield, IL 62703
|
- sq. feet
|
- baths - beds |
show details | |

|
#48
Oakbrook Ave
Chatham, IL 62629
|
- sq. feet
|
- baths - beds |
show details | |

|
#49
Carroll St
Pawnee, IL 62558
|
- sq. feet
|
- baths - beds |
show details | |

|
Check over 1 million property listings on Foreclosure.com!
|
browse all offers | |||

Latest news about housing in Kincaid, IL collected exclusively by city-data.com from local newspapers, TV, and radio stations

 | Best City for a Retiree to live (15 replies) |
| Rail in Illinois (85 replies) |
| Pick your place (7/18/08) (54 replies) |
| Possible move to Springfield.... (21 replies) |

Median year apartment built: 1952
Household type by relationship:
Households: 1,130- Male householders: 319 (121 living alone), Female householders: 244 (105 living alone)
229 spouses (229 opposite-sex spouses), 65 unmarried partners, (65 opposite-sex unmarried partners), 185 children (185 natural, 0 adopted, 0 stepchildren), 23 grandchildren, 16 brothers or sisters, 16 parents, 0 foster children, 15 other relatives, 12 non-relatives
Size of family households: 206 2-persons, 57 3-persons, 17 4-persons, 10 5-persons.
Size of nonfamily households: 238 1-person, 58 2-persons.
62 married couples with children.
27 single-parent households (5 men, 22 women).
98.8% of residents of Kincaid speak English at home.
0.6% of residents speak other Indo-European language at home (100% speak English very well).
| Here: | 5.7 |
| State: | 6.4 |
| Here: | 3.9 |
| State: | 4.1 |

- Bedrooms in owner-occupied houses and condos in Kincaid, Illinois
- 0no bedroom
- 191 bedroom
- 1302 bedrooms
- 2653 bedrooms
- 184 bedrooms
- 05+ bedrooms

- Bedrooms in renter-occupied apartments in Kincaid, Illinois
- 8no bedroom
- 91 bedroom
- 1062 bedrooms
- 153 bedrooms
- 114 bedrooms
- 05+ bedrooms

- Cars and other vehicles available in Kincaid in owner-occupied houses/condos
- 23no vehicle
- 1081 vehicle
- 1772 vehicles
- 943 vehicles
- 274 vehicles
- 35+ vehicles

- Cars and other vehicles available in Kincaid in renter-occupied apartments
- 16no vehicle
- 371 vehicle
- 442 vehicles
- 33 vehicles
- 504 vehicles
- 05+ vehicles

- Rooms in owner-occupied houses in Kincaid, Illinois
- 01 room
- 02 rooms
- 103 rooms
- 524 rooms
- 1415 rooms
- 686 rooms
- 957 rooms
- 498 rooms
- 179+ rooms

- Rooms in renter-occupied apartments in Kincaid, Illinois
- 81 room
- 22 rooms
- 263 rooms
- 734 rooms
- 155 rooms
- 76 rooms
- 117 rooms
- 38 rooms
- 39+ rooms


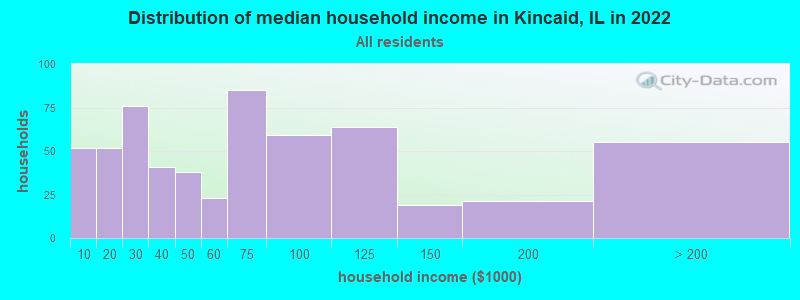
Kincaid, IL household income distribution

- 52Less than $10,000
- 52$10,000 to $19,999
- 76$20,000 to $29,999
- 41$30,000 to $39,999
- 38$40,000 to $49,999
- 23$50,000 to $59,999
- 85$60,000 to $74,999
- 59$75,000 to $99,999
- 64$100,000 to $124,999
- 19$125,000 to $149,999
- 21$150,000 to $199,999
- 55$200,000 or more
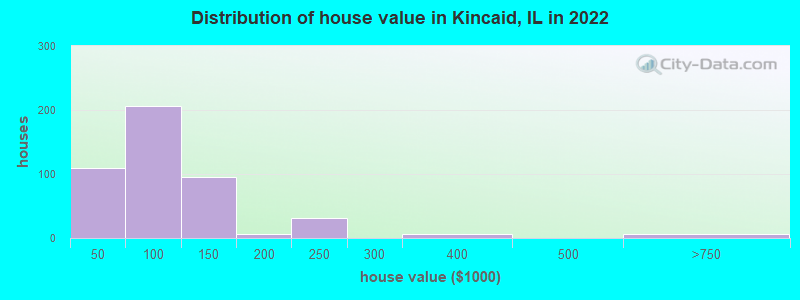
Home value of owner - occupied houses in 2022 in Kincaid, IL
-
- 3Less than $10,000
- 15$10,000 to $14,999
- 2$15,000 to $19,999
- 12$20,000 to $24,999
- 3$25,000 to $29,999
- 9$30,000 to $34,999
- 11$35,000 to $39,999
- 51$40,000 to $49,999
- 23$50,000 to $59,999
- 31$60,000 to $69,999
- 40$70,000 to $79,999
- 35$80,000 to $89,999
- 26$90,000 to $99,999
- 57$100,000 to $124,999
- 39$125,000 to $149,999
- 6$150,000 to $174,999
- 31$200,000 to $249,999
- 6$300,000 to $399,999
- 3$500,000 to $749,999
- 2$1,000,000 to $1,499,999
Rent paid by renters in 2022 in Kincaid, IL
-
- 4$100 to $149
- 4$200 to $249
- 2$250 to $299
- 12$300 to $349
- 8$350 to $399
- 21$400 to $449
- 6$450 to $499
- 3$500 to $549
- 9$550 to $599
- 8$600 to $649
- 11$750 to $799
- 57No cash rent


Percentage of workers working in this county: 50.1%
Number of people working at home: 3 (0.5% of all workers)
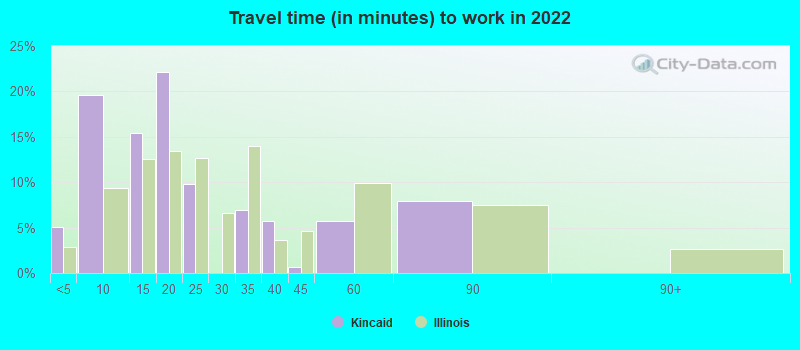
Travel time to work (commute)
- Less than 5 minutes: 16
- 5 to 9 minutes: 45
- 10 to 14 minutes: 14
- 15 to 19 minutes: 86
- 20 to 24 minutes: 139
- 25 to 29 minutes: 20
- 30 to 34 minutes: 100
- 35 to 39 minutes: 23
- 40 to 44 minutes: 17
- 45 to 59 minutes: 44
- 60 to 89 minutes: 22
- 90 or more minutes: 17
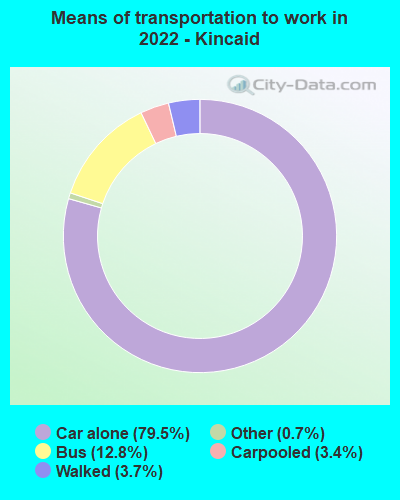
Means of transportation to work:
- Drove a car alone: 228 (71.2%)
- Carpooled: 9 (2.8%)
- Bus or trolley bus: 30 (9.4%)
- Taxi: 2 (0.6%)
- Walked: 9 (2.8%)
- Worked at home: 35 (10.9%)

- Unemployment by race in 2022
- Unemployment rate for White non-Hispanic residents
- 4.8%Males

- Year of entry for the foreign-born population in Kincaid, Illinois
- 01995 to March 2000
- 01990 to 1994
- 01985 to 1989
- 01980 to 1984
- 01975 to 1979
- 01970 to 1974
- 01965 to 1969
- 7Before 1965

First ancestries reported:
- English: 69 (21.9%)
- American: 59 (18.8%)
- German: 43 (13.7%)
- Italian: 33 (10.5%)
- Polish: 15 (4.8%)
- European: 14 (4.5%)
- Irish: 9 (2.9%)
- Scottish: 9 (2.9%)
- Dutch: 5 (1.6%)
- French: 4 (1.3%)
- Croatian: 3 (1.0%)
- Welsh: 1 (0.3%)
Most common places of birth for foreign-born residents (%):
| Kincaid: | 42.9% (3) |
| Illinois: | 40.4% (617,828) |
| Kincaid: | 28.6% (2) |
| Illinois: | 1.3% (20,130) |
| Kincaid: | 28.6% (2) |
| Illinois: | 2.1% (32,764) |
Place of birth for U.S.-born residents:
- This state: 1,010
- Other state: 110
- Northeast: 4
- Midwest: 8
- South: 34
- West: 64
92.9% of Kincaid residents lived in the same house 1 years ago.
Out of people who lived in different houses, 9.2% lived in this county.
Out of people who lived in different counties, 90.8% lived in Illinois.
| Kincaid: | 92.9% |
| State average: | 88.3% |
Education attainment for males 25 years and older:
- No schooling: 6
- Nursery to 4th grade: 0
- 5th and 6th grade: 0
- 7th and 8th grade: 7
- 9th grade: 6
- 10th grade: 13
- 11th grade: 1
- 12th grade, no diploma: 9
- High school graduate (or equivalency): 234
- Less than 1 year of college: 33
- Some college more than 1 year, no degree: 40
- Associate degree: 54
- Bachelor's degree: 29
- Master's degree: 0
- Professional school degree: 0
- Doctorate degree: 0

Education attainment for females 25 years and older:
- No schooling: 0
- Nursery to 4th grade: 0
- 5th and 6th grade: 0
- 7th and 8th grade: 0
- 9th grade: 3
- 10th grade: 13
- 11th grade: 18
- 12th grade, no diploma: 10
- High school graduate (or equivalency): 229
- Less than 1 year of college: 77
- Some college more than 1 year, no degree: 20
- Associate degree: 26
- Bachelor's degree: 32
- Master's degree: 6
- Professional school degree: 0
- Doctorate degree: 0


Housing units in structures:
- One, detached: 521
- One, attached: 2
- 5 to 9: 22
- 10 to 19: 26
- 20 to 49: 8
- Mobile homes: 44
Median worth of mobile homes: $52,270
Housing units lacking complete kitchen facilities in 2022: 2.7%
House/condo owner moved in on average 17 years ago
Renter moved in on average 5 years ago

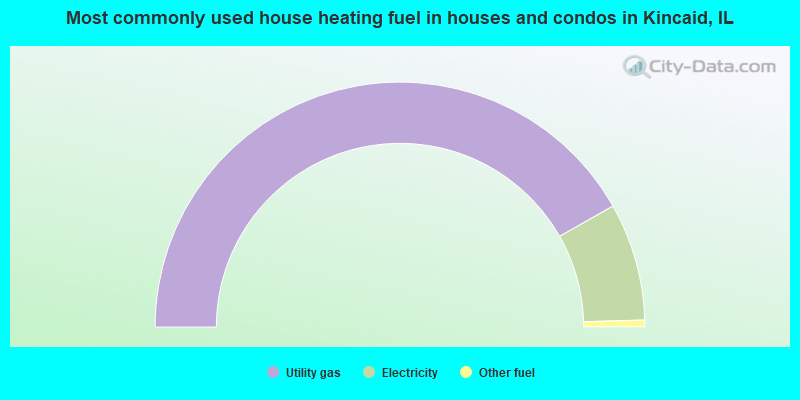
- 83.5%Utility gas
- 15.5%Electricity
- 0.9%Other fuel
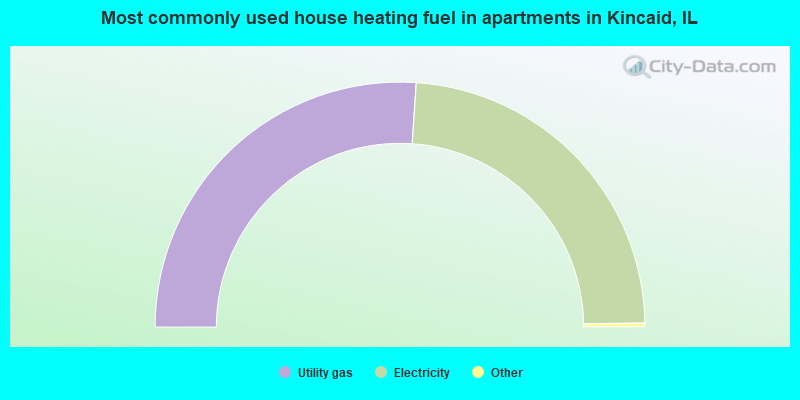
- 52.4%Utility gas
- 47.6%Electricity
Private vs. public school enrollment:
| Here: | 14.3% |
| Illinois: | 13.3% |
| Here: | 0.0% |
| Illinois: | 9.9% |
| Here: | 4.5% |
| Illinois: | 27.4% |


