Kingsgate, WA (Washington) Houses and Residents
| Kingsgate: | $869,436 |
| Washington: | $569,500 |
Total population: 13,065 (Urban population: 12,028, Rural population: 0)
Houses: 6,424 (6,195 occupied: 4,897 owner occupied, 1,416 renter occupied)
| % of renters here: | 22% |
| State: | 36% |
Housing density: 2,762 houses/condos per square mile
Median price asked for vacant for-sale houses and condos in 2022 in this county: $843,880.
Median contract rent in 2022: $1,913 (lower quartile is $1,497, upper quartile is over $2,000)
Median rent asked for vacant for-rent units in 2022: $1,762
Median gross rent in Kingsgate, WA in 2022: over $2,000
Housing units in Kingsgate with a mortgage: 3,419 (66 second mortgage, 313 home equity loan, 11 both second mortgage and home equity loan)
Houses without a mortgage: 953
Median household income for houses/condos with a mortgage: $150,591
Median household income for apartments without a mortgage: $114,590
Median monthly housing costs: $2,402
Compare current foreclosures near Kingsgate, WA:
| Photo | Address | Area | Beds / Baths | Price | Details |
|---|---|---|---|---|---|

|
#1
1st Ave S # 806
Seattle, WA 98104
|
806 sq. feet
|
1 baths 1 beds |
show details | |

|
#2
4th Ave W Apt 6a
Everett, WA 98204
|
1,346 sq. feet
|
3 baths 2 beds |
show details | |

|
#3
3rd Dr SE
Bothell, WA 98012
|
1,957 sq. feet
|
2 baths 4 beds |
show details | |

|
#4
100th St SW Apt B206
Everett, WA 98204
|
856 sq. feet
|
2 baths 2 beds |
show details | |

|
#5
57th Ave S Unit B104
Seattle, WA 98178
|
572 sq. feet
|
1 baths 1 beds |
show details | |

|
#6
49th Ave SE
Bothell, WA 98012
|
1,756 sq. feet
|
2 baths 3 beds |
show details | |

|
#7
230th Way SE
Sammamish, WA 98075
|
3,036 sq. feet
|
3 baths 4 beds |
show details | |

|
#8
74th St SE
Everett, WA 98203
|
1,784 sq. feet
|
3 baths 4 beds |
show details | |

|
#9
20th Ave SE
Bothell, WA 98021
|
1,552 sq. feet
|
2 baths 3 beds |
show details | |

|
#10
Woods Creek Rd
Monroe, WA 98272
|
2,496 sq. feet
|
2 baths 4 beds |
show details |
| Photo | Address | Area | Beds / Baths | Price | Details |
|---|---|---|---|---|---|

|
#11
NE 205th St
Kenmore, WA 98028
|
1,210 sq. feet
|
2 baths 3 beds |
show details | |

|
#12
S 124th St
Seattle, WA 98178
|
1,100 sq. feet
|
1 baths 2 beds |
show details | |

|
#13
58th Ln NE
Kenmore, WA 98028
|
2,700 sq. feet
|
2 baths 3 beds |
show details | |

|
#14
115th Ct SE
Renton, WA 98056
|
2,970 sq. feet
|
2 baths 4 beds |
show details | |

|
#15
5th Ave NE
Seattle, WA 98155
|
1,460 sq. feet
|
1 baths 3 beds |
show details | |

|
#16
114th Ave NE
Kirkland, WA 98033
|
1,950 sq. feet
|
2 baths 4 beds |
show details | |

|
#17
2nd Ave NW
Seattle, WA 98177
|
1,660 sq. feet
|
2 baths 3 beds |
show details | |

|
#18
Autumn Ln
Clinton, WA 98236
|
1,940 sq. feet
|
3 baths 2 beds |
show details | |

|
#19
W Casino Rd Apt 63
Everett, WA 98204
|
1,203 sq. feet
|
2 baths 2 beds |
show details | |

|
#20
8th Ave W
Seattle, WA 98119
|
1,400 sq. feet
|
1 baths 3 beds |
show details |
| Photo | Address | Area | Beds / Baths | Price | Details |
|---|---|---|---|---|---|

|
#21
SE 24th Way
Sammamish, WA 98075
|
770 sq. feet
|
1 baths 2 beds |
show details | |

|
#22
3rd Ave W
Seattle, WA 98119
|
1,410 sq. feet
|
1 baths 3 beds |
show details | |

|
#23
Howard Ave NE
Kingston, WA 98346
|
1,008 sq. feet
|
1 baths 2 beds |
show details | |

|
#24
320th Ave NE
Duvall, WA 98019
|
3,140 sq. feet
|
2 baths 3 beds |
show details | |

|
#25
152nd St SE
Monroe, WA 98272
|
2,573 sq. feet
|
3 baths 3 beds |
show details | |

|
#26
Puget Blvd SW
Seattle, WA 98106
|
1,820 sq. feet
|
1 baths 3 beds |
show details | |

|
#27
226th Pl NE
Sammamish, WA 98074
|
1,650 sq. feet
|
2 baths 3 beds |
show details | |

|
#28
224th St SE
Bothell, WA 98021
|
1,717 sq. feet
|
2 baths 3 beds |
show details | |

|
#29
E Lynn St # 98102
Seattle, WA 98102
|
792 sq. feet
|
1 baths - beds |
show details | |

|
#30
SE 5th St
Sammamish, WA 98074
|
3,180 sq. feet
|
2 baths 4 beds |
show details |
| Photo | Address | Area | Beds / Baths | Price | Details |
|---|---|---|---|---|---|

|
#31
210th St SE
Snohomish, WA 98296
|
1,580 sq. feet
|
3 baths 3 beds |
show details | |

|
#32
16th Ave SW
Seattle, WA 98106
|
970 sq. feet
|
1 baths 3 beds |
show details | |

|
#33
NE 190th St
Seattle, WA 98155
|
2,070 sq. feet
|
2 baths 5 beds |
show details | |

|
#34
199th St SW
Bothell, WA 98012
|
2,846 sq. feet
|
2 baths 4 beds |
show details | |

|
#35
NW 59th St
Seattle, WA 98107
|
1,110 sq. feet
|
1 baths 3 beds |
show details | |

|
#36
SE 47th Pl
Issaquah, WA 98029
|
2,610 sq. feet
|
2 baths 3 beds |
show details | |

|
#37
Lyons Ave NE
Renton, WA 98059
|
2,510 sq. feet
|
2 baths 3 beds |
show details | |

|
#38
126th Pl SE
Renton, WA 98056
|
2,450 sq. feet
|
2 baths 4 beds |
show details | |

|
#39
41st Ave SW
Seattle, WA 98116
|
1,420 sq. feet
|
1 baths 2 beds |
show details | |

|
#40
19th Ave S
Seattle, WA 98168
|
2,420 sq. feet
|
2 baths 2 beds |
show details |
| Photo | Address | Area | Beds / Baths | Price | Details |
|---|---|---|---|---|---|

|
#41
77th Ave S
Seattle, WA 98178
|
3,090 sq. feet
|
4 baths 6 beds |
show details | |

|
#42
19th Dr SE
Bothell, WA 98012
|
852 sq. feet
|
1 baths 3 beds |
show details | |

|
#43
93rd St SW
Everett, WA 98204
|
1,022 sq. feet
|
1 baths 3 beds |
show details | |

|
#44
NE 88th St
Seattle, WA 98115
|
2,200 sq. feet
|
2 baths 3 beds |
show details | |

|
#45
NE 5th St
Renton, WA 98056
|
1,930 sq. feet
|
2 baths 3 beds |
show details | |

|
#46
N Ridge Dr
Snohomish, WA 98290
|
2,033 sq. feet
|
3 baths 3 beds |
show details | |

|
#47
148th St SE
Everett, WA 98208
|
1,466 sq. feet
|
2 baths 3 beds |
show details | |

|
#48
Ravenna Ave NE
Seattle, WA 98125
|
1,660 sq. feet
|
2 baths 4 beds |
show details | |

|
#49
Cascadian Way
Bothell, WA 98012
|
1,492 sq. feet
|
2 baths 3 beds |
show details | |

|
Check over 1 million property listings on Foreclosure.com!
|
browse all offers | |||
Latest news about housing in Kingsgate, WA collected exclusively by city-data.com from local newspapers, TV, and radio stations

 | This rental home search is starting to feel hopeless! (49 replies) |
| How to find a rental home? (14 replies) |
| Sammamish tops the U.S. in household income (36 replies) |
| Good suburbs closer along major freeways (40 replies) |
| How much is avarage rent in Kirkland area? (11 replies) |
| Kingsgate/Totem Lake area vs Bothell (North creek area near Woodinville) (6 replies) |

Median year apartment built: 1987
Household type by relationship:
Households: 15,150- In family households: 12,443 (2,618 male householders, 1,253 female householders)
3,087 spouses, 4,336 children (4,162 natural, 49 adopted, 124 stepchildren), 228 grandchildren, 105 brothers or sisters, 192 parents, 0 foster children, 280 other relatives, 341 non-relatives
- In nonfamily households: 2,623 (940 male householders (704 living alone)), 1,241 female householders (1,111 living alone)), 441 nonrelatives
- In group quarters: 82
Size of family households: 1,521 2-persons, 955 3-persons, 948 4-persons, 398 5-persons, 112 6-persons, 49 7-or-more-persons.
Size of nonfamily households: 1,865 1-person, 402 2-persons, 35 3-persons.
2,383 married couples with children.
706 single-parent households (225 men, 481 women).
71.2% of residents of Kingsgate speak English at home.
6.8% of residents speak Spanish at home (67% speak English very well, 22% speak English well, 11% speak English not well).
8.7% of residents speak other Indo-European language at home (71% speak English very well, 19% speak English well, 6% speak English not well, 4% don't speak English at all).
12.9% of residents speak Asian or Pacific Island language at home (52% speak English very well, 27% speak English well, 18% speak English not well, 3% don't speak English at all).
0.5% of residents speak other language at home (88% speak English very well, 12% speak English well).
Foreign born population: 3,112 (21.6%)
(51.3% of them are naturalized citizens)
| Here: | 6.5 |
| State: | 6.5 |
| Here: | 4.9 |
| State: | 3.9 |

- Bedrooms in owner-occupied houses and condos in Kingsgate, Washington
- 0no bedroom
- 2311 bedroom
- 9472 bedrooms
- 1,6603 bedrooms
- 1,5664 bedrooms
- 4955+ bedrooms

- Bedrooms in renter-occupied apartments in Kingsgate, Washington
- 0no bedroom
- 1811 bedroom
- 5342 bedrooms
- 4653 bedrooms
- 2194 bedrooms
- 175+ bedrooms

- Cars and other vehicles available in Kingsgate in owner-occupied houses/condos
- 115no vehicle
- 1,6171 vehicle
- 2,0472 vehicles
- 8123 vehicles
- 1914 vehicles
- 1175+ vehicles

- Cars and other vehicles available in Kingsgate in renter-occupied apartments
- 145no vehicle
- 5311 vehicle
- 5422 vehicles
- 1683 vehicles
- 314 vehicles
- 05+ vehicles

- Rooms in owner-occupied houses in Kingsgate, Washington
- 01 room
- 02 rooms
- 2623 rooms
- 5524 rooms
- 7485 rooms
- 8696 rooms
- 7427 rooms
- 7478 rooms
- 9789+ rooms

- Rooms in renter-occupied apartments in Kingsgate, Washington
- 01 room
- 252 rooms
- 1253 rooms
- 4364 rooms
- 2425 rooms
- 3176 rooms
- 1027 rooms
- 598 rooms
- 1109+ rooms


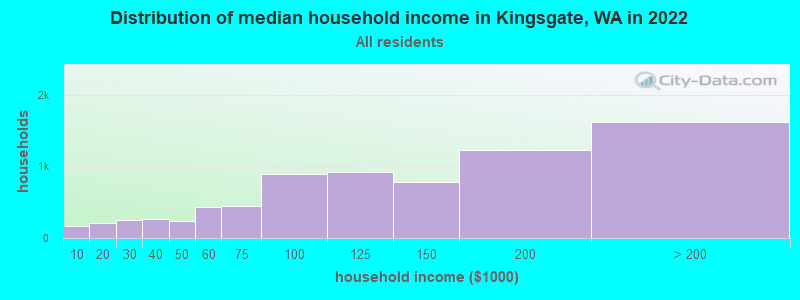
Kingsgate, WA household income distribution

- 172Less than $10,000
- 206$10,000 to $19,999
- 256$20,000 to $29,999
- 264$30,000 to $39,999
- 235$40,000 to $49,999
- 439$50,000 to $59,999
- 443$60,000 to $74,999
- 894$75,000 to $99,999
- 916$100,000 to $124,999
- 783$125,000 to $149,999
- 1,234$150,000 to $199,999
- 1,622$200,000 or more
Rent paid by renters in 2012_5yr in Kingsgate, WA
-
- 20Less than $100
- 18$100 to $149
- 1$150 to $199
- 11$200 to $249
- 72$250 to $299
- 10$300 to $349
- 25$400 to $449
- 7$450 to $499
- 59$500 to $549
- 30$550 to $599
- 41$600 to $649
- 13$650 to $699
- 12$700 to $749
- 9$750 to $799
- 125$800 to $899
- 183$900 to $999
- 169$1,000 to $1,249
- 171$1,250 to $1,499
- 272$1,500 to $1,999
- 58$2,000 or more
- 30No cash rent


Percentage of workers working in this county: 90.9%
Number of people working at home: 1,508 (17.2% of all workers)
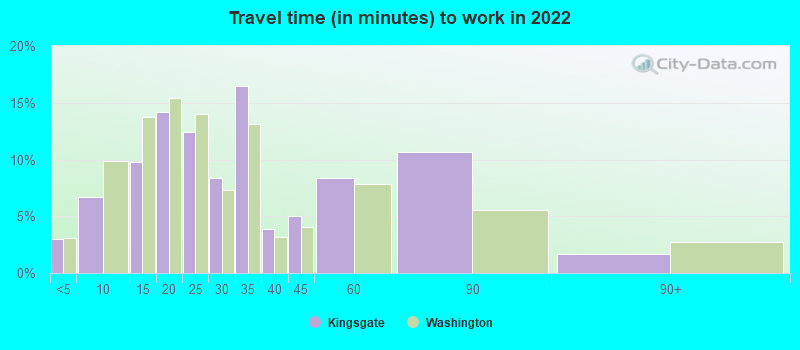
Travel time to work (commute)
- Less than 5 minutes: 158
- 5 to 9 minutes: 310
- 10 to 14 minutes: 827
- 15 to 19 minutes: 1,097
- 20 to 24 minutes: 1,186
- 25 to 29 minutes: 690
- 30 to 34 minutes: 1,439
- 35 to 39 minutes: 209
- 40 to 44 minutes: 228
- 45 to 59 minutes: 591
- 60 to 89 minutes: 508
- 90 or more minutes: 103
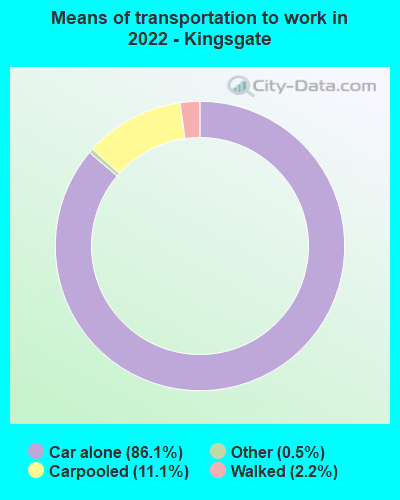
Means of transportation to work:
- Drove a car alone: 1,988 (64.8%)
- Carpooled: 224 (7.3%)
- Taxi: 15 (0.5%)
- Walked: 56 (1.8%)
- Worked at home: 1,508 (49.1%)

- Unemployment by race in 2022
- Unemployment rate for White non-Hispanic residents
- 4.0%Males
- 6.3%Females
- Unemployment rate for Asian residents
- 5.0%Males
- 2.1%Females
- Unemployment rate for other race residents
- 21.7%Females
- Unemployment rate for two or more race residents
- 5.4%Females
- Unemployment rate for Hispanic or Latino residents
- 11.9%Females

- Year of entry for the foreign-born population in Kingsgate, Washington
- 7082010 or later
- 1172000 to 2009
- 4501990 to 1999
- 6291980 to 1989
- 3081970 to 1979
- 178Before 1970

First ancestries reported:
- English: 567 (7.2%)
- European: 535 (6.8%)
- German: 459 (5.8%)
- Irish: 299 (3.8%)
- American: 274 (3.5%)
- Norwegian: 240 (3.0%)
- Iranian: 234 (3.0%)
- Eastern European: 202 (2.5%)
- Romanian: 133 (1.7%)
- French: 117 (1.5%)
- Italian: 114 (1.4%)
- Brazilian: 98 (1.2%)
- British: 96 (1.2%)
- Ukrainian: 79 (1.0%)
- Bulgarian: 76 (1.0%)
- Polish: 69 (0.9%)
- Swedish: 68 (0.9%)
- Russian: 61 (0.8%)
- Dutch: 53 (0.7%)
- Czech: 44 (0.6%)
- Israeli: 40 (0.5%)
- Lithuanian: 34 (0.4%)
- Croatian: 30 (0.4%)
- Portuguese: 29 (0.4%)
- Scottish: 29 (0.4%)
- Swiss: 26 (0.3%)
- Danish: 25 (0.3%)
- French Canadian: 24 (0.3%)
- Czechoslovakian: 18 (0.2%)
- Scandinavian: 18 (0.2%)
- Basque: 17 (0.2%)
- Canadian: 17 (0.2%)
- Welsh: 15 (0.2%)
- Scotch-Irish: 14 (0.2%)
- Yugoslavian: 12 (0.2%)
- Australian: 12 (0.2%)
- Northern European: 9 (0.1%)
- Hungarian: 9 (0.1%)
- Finnish: 8 (0.1%)
- Austrian: 8 (0.1%)
- Icelander: 6 (0.08%)
Most common places of birth for foreign-born residents (%):
| Kingsgate: | 11.7% (340) |
| Washington: | 100.0% (-1) |
| Kingsgate: | 8.1% (235) |
| Washington: | 100.0% (-1) |
| Kingsgate: | 8.0% (232) |
| Washington: | 100.0% (-1) |
| Kingsgate: | 6.0% (176) |
| Washington: | 100.0% (-1) |
| Kingsgate: | 5.7% (166) |
| Washington: | 100.0% (-1) |
| Kingsgate: | 5.2% (152) |
| Washington: | 100.0% (-1) |
| Kingsgate: | 4.1% (120) |
| Washington: | 100.0% (-1) |
| Kingsgate: | 4.0% (118) |
| Washington: | 100.0% (-1) |
| Kingsgate: | 3.8% (112) |
| Washington: | 100.0% (-1) |
| Kingsgate: | 3.7% (109) |
| Washington: | 100.0% (-1) |
| Kingsgate: | 3.1% (91) |
| Washington: | 100.0% (-1) |
| Kingsgate: | 3.0% (86) |
| Washington: | 100.0% (-1) |
| Kingsgate: | 2.9% (85) |
| Washington: | 100.0% (-1) |
| Kingsgate: | 2.7% (80) |
| Washington: | 100.0% (-1) |
| Kingsgate: | 2.5% (72) |
| Washington: | 100.0% (-1) |
| Kingsgate: | 2.5% (72) |
| Washington: | 100.0% (-1) |
| Kingsgate: | 1.8% (53) |
| Washington: | 100.0% (-1) |
| Kingsgate: | 1.8% (52) |
| Washington: | 100.0% (-1) |
| Kingsgate: | 1.8% (52) |
| Washington: | 100.0% (-1) |
| Kingsgate: | 1.7% (49) |
| Washington: | 100.0% (-1) |
| Kingsgate: | 1.6% (48) |
| Washington: | 100.0% (-1) |
| Kingsgate: | 1.5% (45) |
| Washington: | 100.0% (-1) |
Place of birth for U.S.-born residents:
- This state: 5,963
- Other state: 5,033
- Northeast: 572
- Midwest: 1,026
- South: 787
- West: 2,639
88.0% of Kingsgate residents lived in the same house 1 years ago.
Out of people who lived in different houses, 40.4% lived in this county.
Out of people who lived in different counties, 56.0% lived in Washington.
| Kingsgate: | 88.0% |
| State average: | 85.2% |
Education attainment for males 25 years and older:
- No schooling: 37
- Nursery to 4th grade: 0
- 5th and 6th grade: 8
- 7th and 8th grade: 6
- 9th grade: 6
- 10th grade: 73
- 11th grade: 37
- 12th grade, no diploma: 125
- High school graduate (or equivalency): 928
- Less than 1 year of college: 346
- Some college more than 1 year, no degree: 871
- Associate degree: 717
- Bachelor's degree: 1,938
- Master's degree: 911
- Professional school degree: 60
- Doctorate degree: 151

Education attainment for females 25 years and older:
- No schooling: 109
- Nursery to 4th grade: 43
- 5th and 6th grade: 27
- 7th and 8th grade: 0
- 9th grade: 42
- 10th grade: 13
- 11th grade: 0
- 12th grade, no diploma: 68
- High school graduate (or equivalency): 674
- Less than 1 year of college: 382
- Some college more than 1 year, no degree: 995
- Associate degree: 699
- Bachelor's degree: 1,995
- Master's degree: 1,111
- Professional school degree: 105
- Doctorate degree: 98


Housing units in structures:
- One, detached: 3,807
- One, attached: 789
- Two: 139
- 3 or 4: 166
- 5 to 9: 769
- 10 to 19: 361
- 20 to 49: 245
- 50 or more: 123
- Mobile homes: 21
Median worth of mobile homes: $211,061
Housing units lacking complete kitchen facilities in 2022: 0.3%
House/condo owner moved in on average 14 years ago
Renter moved in on average -1 years ago

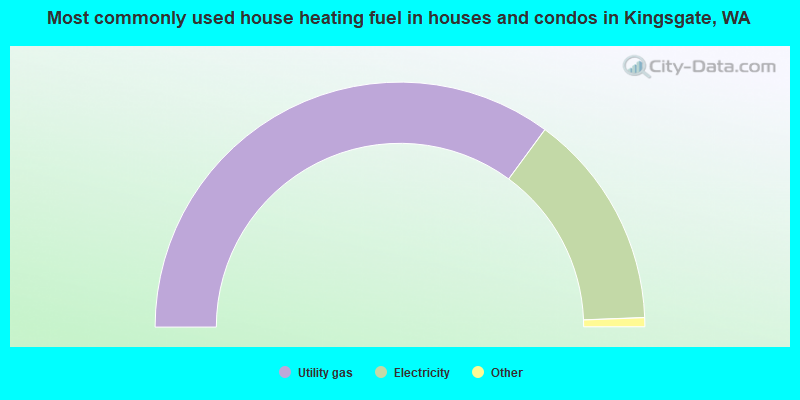
- 70.1%Utility gas
- 28.6%Electricity
- 1.0%Bottled, tank, or LP gas
- 0.2%Wood
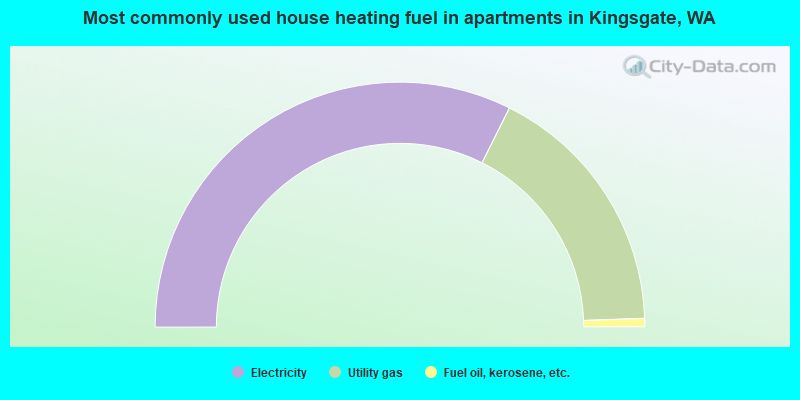
- 64.7%Electricity
- 34.1%Utility gas
- 1.1%Fuel oil, kerosene, etc.
Private vs. public school enrollment:
| Here: | 3.6% |
| Washington: | 12.4% |
| Here: | 3.2% |
| Washington: | 9.2% |
| Here: | 12.2% |
| Washington: | 16.5% |


