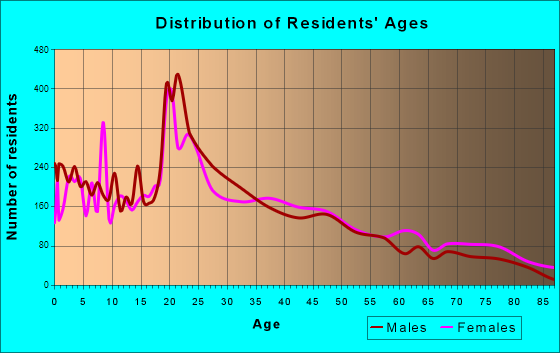
Kingsville, TX (Texas) Houses and Residents
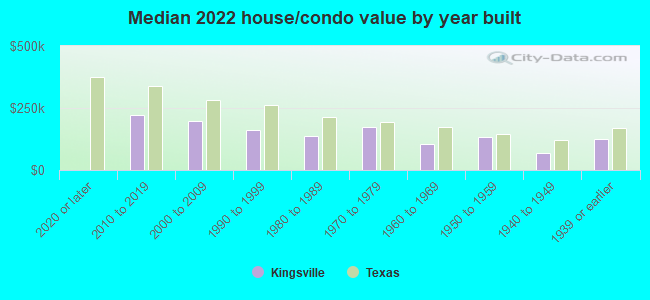
| Kingsville: | $137,584 |
| Texas: | $275,400 |
Mean price in 2022:
Detached houses: $163,224
Here: $163,224 State: $369,058 Townhouses or other attached units: $148,625
Here: $148,625 State: $327,631 Mobile homes: $43,186
Here: $43,186 State: $124,413
Total population: 26,529 (Urban population: 25,135 (all inside urban clusters), Rural population: 406 (all nonfarm))
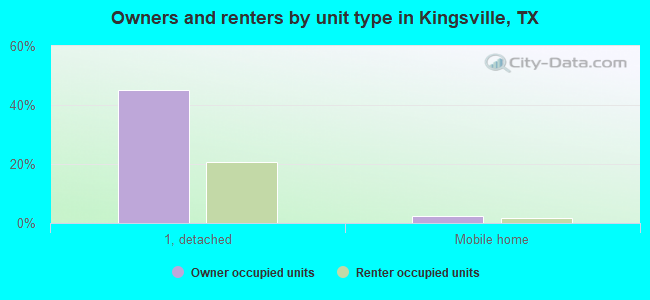
Houses: 11,999 (10,308 occupied: 4,862 owner occupied, 5,600 renter occupied)
| % of renters here: | 54% |
| State: | 38% |
Housing density: 867 houses/condos per square mile
Median price asked for vacant for-sale houses and condos in 2022: $183,938.
Median contract rent in 2022: $761 (lower quartile is $556, upper quartile is $997)
Median rent asked for vacant for-rent units in 2022: $1,179
Median gross rent in Kingsville, TX in 2022: $1,003
Housing units in Kingsville with a mortgage: 2,440 (68 second mortgage, 0 home equity loan, 74 both second mortgage and home equity loan)
Houses without a mortgage: 0
Median household income for houses/condos with a mortgage: $93,576
Median household income for apartments without a mortgage: $54,982
Median monthly housing costs: $987
Compare current foreclosures near Kingsville, TX:
| Photo | Address | Area | Beds / Baths | Price | Details |
|---|---|---|---|---|---|

|
#1
John St
Kingsville, TX 78363
|
1,859 sq. feet
|
2 baths 4 beds |
show details | |

|
#2
Kelly St
Kingsville, TX 78363
|
1,766 sq. feet
|
2 baths 4 beds |
show details | |

|
#3
Louisiana St
Kingsville, TX 78363
|
1,232 sq. feet
|
2 baths - beds |
show details | |

|
#4
Brook Ln
Kingsville, TX 78363
|
1,606 sq. feet
|
2 baths - beds |
show details | |

|
#5
E B Ave
Kingsville, TX 78363
|
924 sq. feet
|
1 baths - beds |
show details | |

|
#6
E Fordyce Ave
Kingsville, TX 78363
|
1,256 sq. feet
|
1 baths - beds |
show details | |

|
#7
W D Ave
Kingsville, TX 78363
|
- sq. feet
|
- baths - beds |
show details | |

|
#8
Golf Course Rd, Apt 511
Kingsville, TX 78363
|
- sq. feet
|
- baths - beds |
show details | |

|
#9
W Private Road 2137
Kingsville, TX 78363
|
- sq. feet
|
- baths - beds |
show details | |

|
#10
Carreta Park
Bishop, TX 78343
|
2,146 sq. feet
|
2 baths 3 beds |
show details |
| Photo | Address | Area | Beds / Baths | Price | Details |
|---|---|---|---|---|---|

|
#11
S County Road 1070
Riviera, TX 78379
|
- sq. feet
|
2 baths 2 beds |
show details | |

|
#12
W 6th St
Bishop, TX 78343
|
1,800 sq. feet
|
- baths - beds |
show details | |

|
#13
E Joyce St
Bishop, TX 78343
|
1,094 sq. feet
|
- baths - beds |
show details | |

|
#14
County Road 16
Bishop, TX 78343
|
2,449 sq. feet
|
- baths - beds |
show details | |

|
#15
Badger Ln
Alice, TX 78332
|
- sq. feet
|
- baths - beds |
show details | |

|
Check over 1 million property listings on Foreclosure.com!
|
browse all offers | |||

Latest news about housing in Kingsville, TX collected exclusively by city-data.com from local newspapers, TV, and radio stations

 | Affordable houses (22 replies) |
| RIP George Floyd, Houston misses you (139 replies) |
| Southside apartments (0 replies) |
| Is Texas Right for Us? (48 replies) |
| Took position at TAMUK...live in Kingsville or CC? (3 replies) |
| Question from retirees moving to Austin - prefer not to be in flood zone (66 replies) |
Median year apartment built: 1980
Household type by relationship:
Households: 25,944- Male householders: 4,770 (1,745 living alone), Female householders: 5,395 (1,214 living alone)
3,346 spouses (3,346 opposite-sex spouses), 749 unmarried partners, (749 opposite-sex unmarried partners), 6,920 children (6,574 natural, 106 adopted, 239 stepchildren), 658 grandchildren, 414 brothers or sisters, 173 parents, 0 foster children, 391 other relatives, 1,391 non-relatives
- In group quarters: 1,732
Size of family households: 2,340 2-persons, 1,404 3-persons, 1,467 4-persons, 620 5-persons, 96 6-persons, 67 7-or-more-persons.
Size of nonfamily households: 3,119 1-person, 726 2-persons, 352 3-persons, 293 4-persons.
2,130 married couples with children.
2,965 single-parent households (248 men, 2,717 women).
62.8% of residents of Kingsville speak English at home.
34.3% of residents speak Spanish at home (81% speak English very well, 15% speak English well, 5% speak English not well).
0.7% of residents speak other Indo-European language at home (23% speak English very well, 2% speak English well, 40% speak English not well, 35% don't speak English at all).
2.1% of residents speak Asian or Pacific Island language at home (91% speak English very well, 9% speak English well).
0.6% of residents speak other language at home (66% speak English very well, 34% speak English well).
Foreign born population: 1,765 (6.8%)
(52.2% of them are naturalized citizens)
| Here: | 5.7 |
| State: | 6.3 |
| Here: | 4.6 |
| State: | 4.0 |
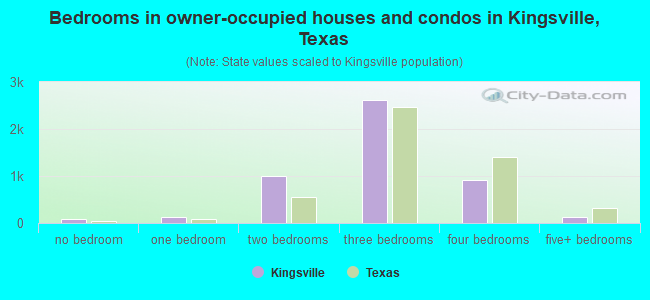
- Bedrooms in owner-occupied houses and condos in Kingsville, Texas
- 78no bedroom
- 1321 bedroom
- 1,0062 bedrooms
- 2,6183 bedrooms
- 9084 bedrooms
- 1205+ bedrooms
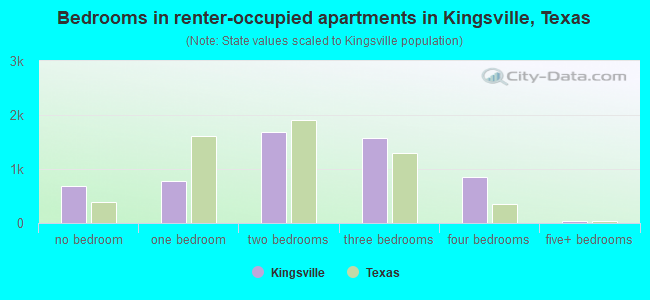
- Bedrooms in renter-occupied apartments in Kingsville, Texas
- 680no bedroom
- 7821 bedroom
- 1,6882 bedrooms
- 1,5733 bedrooms
- 8474 bedrooms
- 325+ bedrooms
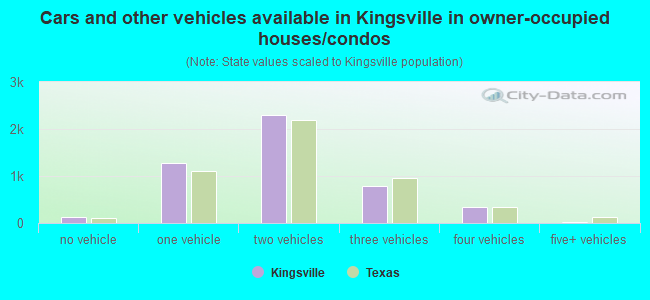
- Cars and other vehicles available in Kingsville in owner-occupied houses/condos
- 138no vehicle
- 1,2871 vehicle
- 2,2922 vehicles
- 7813 vehicles
- 3374 vehicles
- 265+ vehicles
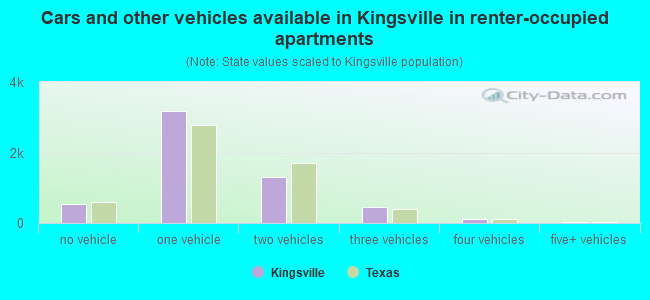
- Cars and other vehicles available in Kingsville in renter-occupied apartments
- 535no vehicle
- 3,1851 vehicle
- 1,2992 vehicles
- 4473 vehicles
- 1044 vehicles
- 325+ vehicles
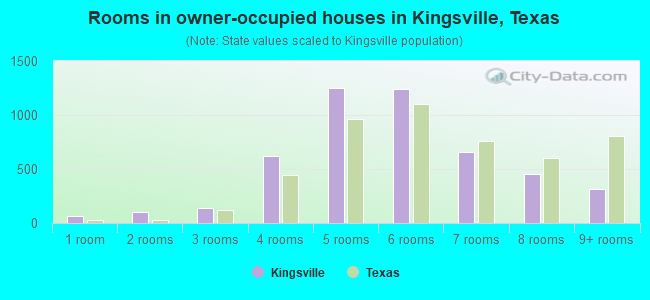
- Rooms in owner-occupied houses in Kingsville, Texas
- 641 room
- 1062 rooms
- 1433 rooms
- 6204 rooms
- 1,2525 rooms
- 1,2456 rooms
- 6607 rooms
- 4568 rooms
- 3179+ rooms
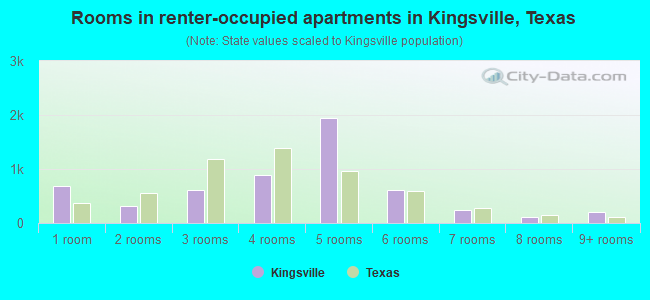
- Rooms in renter-occupied apartments in Kingsville, Texas
- 6801 room
- 3122 rooms
- 6073 rooms
- 8944 rooms
- 1,9375 rooms
- 6136 rooms
- 2457 rooms
- 1168 rooms
- 1979+ rooms
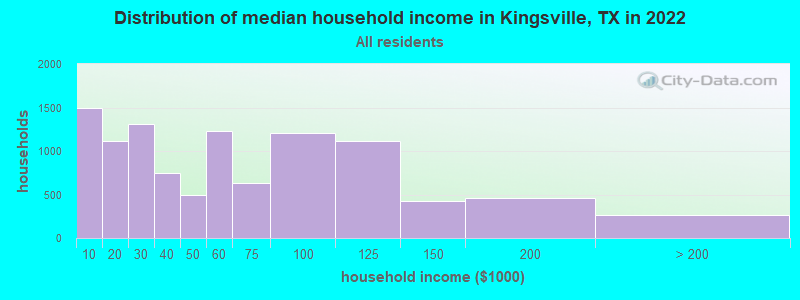
Kingsville, TX household income distribution

- 1,495Less than $10,000
- 1,112$10,000 to $19,999
- 1,312$20,000 to $29,999
- 744$30,000 to $39,999
- 498$40,000 to $49,999
- 1,229$50,000 to $59,999
- 636$60,000 to $74,999
- 1,204$75,000 to $99,999
- 1,115$100,000 to $124,999
- 430$125,000 to $149,999
- 463$150,000 to $199,999
- 261$200,000 or more
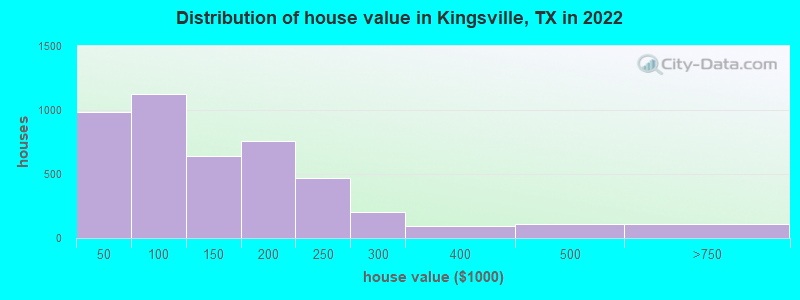
Home value of owner - occupied houses in 2022 in Kingsville, TX
-
- 128Less than $10,000
- 39$10,000 to $14,999
- 264$15,000 to $19,999
- 72$20,000 to $24,999
- 22$25,000 to $29,999
- 52$30,000 to $34,999
- 140$35,000 to $39,999
- 264$40,000 to $49,999
- 137$50,000 to $59,999
- 194$60,000 to $69,999
- 115$70,000 to $79,999
- 314$80,000 to $89,999
- 97$90,000 to $99,999
- 357$100,000 to $124,999
- 285$125,000 to $149,999
- 319$150,000 to $174,999
- 438$175,000 to $199,999
- 469$200,000 to $249,999
- 204$250,000 to $299,999
- 95$300,000 to $399,999
- 109$400,000 to $499,999
- 112$500,000 to $749,999
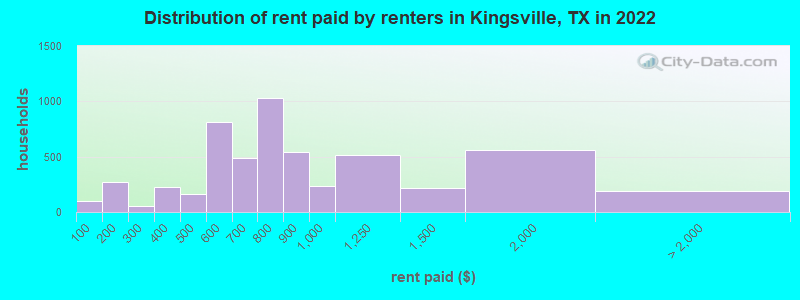
Rent paid by renters in 2022 in Kingsville, TX
-
- 101Less than $100
- 267$100 to $149
- 44$200 to $249
- 7$250 to $299
- 102$300 to $349
- 121$350 to $399
- 59$400 to $449
- 104$450 to $499
- 538$500 to $549
- 276$550 to $599
- 223$600 to $649
- 268$650 to $699
- 578$700 to $749
- 449$750 to $799
- 541$800 to $899
- 237$900 to $999
- 512$1,000 to $1,249
- 213$1,250 to $1,499
- 558$1,500 to $1,999
- 189No cash rent
Percentage of workers working in this county: 76.0%
Number of people working at home: 800 (6.8% of all workers)
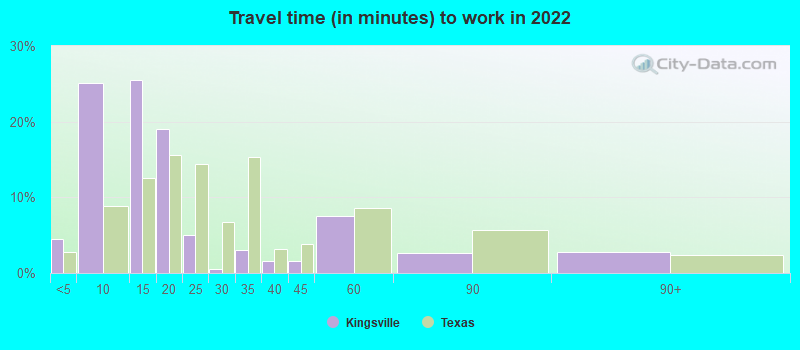
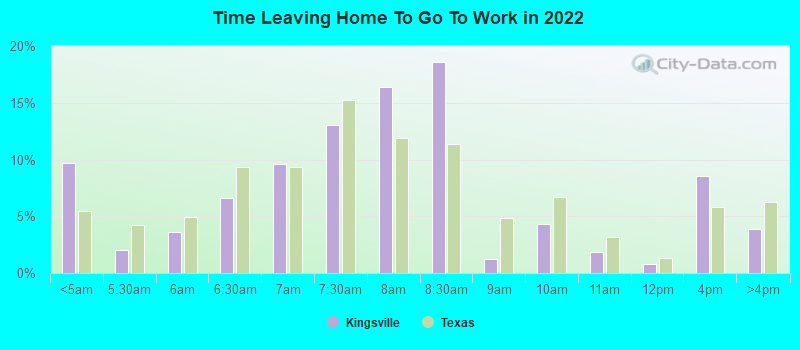
Travel time to work (commute)
- Less than 5 minutes: 491
- 5 to 9 minutes: 2,900
- 10 to 14 minutes: 2,496
- 15 to 19 minutes: 1,670
- 20 to 24 minutes: 561
- 25 to 29 minutes: 62
- 30 to 34 minutes: 276
- 35 to 39 minutes: 194
- 40 to 44 minutes: 481
- 45 to 59 minutes: 823
- 60 to 89 minutes: 473
- 90 or more minutes: 182
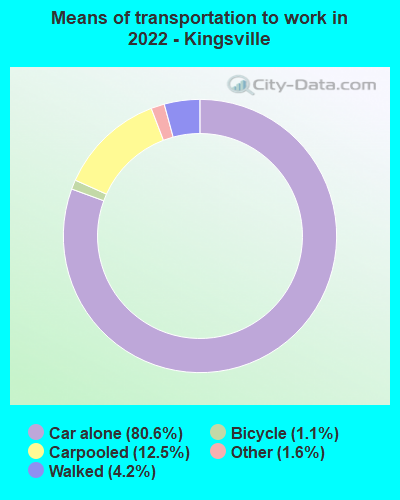
Means of transportation to work:
- Drove a car alone: 8,277 (72.4%)
- Carpooled: 1,399 (12.2%)
- Taxi: 198 (1.7%)
- Bicycle: 109 (1.0%)
- Walked: 464 (4.1%)
- Worked at home: 800 (7.0%)
- Unemployment by race in 2022
- Unemployment rate for White non-Hispanic residents
- 7.6%Males
- 3.2%Females
- Unemployment rate for Black residents
- 33.4%Males
- 7.5%Females
- Unemployment rate for other race residents
- 2.4%Males
- Unemployment rate for two or more race residents
- 17.1%Males
- 2.2%Females
- Unemployment rate for Hispanic or Latino residents
- 7.4%Males
- 3.8%Females
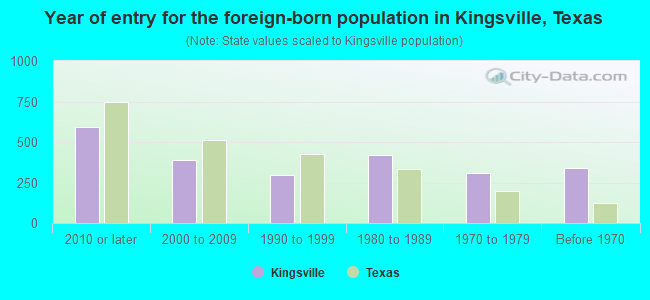
- Year of entry for the foreign-born population in Kingsville, Texas
- 5922010 or later
- 3892000 to 2009
- 2941990 to 1999
- 4191980 to 1989
- 3101970 to 1979
- 337Before 1970
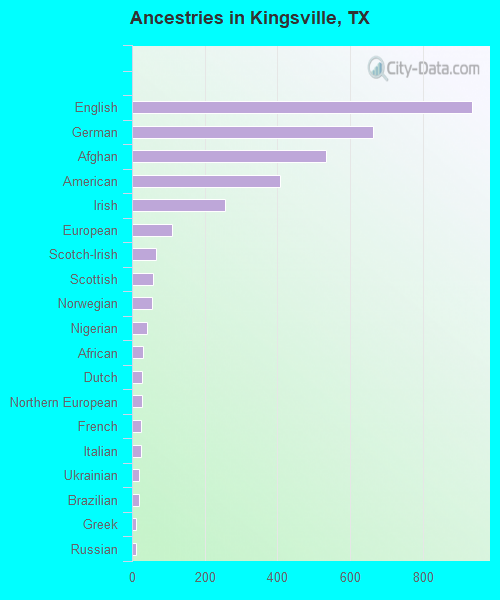
First ancestries reported:
- English: 936 (5.1%)
- German: 663 (3.6%)
- Afghan: 534 (2.9%)
- American: 407 (2.2%)
- Irish: 257 (1.4%)
- European: 111 (0.6%)
- Scotch-Irish: 66 (0.4%)
- Scottish: 59 (0.3%)
- Norwegian: 56 (0.3%)
- Nigerian: 42 (0.2%)
- African: 31 (0.2%)
- Dutch: 27 (0.1%)
- Northern European: 27 (0.1%)
- French: 24 (0.1%)
- Italian: 24 (0.1%)
- Ukrainian: 20 (0.1%)
- Brazilian: 18 (0.10%)
- Greek: 10 (0.05%)
- Russian: 10 (0.05%)
- Polish: 7 (0.04%)
Most common places of birth for foreign-born residents (%):
| Kingsville: | 45.2% (797) |
| Texas: | 48.4% (2,411,723) |
| Kingsville: | 28.3% (500) |
| Texas: | 0.3% (13,197) |
| Kingsville: | 5.8% (102) |
| Texas: | 2.1% (103,148) |
| Kingsville: | 5.0% (88) |
| Texas: | 1.9% (96,110) |
| Kingsville: | 3.5% (62) |
| Texas: | 6.1% (306,347) |
| Kingsville: | 3.5% (61) |
| Texas: | 2.3% (115,558) |
| Kingsville: | 3.1% (55) |
| Texas: | 3.0% (147,182) |
| Kingsville: | 2.9% (51) |
| Texas: | 0.3% (15,368) |
| Kingsville: | 2.7% (47) |
| Texas: | 0.8% (37,989) |
| Kingsville: | 2.4% (43) |
| Texas: | 0.2% (8,808) |
| Kingsville: | 1.5% (27) |
| Texas: | 0.4% (21,746) |
Place of birth for U.S.-born residents:
- This state: 20,557
- Other state: 3,216
- Northeast: 142
- Midwest: 704
- South: 1,212
- West: 1,171
85.6% of Kingsville residents lived in the same house 1 years ago.
Out of people who lived in different houses, 24.8% lived in this county.
Out of people who lived in different counties, 82.8% lived in Texas.
| Kingsville: | 85.6% |
| State average: | 85.7% |
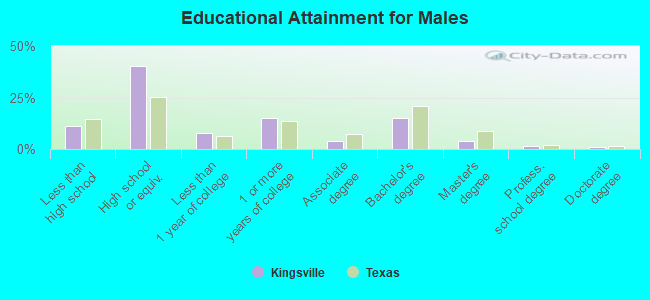
Education attainment for males 25 years and older:
- No schooling: 188
- Nursery to 4th grade: 41
- 5th and 6th grade: 44
- 7th and 8th grade: 122
- 9th grade: 137
- 10th grade: 55
- 11th grade: 139
- 12th grade, no diploma: 91
- High school graduate (or equivalency): 2,913
- Less than 1 year of college: 564
- Some college more than 1 year, no degree: 1,076
- Associate degree: 270
- Bachelor's degree: 1,088
- Master's degree: 286
- Professional school degree: 109
- Doctorate degree: 72
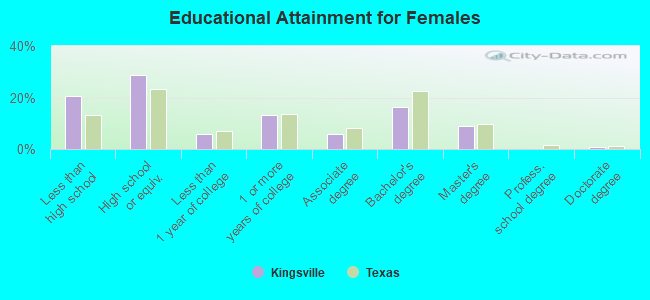
Education attainment for females 25 years and older:
- No schooling: 208
- Nursery to 4th grade: 124
- 5th and 6th grade: 280
- 7th and 8th grade: 212
- 9th grade: 205
- 10th grade: 110
- 11th grade: 155
- 12th grade, no diploma: 123
- High school graduate (or equivalency): 1,968
- Less than 1 year of college: 409
- Some college more than 1 year, no degree: 907
- Associate degree: 400
- Bachelor's degree: 1,126
- Master's degree: 606
- Professional school degree: 0
- Doctorate degree: 46


Housing units in structures:
- One, detached: 7,662
- One, attached: 168
- Two: 399
- 3 or 4: 822
- 5 to 9: 803
- 10 to 19: 341
- 20 to 49: 416
- 50 or more: 781
- Mobile homes: 601
Housing units lacking complete kitchen facilities in 2022: 5.2%
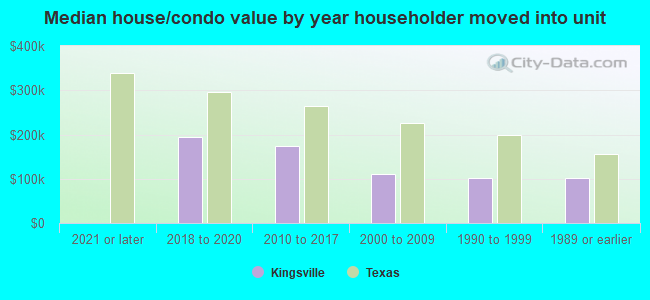
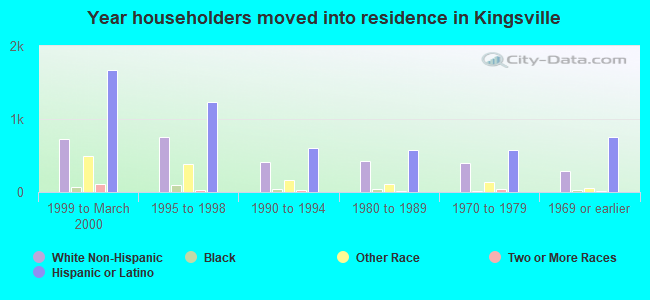
House/condo owner moved in on average 12 years ago
Renter moved in on average 3 years ago
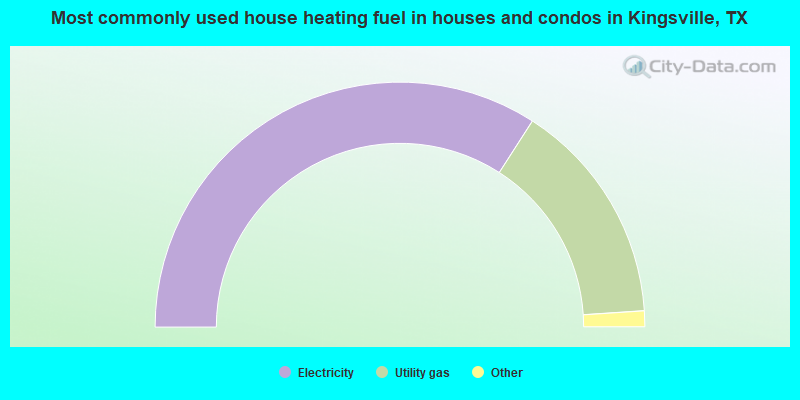
- 68.2%Electricity
- 29.7%Utility gas
- 1.4%Other fuel
- 0.7%Bottled, tank, or LP gas
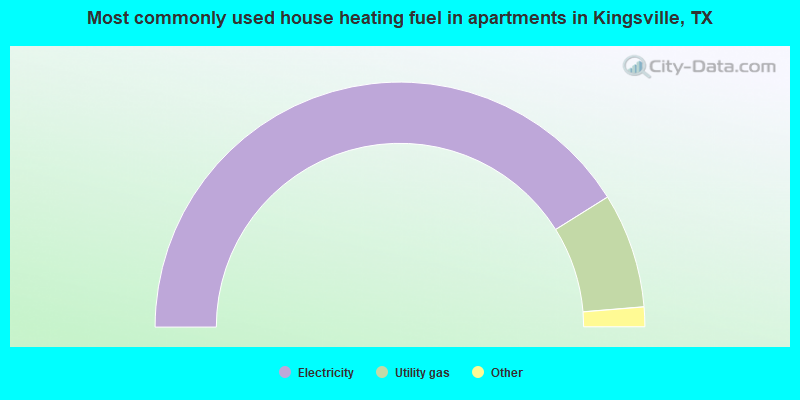
- 82.3%Electricity
- 15.2%Utility gas
- 1.8%No fuel used
- 0.7%Bottled, tank, or LP gas
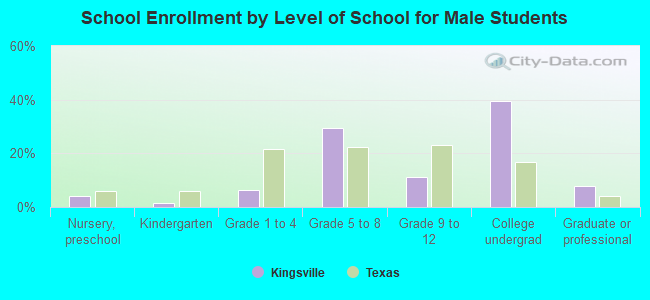
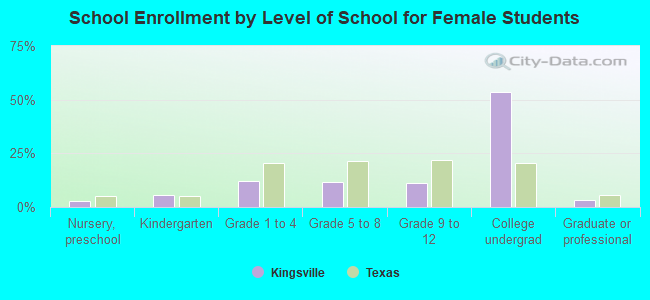
Private vs. public school enrollment:
| Here: | 3.6% |
| Texas: | 8.8% |
| Here: | 1.5% |
| Texas: | 8.0% |
| Here: | 9.9% |
| Texas: | 16.2% |