Kirbyville, TX (Texas) Houses and Residents
| Kirbyville: | $97,200 |
| Texas: | $275,400 |
Mean price in 2022:
Detached houses: $111,949
Here: $111,949 State: $369,058 Townhouses or other attached units: $91,454
Here: $91,454 State: $327,631 Mobile homes: $68,137
Here: $68,137 State: $124,413
Total population: 2,129 (Urban population: 0, Rural population: 2,061 (3 farm, 2,058 nonfarm))
Houses: 1,064 (913 occupied: 553 owner occupied, 373 renter occupied)
| % of renters here: | 40% |
| State: | 38% |
Housing density: 437 houses/condos per square mile
Median price asked for vacant for-sale houses and condos in 2022: $73,609.
Median contract rent in 2022: $525 (lower quartile is $270, upper quartile is $652)
Median rent asked for vacant for-rent units in 2022: $514
Median gross rent in Kirbyville, TX in 2022: $615
Housing units in Kirbyville with a mortgage: 187 (0 second mortgage, 0 home equity loan, 0 both second mortgage and home equity loan)
Houses without a mortgage: 27
Median household income for houses/condos with a mortgage: $69,264
Median household income for apartments without a mortgage: $31,718
Median monthly housing costs: $580
Compare current foreclosures near Kirbyville, TX:
| Photo | Address | Area | Beds / Baths | Price | Details |
|---|---|---|---|---|---|

|
#1
Fm 82w
Kirbyville, TX 75956
|
1,972 sq. feet
|
2 baths 4 beds |
show details | |

|
#2
W Lavielle St
Kirbyville, TX 75956
|
- sq. feet
|
- baths - beds |
show details | |

|
#3
County Road 482
Kirbyville, TX 75956
|
- sq. feet
|
- baths - beds |
show details | |

|
#4
Martin Luther King St
Kirbyville, TX 75956
|
- sq. feet
|
- baths - beds |
show details | |

|
#5
County Road 3075
Kirbyville, TX 75956
|
- sq. feet
|
- baths - beds |
show details | |

|
#6
County Road 415
Kirbyville, TX 75956
|
- sq. feet
|
- baths - beds |
show details | |

|
#7
County Road 336
Kirbyville, TX 75956
|
- sq. feet
|
- baths - beds |
show details | |

|
#8
County Road 713
Buna, TX 77612
|
1,161 sq. feet
|
1 baths 3 beds |
$189,900
|
show details |

|
#9
Private Road 8417
Woodville, TX 75979
|
1,644 sq. feet
|
2 baths 3 beds |
$367,500
|
show details |

|
#10
S Vallie Ave
Kirbyville, TX 75956
|
- sq. feet
|
- baths - beds |
show details |
| Photo | Address | Area | Beds / Baths | Price | Details |
|---|---|---|---|---|---|

|
#11
County Road 480
Kirbyville, TX 75956
|
- sq. feet
|
- baths - beds |
show details | |

|
#12
County Road 474
Kirbyville, TX 75956
|
- sq. feet
|
- baths - beds |
show details | |

|
#13
County Road 700
Kirbyville, TX 75956
|
- sq. feet
|
- baths - beds |
show details | |

|
#14
County Road 761
Buna, TX 77612
|
- sq. feet
|
- baths - beds |
show details | |

|
#15
County Road 296
Jasper, TX 75951
|
- sq. feet
|
- baths - beds |
show details | |

|
#16
County Road 4575
Spurger, TX 77660
|
912 sq. feet
|
- baths - beds |
show details | |

|
#17
Private Road 5260
Buna, TX 77612
|
- sq. feet
|
- baths - beds |
show details | |

|
#18
County Road 351
Jasper, TX 75951
|
- sq. feet
|
- baths - beds |
show details | |

|
#19
Martin Luther King Dr
Newton, TX 75966
|
- sq. feet
|
- baths - beds |
show details | |

|
Check over 1 million property listings on Foreclosure.com!
|
browse all offers | |||

Latest news about housing in Kirbyville, TX collected exclusively by city-data.com from local newspapers, TV, and radio stations

 | How much has Austin changed for the worst? (180 replies) |
| Is it true that Texans do not like to be referred to as Southerners? (715 replies) |
| Is East Texas culturally part of the Deep South? (585 replies) |
| After moving to Austin did anything surprise you? (115 replies) |
| Worst Small Town In Texas (133 replies) |
| kirbyville? relocating? (4 replies) |

Median year apartment built: 1983
Household type by relationship:
Households: 2,402- Male householders: 351 (92 living alone), Female householders: 549 (230 living alone)
273 spouses (273 opposite-sex spouses), 54 unmarried partners, (54 opposite-sex unmarried partners), 629 children (509 natural, 85 adopted, 34 stepchildren), 134 grandchildren, 0 brothers or sisters, 30 parents, 0 foster children, 195 other relatives, 99 non-relatives
- In group quarters: 85
Size of family households: 187 2-persons, 108 3-persons, 111 4-persons, 71 5-persons, 34 6-persons, 27 7-or-more-persons.
Size of nonfamily households: 339 1-person, 48 2-persons.
128 married couples with children.
285 single-parent households (45 men, 240 women).
91.9% of residents of Kirbyville speak English at home.
5.9% of residents speak Spanish at home (28% speak English very well, 63% speak English well, 8% speak English not well).
2.2% of residents speak other Indo-European language at home (50% speak English well, 50% speak English not well).
Foreign born population: 53 (2.2%)
(0.0% of them are naturalized citizens)
| Here: | 5.6 |
| State: | 6.3 |
| Here: | 3.9 |
| State: | 4.0 |

- Bedrooms in owner-occupied houses and condos in Kirbyville, Texas
- 4no bedroom
- 271 bedroom
- 1942 bedrooms
- 2263 bedrooms
- 794 bedrooms
- 225+ bedrooms

- Bedrooms in renter-occupied apartments in Kirbyville, Texas
- 0no bedroom
- 881 bedroom
- 1962 bedrooms
- 603 bedrooms
- 304 bedrooms
- 05+ bedrooms

- Cars and other vehicles available in Kirbyville in owner-occupied houses/condos
- 24no vehicle
- 1831 vehicle
- 2472 vehicles
- 703 vehicles
- 304 vehicles
- 05+ vehicles

- Cars and other vehicles available in Kirbyville in renter-occupied apartments
- 96no vehicle
- 1651 vehicle
- 542 vehicles
- 163 vehicles
- 424 vehicles
- 05+ vehicles

- Rooms in owner-occupied houses in Kirbyville, Texas
- 41 room
- 02 rooms
- 393 rooms
- 864 rooms
- 1335 rooms
- 1606 rooms
- 617 rooms
- 538 rooms
- 189+ rooms

- Rooms in renter-occupied apartments in Kirbyville, Texas
- 01 room
- 222 rooms
- 833 rooms
- 1794 rooms
- 225 rooms
- 546 rooms
- 137 rooms
- 08 rooms
- 09+ rooms


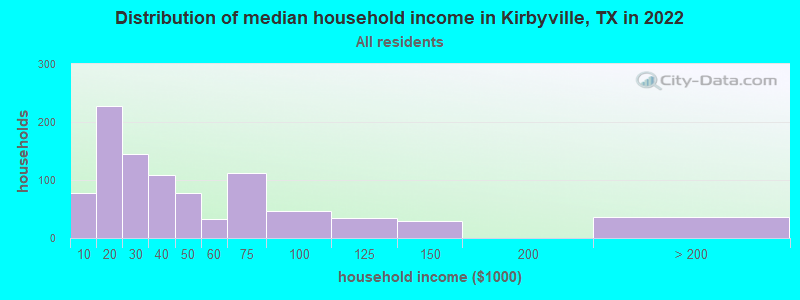
Kirbyville, TX household income distribution

- 77Less than $10,000
- 228$10,000 to $19,999
- 145$20,000 to $29,999
- 109$30,000 to $39,999
- 77$40,000 to $49,999
- 32$50,000 to $59,999
- 112$60,000 to $74,999
- 47$75,000 to $99,999
- 34$100,000 to $124,999
- 29$125,000 to $149,999
- 36$200,000 or more
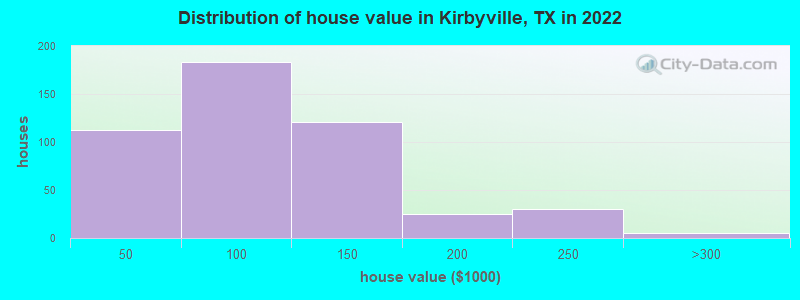
Home value of owner - occupied houses in 2022 in Kirbyville, TX
-
- 18$10,000 to $14,999
- 8$15,000 to $19,999
- 27$20,000 to $24,999
- 22$25,000 to $29,999
- 3$30,000 to $34,999
- 14$35,000 to $39,999
- 17$40,000 to $49,999
- 51$50,000 to $59,999
- 11$60,000 to $69,999
- 38$70,000 to $79,999
- 59$80,000 to $89,999
- 4$90,000 to $99,999
- 78$100,000 to $124,999
- 42$125,000 to $149,999
- 8$150,000 to $174,999
- 16$175,000 to $199,999
- 29$200,000 to $249,999
- 5$250,000 to $299,999
Rent paid by renters in 2022 in Kirbyville, TX
-
- 13Less than $100
- 16$150 to $199
- 29$200 to $249
- 37$250 to $299
- 3$350 to $399
- 30$400 to $449
- 5$450 to $499
- 63$500 to $549
- 68$600 to $649
- 14$750 to $799
- 7$800 to $899
- 25$900 to $999
- 55No cash rent

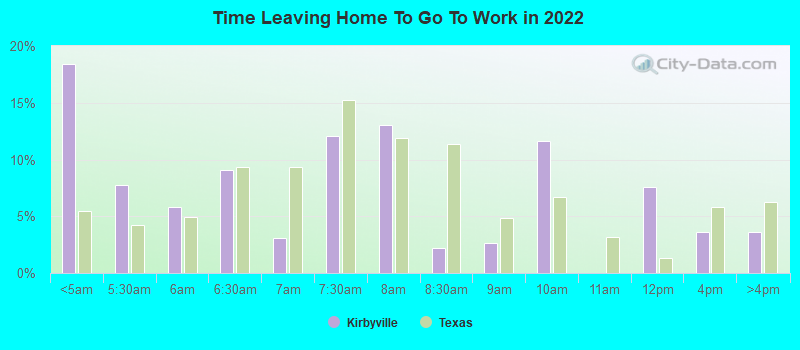
Percentage of workers working in this county: 72.5%
Number of people working at home: 41 (6.1% of all workers)
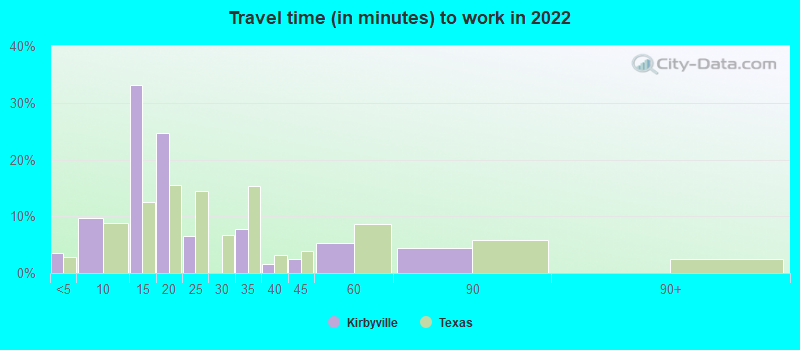
Travel time to work (commute)
- Less than 5 minutes: 35
- 5 to 9 minutes: 72
- 10 to 14 minutes: 126
- 15 to 19 minutes: 36
- 20 to 24 minutes: 26
- 25 to 29 minutes: 16
- 30 to 34 minutes: 94
- 35 to 39 minutes: 0
- 40 to 44 minutes: 11
- 45 to 59 minutes: 46
- 60 to 89 minutes: 105
- 90 or more minutes: 42
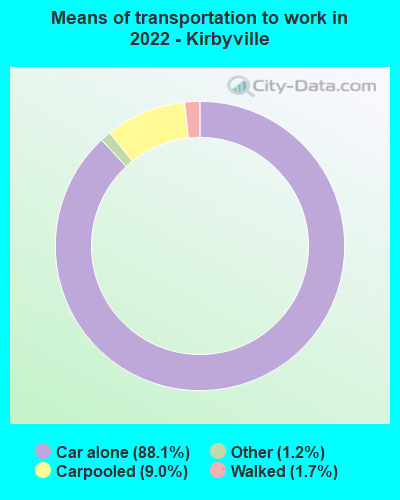
Means of transportation to work:
- Drove a car alone: 1,137 (81.6%)
- Carpooled: 126 (9.0%)
- Taxi: 19 (1.4%)
- Walked: 23 (1.6%)
- Worked at home: 41 (2.9%)
- Unemployment by race in 2022
- Unemployment rate for White non-Hispanic residents
- 9.9%Males
- 21.5%Females
- Unemployment rate for Black residents
- 76.8%Males
- Unemployment rate for other race residents
- 25.3%Males
- 33.8%Females
- Unemployment rate for Hispanic or Latino residents
- 30.8%Males
- 30.4%Females

- Year of entry for the foreign-born population in Kirbyville, Texas
- 572010 or later
- 62000 to 2009
- 01990 to 1999
- 01980 to 1989
- 31970 to 1979
- 2Before 1970

First ancestries reported:
- American: 907 (46.3%)
- Irish: 74 (3.8%)
- English: 61 (3.1%)
- French: 31 (1.6%)
- Polish: 11 (0.6%)
- German: 6 (0.3%)
- Scottish: 5 (0.3%)
- European: 4 (0.2%)
- Portuguese: 4 (0.2%)
Most common places of birth for foreign-born residents (%):
| Kirbyville: | 96.2% (51) |
| Texas: | 6.1% (306,347) |
| Kirbyville: | 9.4% (5) |
| Texas: | 48.4% (2,411,723) |
Place of birth for U.S.-born residents:
- This state: 1,921
- Other state: 411
- Northeast: 36
- Midwest: 44
- South: 165
- West: 168
91.7% of Kirbyville residents lived in the same house 1 years ago.
Out of people who lived in different houses, 45.3% lived in this county.
Out of people who lived in different counties, 37.5% lived in Texas.
| Kirbyville: | 91.7% |
| State average: | 85.7% |
Education attainment for males 25 years and older:
- No schooling: 13
- Nursery to 4th grade: 0
- 5th and 6th grade: 0
- 7th and 8th grade: 10
- 9th grade: 7
- 10th grade: 4
- 11th grade: 28
- 12th grade, no diploma: 9
- High school graduate (or equivalency): 276
- Less than 1 year of college: 149
- Some college more than 1 year, no degree: 84
- Associate degree: 0
- Bachelor's degree: 10
- Master's degree: 31
- Professional school degree: 0
- Doctorate degree: 0

Education attainment for females 25 years and older:
- No schooling: 11
- Nursery to 4th grade: 40
- 5th and 6th grade: 0
- 7th and 8th grade: 13
- 9th grade: 31
- 10th grade: 24
- 11th grade: 0
- 12th grade, no diploma: 0
- High school graduate (or equivalency): 467
- Less than 1 year of college: 109
- Some college more than 1 year, no degree: 96
- Associate degree: 30
- Bachelor's degree: 31
- Master's degree: 16
- Professional school degree: 0
- Doctorate degree: 0


Housing units in structures:
- One, detached: 513
- One, attached: 141
- Two: 149
- 3 or 4: 31
- 10 to 19: 51
- 20 to 49: 13
- 50 or more: 7
- Mobile homes: 156
Median worth of mobile homes: $58,886
Housing units lacking complete kitchen facilities in 2022: 3.3%
House/condo owner moved in on average 16 years ago
Renter moved in on average 3 years ago

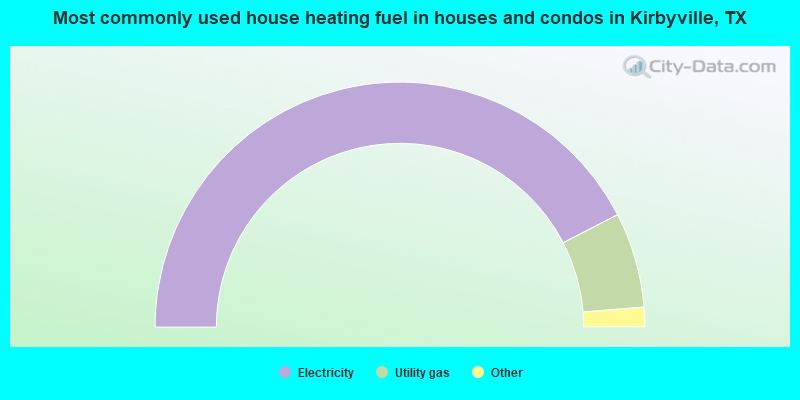
- 85.1%Electricity
- 12.6%Utility gas
- 1.1%Bottled, tank, or LP gas
- 1.1%Wood
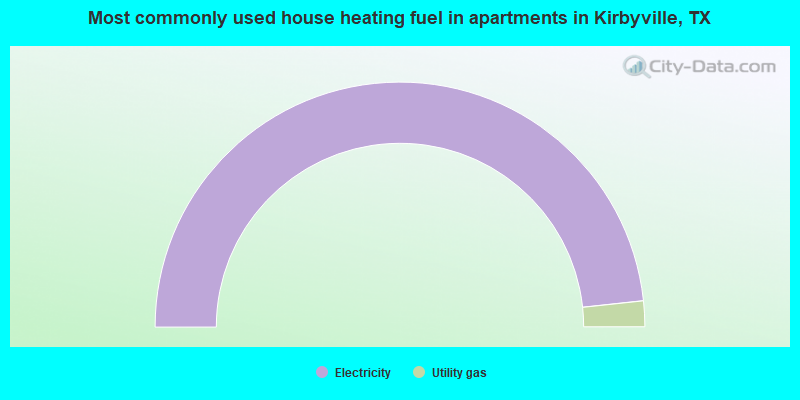
- 96.6%Electricity
- 3.4%Utility gas
Private vs. public school enrollment:
| Here: | 0.0% |
| Texas: | 8.8% |
| Here: | 12.7% |
| Texas: | 8.0% |
| Here: | 32.4% |
| Texas: | 16.2% |


