Housing density: 106 houses/condos per square mile
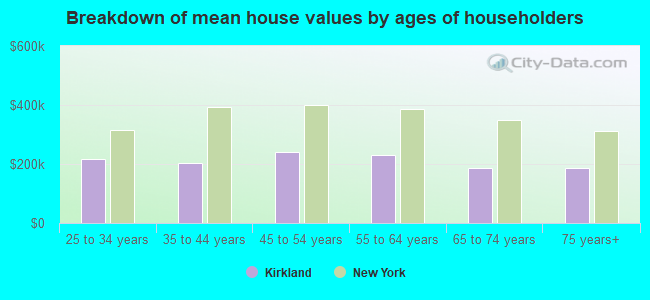
Median price asked for vacant for-sale houses and condos in 2022 in this county: $174,734.
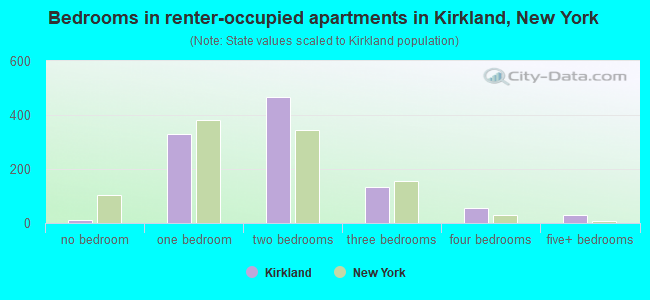
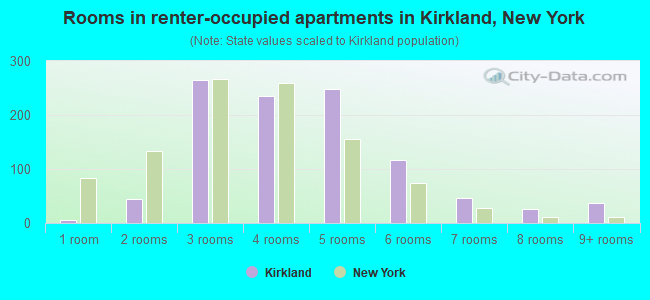
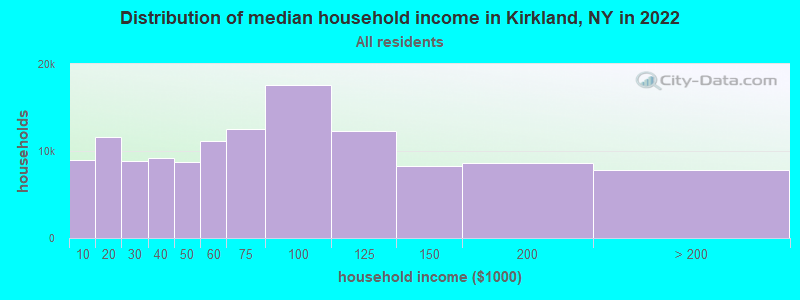
Median contract rent in 2022: $904 (lower quartile is $640, upper quartile is $1,260)
Median rent asked for vacant for-rent units in 2022: $927
Median gross rent in Kirkland, NY in 2022: $1,120
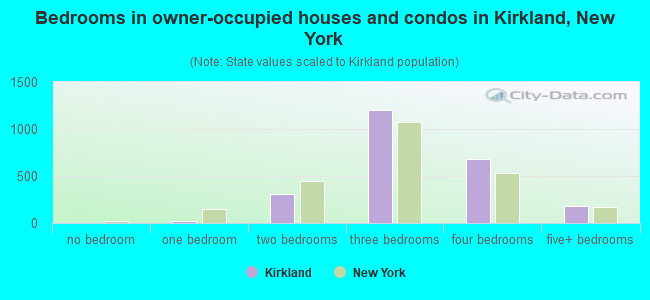
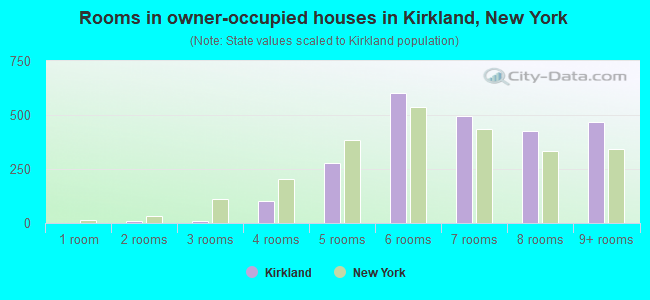
Housing units in Kirkland with a mortgage: 1,214 (108 second mortgage, 187 home equity loan, 2 both second mortgage and home equity loan) Houses without a mortgage: 690
In family households: 180,003 (38,915 male householders, 19,474 female householders)
41,459 spouses, 64,645 children (60,737 natural, 1,263 adopted, 2,645 stepchildren), 3,730 grandchildren, 1,655 brothers or sisters, 1,752 parents, foster children, 1,721 other relatives, 5,703 non-relatives
In nonfamily households: 41,470 (16,117 male householders (12,914 living alone)), 18,522 female householders (16,047 living alone)), 6,831 nonrelatives
In group quarters: 13,405 (8,414 institutionalized population)
36,373 married couples with children.
15,413 single-parent households (3,340 men, 12,073 women).
93.0% of residents of Kirkland speak English at home.
1.8% of residents speak Spanish at home (82% speak English very well, 8% speak English well, 10% speak English not well).
3.8% of residents speak other Indo-European language at home (83% speak English very well, 13% speak English well, 4% speak English not well).
1.0% of residents speak Asian or Pacific Island language at home (68% speak English very well, 21% speak English well, 11% speak English not well).
0.4% of residents speak other language at home (100% speak English very well).
Foreign born population: 594 (6.0%)
(80.3% of them are naturalized citizens)
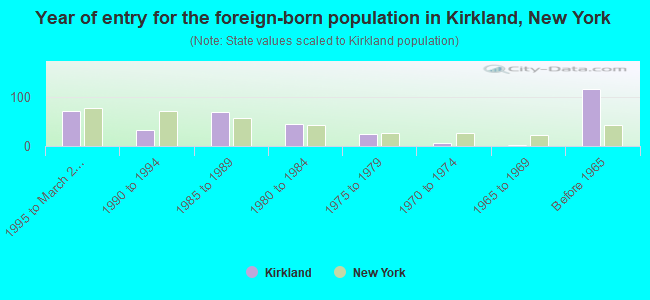
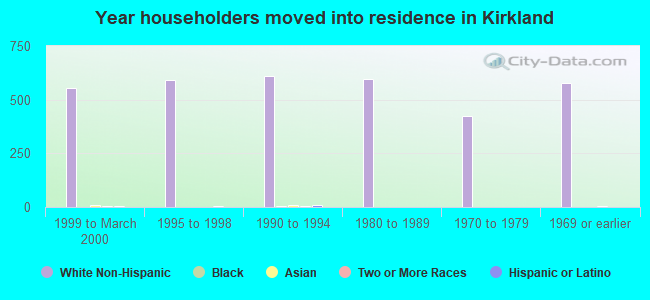
Year of entry for the foreign-born population in Kirkland, New York
721995 to March 2000
331990 to 1994
701985 to 1989
451980 to 1984
241975 to 1979
61970 to 1974
21965 to 1969
116Before 1965
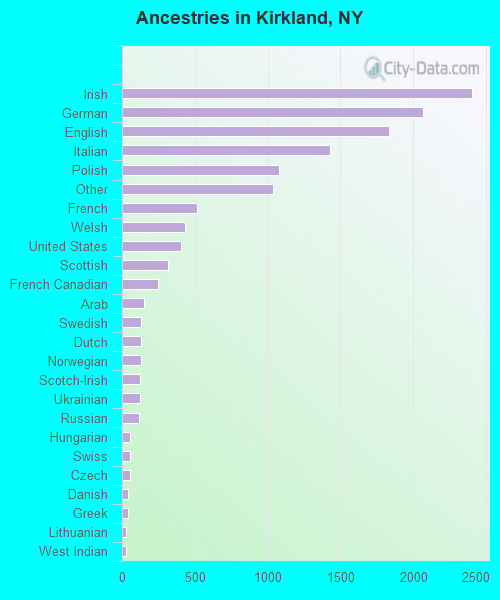
First ancestries reported:
Irish: 2,401 (18.5%)
German: 2,068 (15.9%)
English: 1,833 (14.1%)
Italian: 1,430 (11.0%)
Polish: 1,081 (8.3%)
Other: 1,038 (8.0%)
French: 515 (4.0%)
Welsh: 431 (3.3%)
United States: 406 (3.1%)
Scottish: 319 (2.5%)
French Canadian: 246 (1.9%)
Arab: 149 (1.1%)
Swedish: 133 (1.0%)
Dutch: 130 (1.0%)
Norwegian: 130 (1.0%)
Scotch-Irish: 123 (0.9%)
Ukrainian: 122 (0.9%)
Russian: 118 (0.9%)
Hungarian: 58 (0.4%)
Swiss: 57 (0.4%)
Czech: 52 (0.4%)
Danish: 42 (0.3%)
Greek: 42 (0.3%)
Lithuanian: 27 (0.2%)
West Indian: 27 (0.2%)
Slovak: 12 (0.09%)
Portuguese: 11 (0.08%)
Most common places of birth for foreign-born residents (%):
Canada
Kirkland:
12.5% (46)
New York:
1.4% (54,876)
China, excluding Hong Kong and Taiwan
Kirkland:
12.5% (46)
New York:
6.0% (233,766)
United Kingdom
Kirkland:
9.0% (33)
New York:
1.6% (62,237)
Korea
Kirkland:
6.8% (25)
New York:
2.5% (97,933)
Cuba
Kirkland:
4.9% (18)
New York:
0.9% (36,642)
Italy
Kirkland:
4.3% (16)
New York:
3.8% (147,729)
India
Kirkland:
3.8% (14)
New York:
3.0% (117,238)
Austria
Kirkland:
3.5% (13)
New York:
0.3% (11,299)
Germany
Kirkland:
3.5% (13)
New York:
1.8% (69,327)
Romania
Kirkland:
3.5% (13)
New York:
0.6% (25,059)
Japan
Kirkland:
3.3% (12)
New York:
0.8% (32,034)
Brazil
Kirkland:
2.4% (9)
New York:
0.6% (22,265)
Netherlands
Kirkland:
2.2% (8)
New York:
0.2% (6,545)
Russia
Kirkland:
2.2% (8)
New York:
2.4% (94,595)
Other Eastern Europe
Kirkland:
2.2% (8)
New York:
1.4% (53,825)
Dominican Republic
Kirkland:
2.2% (8)
New York:
10.5% (408,086)
Poland
Kirkland:
1.9% (7)
New York:
2.4% (93,187)
Ukraine
Kirkland:
1.9% (7)
New York:
2.1% (82,238)
Other Northern Africa
Kirkland:
1.9% (7)
New York:
0.3% (11,568)
Other Western Europe
Kirkland:
1.6% (6)
New York:
0.3% (10,672)
South Africa
Kirkland:
1.6% (6)
New York:
0.1% (4,273)
Place of birth for U.S.-born residents:
This state: 7,376
Other state: 2,253
Northeast: 1,129
Midwest: 446
South: 470
West: 208
59% of Kirkland residents lived in the same house 5 years ago. Out of people who lived in different houses, 44% lived in this county. Out of people who lived in different counties, 51% lived in New York.
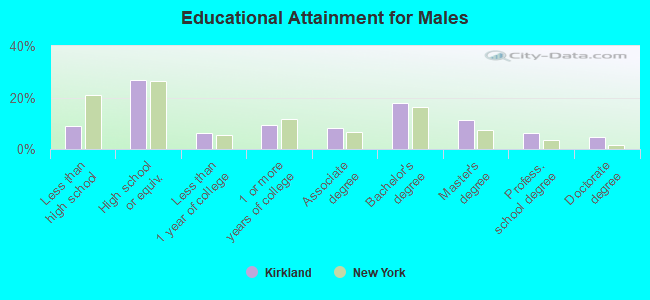
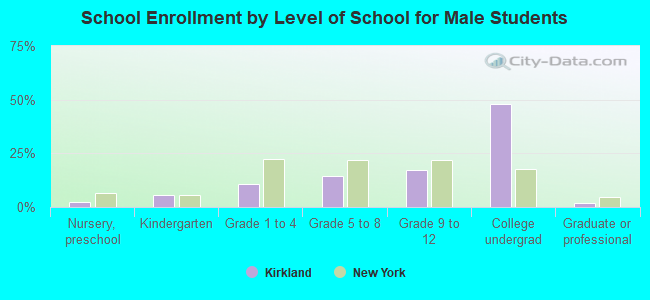
Education attainment for males 25 years and older:
No schooling: 6
Nursery to 4th grade: 6
5th and 6th grade: 3
7th and 8th grade: 42
9th grade: 35
10th grade: 64
11th grade: 25
12th grade, no diploma: 59
High school graduate (or equivalency): 720
Less than 1 year of college: 170
Some college more than 1 year, no degree: 247
Associate degree: 220
Bachelor's degree: 477
Master's degree: 302
Professional school degree: 163
Doctorate degree: 129
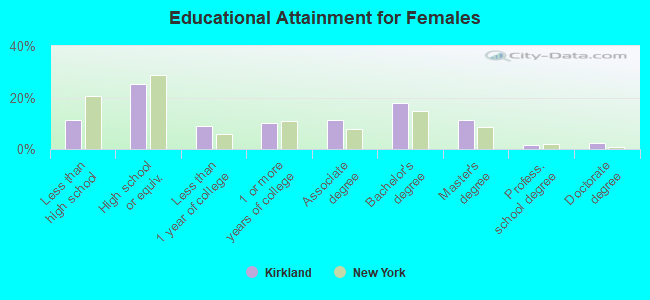
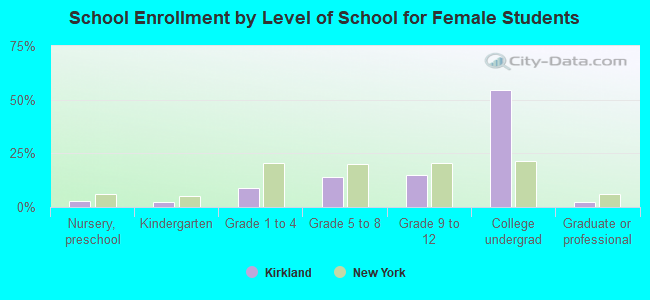
Education attainment for females 25 years and older:
No schooling: 10
Nursery to 4th grade: 8
5th and 6th grade: 29
7th and 8th grade: 65
9th grade: 22
10th grade: 71
11th grade: 50
12th grade, no diploma: 113
High school graduate (or equivalency): 841
Less than 1 year of college: 289
Some college more than 1 year, no degree: 339
Associate degree: 372
Bachelor's degree: 588
Master's degree: 376
Professional school degree: 57
Doctorate degree: 78
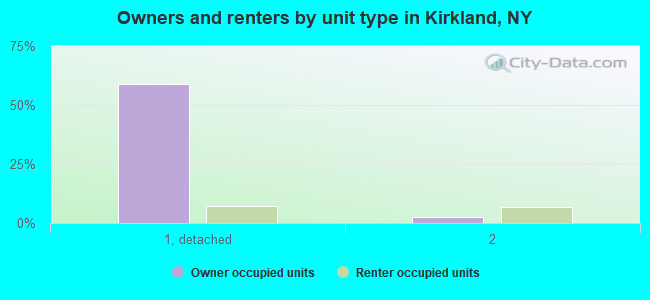
Housing units in structures:
One, detached: 2,325
One, attached: 47
Two: 342
3 or 4: 200
5 to 9: 71
10 to 19: 110
20 to 49: 105
50 or more: 110
Mobile homes: 281
Median worth of mobile homes: $60,231
Housing units lacking complete plumbing facilities: 0.1%
Housing units lacking complete kitchen facilities: 0.6%