Kirkland, NC (North Carolina) Houses and Residents
| Kirkland: | $475,808 |
| North Carolina: | $280,600 |
Total population: 684 (Urban population: 223, Rural population: 299 (all nonfarm))
Houses: 228 (215 occupied: 209 owner occupied, 6 renter occupied)
| % of renters here: | 3% |
| State: | 33% |
Housing density: 27 houses/condos per square mile
Median price asked for vacant for-sale houses and condos in 2022 in this county: $171,993.
Median contract rent in 2022: $217 (lower quartile is $219, upper quartile is $227)
Median gross rent in Kirkland, NC in 2022: $371
Housing units in Kirkland with a mortgage: 84 (25 second mortgage, 17 home equity loan, 0 both second mortgage and home equity loan)
Houses without a mortgage: 53


Latest news about housing in Kirkland, NC collected exclusively by city-data.com from local newspapers, TV, and radio stations

 | Greenville Area Developments (11696 replies) |
| Moving from NJ to Wilmington area w/2 little children...Need Help! (13 replies) |

Household type by relationship:
Households: 195,969- In family households: 147,221 (33,349 male householders, 16,631 female householders)
36,309 spouses, 47,519 children (44,331 natural, 1,287 adopted, 1,901 stepchildren), 3,380 grandchildren, 1,887 brothers or sisters, 1,368 parents, foster children, 1,850 other relatives, 4,148 non-relatives
- In nonfamily households: 48,748 (16,567 male householders (11,236 living alone)), 19,499 female householders (15,180 living alone)), 12,682 nonrelatives
- In group quarters: 6,698 (1,837 institutionalized population)
21,214 married couples with children.
9,136 single-parent households (1,335 men, 7,801 women).
91.2% of residents of Kirkland speak English at home.
6.7% of residents speak Spanish at home (64% speak English very well, 36% speak English not well).
2.0% of residents speak other Indo-European language at home (100% speak English very well).
Foreign born population: 64 (8.4%)
(123.4% of them are naturalized citizens)
| Here: | 6.3 |
| State: | 6.4 |
| Here: | 4.2 |
| State: | 4.4 |

- Bedrooms in owner-occupied houses and condos in Kirkland, North Carolina
- 0no bedroom
- 81 bedroom
- 162 bedrooms
- 1573 bedrooms
- 284 bedrooms
- 05+ bedrooms

- Bedrooms in renter-occupied apartments in Kirkland, North Carolina
- 0no bedroom
- 01 bedroom
- 62 bedrooms
- 03 bedrooms
- 04 bedrooms
- 05+ bedrooms

- Cars and other vehicles available in Kirkland in owner-occupied houses/condos
- 8no vehicle
- 261 vehicle
- 1362 vehicles
- 263 vehicles
- 04 vehicles
- 135+ vehicles

- Cars and other vehicles available in Kirkland in renter-occupied apartments
- 0no vehicle
- 61 vehicle
- 02 vehicles
- 03 vehicles
- 04 vehicles
- 05+ vehicles

- Rooms in owner-occupied houses in Kirkland, North Carolina
- 01 room
- 02 rooms
- 03 rooms
- 84 rooms
- 275 rooms
- 996 rooms
- 287 rooms
- 388 rooms
- 99+ rooms

- Rooms in renter-occupied apartments in Kirkland, North Carolina
- 01 room
- 02 rooms
- 03 rooms
- 64 rooms
- 05 rooms
- 06 rooms
- 07 rooms
- 08 rooms
- 09+ rooms


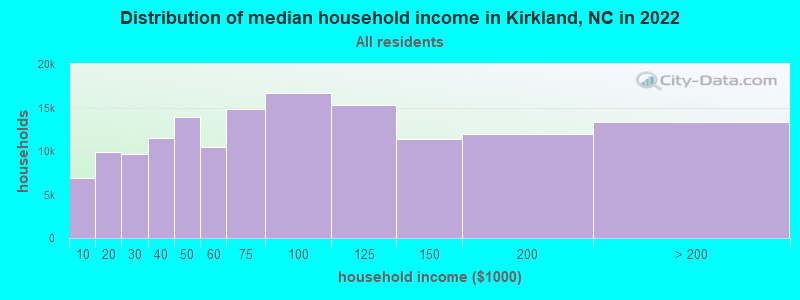
Kirkland, NC household income distribution

- 6,889Less than $10,000
- 9,925$10,000 to $19,999
- 9,676$20,000 to $29,999
- 11,490$30,000 to $39,999
- 13,901$40,000 to $49,999
- 10,442$50,000 to $59,999
- 14,837$60,000 to $74,999
- 16,628$75,000 to $99,999
- 15,302$100,000 to $124,999
- 11,413$125,000 to $149,999
- 11,921$150,000 to $199,999
- 13,278$200,000 or more
Percentage of workers working in this county: 87.1%
Number of people working at home: 102 (17.8% of all workers)
Travel time to work (commute)
- Less than 5 minutes: 48
- 5 to 9 minutes: 33
- 10 to 14 minutes: 18
- 15 to 19 minutes: 92
- 20 to 24 minutes: 35
- 25 to 29 minutes: 20
- 30 to 34 minutes: 43
- 35 to 39 minutes: 19
- 40 to 44 minutes: 7
- 45 to 59 minutes: 8
- 60 to 89 minutes: 7
- 90 or more minutes: 0
Means of transportation to work:
- Drove a car alone: 271 (74.9%)
- Carpooled: 28 (7.7%)
- Walked: 31 (8.6%)
- Worked at home: 32 (8.8%)


- Year of entry for the foreign-born population in Kirkland, North Carolina
- 01995 to March 2000
- 01990 to 1994
- 01985 to 1989
- 01980 to 1984
- 01975 to 1979
- 01970 to 1974
- 01965 to 1969
- 22Before 1965

First ancestries reported:
- Other: 224 (34.3%)
- German: 130 (19.9%)
- United States: 90 (13.8%)
- French: 51 (7.8%)
- Irish: 43 (6.6%)
- English: 24 (3.7%)
- Scotch-Irish: 18 (2.8%)
- Scottish: 17 (2.6%)
- Hungarian: 11 (1.7%)
- Dutch: 10 (1.5%)
- Danish: 9 (1.4%)
- French Canadian: 9 (1.4%)
- Norwegian: 9 (1.4%)
- Welsh: 8 (1.2%)
Most common places of birth for foreign-born residents (%):
| Kirkland: | 59.1% (13) |
| North Carolina: | 0.8% (3,564) |
| Kirkland: | 40.9% (9) |
| North Carolina: | 3.3% (14,317) |
Place of birth for U.S.-born residents:
- This state: 293
- Other state: 207
- Northeast: 71
- Midwest: 56
- South: 61
- West: 19
44% of Kirkland residents lived in the same house 5 years ago.
Out of people who lived in different houses, 72% lived in this county.
Out of people who lived in different counties, 23% lived in North Carolina.
Education attainment for males 25 years and older:
- No schooling: 0
- Nursery to 4th grade: 0
- 5th and 6th grade: 0
- 7th and 8th grade: 7
- 9th grade: 5
- 10th grade: 12
- 11th grade: 0
- 12th grade, no diploma: 9
- High school graduate (or equivalency): 87
- Less than 1 year of college: 17
- Some college more than 1 year, no degree: 9
- Associate degree: 21
- Bachelor's degree: 17
- Master's degree: 8
- Professional school degree: 0
- Doctorate degree: 20

Education attainment for females 25 years and older:
- No schooling: 0
- Nursery to 4th grade: 0
- 5th and 6th grade: 0
- 7th and 8th grade: 0
- 9th grade: 0
- 10th grade: 6
- 11th grade: 0
- 12th grade, no diploma: 0
- High school graduate (or equivalency): 70
- Less than 1 year of college: 10
- Some college more than 1 year, no degree: 39
- Associate degree: 20
- Bachelor's degree: 47
- Master's degree: 0
- Professional school degree: 8
- Doctorate degree: 0


Housing units in structures:
- One, detached: 183
- Mobile homes: 45
Median worth of mobile homes: $137,986

Private vs. public school enrollment:
| Here: | 0.0% |
| North Carolina: | 8.2% |
| Here: | 0.0% |
| North Carolina: | 6.9% |
| Here: | 0.0% |
| North Carolina: | 20.2% |


