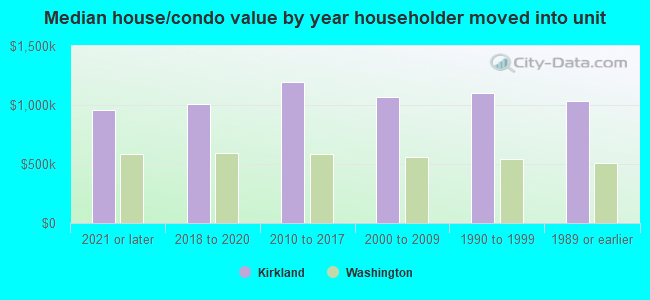
Kirkland, WA (Washington) Houses and Residents
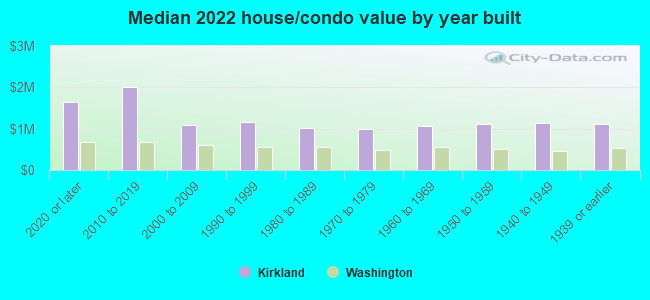
| Kirkland: | $1,081,800 |
| Washington: | $569,500 |
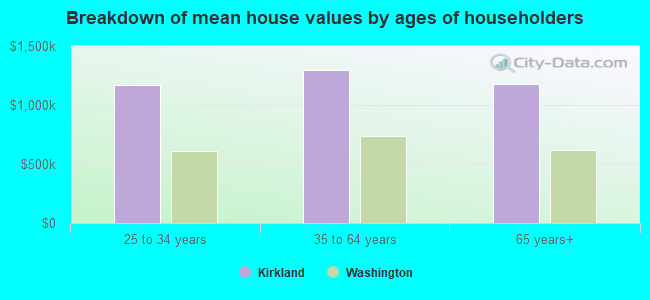
Mean price in 2022:
Detached houses: $1,396,349
Here: $1,396,349 State: $734,307 Townhouses or other attached units: $1,279,611
Here: $1,279,611 State: $657,697 In 3-to-4-unit structures: $589,339
Here: $589,339 State: $510,239 In 5-or-more-unit structures: $784,534
Here: $784,534 State: $503,183
Total population: 85,763 (Urban population: 44,986, Rural population: 0)
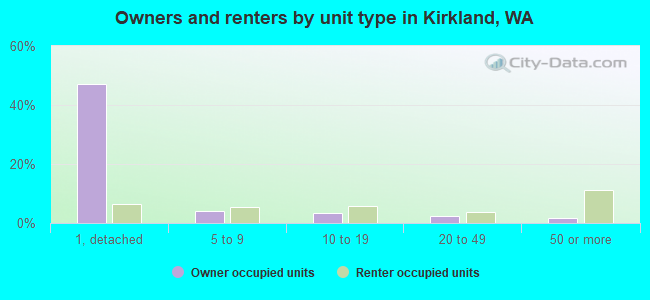
Houses: 43,327 (39,983 occupied: 24,297 owner occupied, 15,686 renter occupied)
| % of renters here: | 39% |
| State: | 36% |
Housing density: 4,059 houses/condos per square mile
Median price asked for vacant for-sale houses and condos in 2022: $1,282,183.
Median contract rent in 2022: over $2,000 (lower quartile is $1,749, upper quartile is over $2,000)
Median rent asked for vacant for-rent units in 2022: $6,601
Median gross rent in Kirkland, WA in 2022: over $2,000
Housing units in Kirkland with a mortgage: 16,823 (2,031 second mortgage, 56 home equity loan, 1,934 both second mortgage and home equity loan)
Houses without a mortgage: 159
Median household income for houses/condos with a mortgage: $187,691
Median household income for apartments without a mortgage: $126,347
Median monthly housing costs: $2,464
Compare current foreclosures in Kirkland, WA:
| Photo | Address | Area | Beds / Baths | Price | Details |
|---|---|---|---|---|---|

|
#1
114th Ave NE
Kirkland, WA 98033
|
1,950 sq. feet
|
2 baths 4 beds |
show details | |

|
#2
NE 142nd Pl
Kirkland, WA 98034
|
1,830 sq. feet
|
2 baths 3 beds |
show details | |

|
#3
116th Ave NE
Kirkland, WA 98033
|
1,260 sq. feet
|
2 baths 3 beds |
show details | |

|
#4
NE 134th Pl
Kirkland, WA 98034
|
2,893 sq. feet
|
3 baths 4 beds |
show details | |

|
#5
NE 116th Pl
Kirkland, WA 98034
|
1,760 sq. feet
|
2 baths 3 beds |
show details | |

|
#6
NE 115th Way
Kirkland, WA 98034
|
2,480 sq. feet
|
2 baths 4 beds |
show details | |

|
#7
2nd Ave S Apt 102
Kirkland, WA 98033
|
1,416 sq. feet
|
2 baths 2 beds |
show details | |

|
#8
NE Juanita Dr Apt 101
Kirkland, WA 98034
|
2,557 sq. feet
|
2 baths 3 beds |
show details | |

|
#9
NE 141st Pl
Kirkland, WA 98034
|
2,890 sq. feet
|
4 baths 4 beds |
show details | |

|
#10
NE 124th 207
Kirkland, WA 98034
|
937 sq. feet
|
2 baths 2 beds |
show details |
| Photo | Address | Area | Beds / Baths | Price | Details |
|---|---|---|---|---|---|

|
#11
108th Ave NE
Kirkland, WA 98034
|
1,260 sq. feet
|
2 baths 4 beds |
show details | |

|
#12
NE 68th St
Kirkland, WA 98033
|
1,960 sq. feet
|
2 baths 4 beds |
show details | |

|
#13
NE 125th Pl
Kirkland, WA 98034
|
1,890 sq. feet
|
2 baths 4 beds |
show details | |

|
#14
128th Ave NE
Kirkland, WA 98033
|
1,890 sq. feet
|
2 baths 4 beds |
show details | |

|
#15
91st Ln NE
Kirkland, WA 98034
|
1,070 sq. feet
|
1 baths 3 beds |
show details | |

|
#16
Cedar St
Kirkland, WA 98033
|
2,440 sq. feet
|
2 baths 4 beds |
show details | |

|
#17
80th Ave NE
Kirkland, WA 98034
|
940 sq. feet
|
1 baths 3 beds |
show details | |

|
#18
NE 132nd Pl
Kirkland, WA 98034
|
1,870 sq. feet
|
2 baths 4 beds |
show details | |

|
#19
NE 125th Pl
Kirkland, WA 98034
|
1,570 sq. feet
|
2 baths 2 beds |
show details | |

|
#20
NE 131st St
Kirkland, WA 98034
|
2,370 sq. feet
|
3 baths 3 beds |
show details |
| Photo | Address | Area | Beds / Baths | Price | Details |
|---|---|---|---|---|---|

|
#21
86th Pl NE
Kirkland, WA 98034
|
2,300 sq. feet
|
2 baths 3 beds |
show details | |

|
#22
Central Way # 4208
Kirkland, WA 98033
|
- sq. feet
|
- baths - beds |
show details | |

|
#23
9th Ave S Apt 208
Kirkland, WA 98033
|
- sq. feet
|
- baths - beds |
show details | |

|
#24
8th St S
Kirkland, WA 98033
|
- sq. feet
|
- baths - beds |
show details | |

|
#25
110th Ave NE Apt C1
Kirkland, WA 98033
|
- sq. feet
|
- baths - beds |
show details | |

|
#26
NE 124th St # 134
Kirkland, WA 98034
|
- sq. feet
|
- baths - beds |
show details | |

|
#27
3rd Pl S Apt 2
Kirkland, WA 98033
|
- sq. feet
|
- baths - beds |
show details | |

|
#28
100th Ave NE Apt 2b
Kirkland, WA 98034
|
- sq. feet
|
- baths - beds |
show details | |

|
#29
Lake Washington Blvd NE Apt H
Kirkland, WA 98033
|
- sq. feet
|
- baths - beds |
show details | |

|
#30
NE 123rd St Apt A
Kirkland, WA 98034
|
- sq. feet
|
- baths - beds |
show details |
| Photo | Address | Area | Beds / Baths | Price | Details |
|---|---|---|---|---|---|

|
#31
Kirkland Ave # 306
Kirkland, WA 98033
|
- sq. feet
|
- baths - beds |
show details | |

|
#32
Kirkland Cir
Kirkland, WA 98033
|
- sq. feet
|
- baths - beds |
show details | |

|
#33
117th Pl NE
Kirkland, WA 98034
|
- sq. feet
|
- baths - beds |
show details | |

|
#34
101st Pl NE Apt 71
Kirkland, WA 98034
|
- sq. feet
|
- baths - beds |
show details | |

|
#35
2nd Ave S Apt 302
Kirkland, WA 98033
|
- sq. feet
|
- baths - beds |
show details | |

|
#36
100th Ave NE Apt 2b
Kirkland, WA 98034
|
- sq. feet
|
- baths - beds |
show details | |

|
#37
128th Ave NE # I203
Kirkland, WA 98033
|
- sq. feet
|
- baths - beds |
show details | |

|
#38
Lake St S Ste 201
Kirkland, WA 98033
|
- sq. feet
|
- baths - beds |
show details | |

|
#39
4th Ave S Apt 6
Kirkland, WA 98033
|
- sq. feet
|
- baths - beds |
show details | |

|
#40
93rd Ln NE Apt 102
Kirkland, WA 98034
|
- sq. feet
|
- baths - beds |
show details |
| Photo | Address | Area | Beds / Baths | Price | Details |
|---|---|---|---|---|---|

|
Check over 1 million property listings on Foreclosure.com!
|
browse all offers | |||
| Photo | Address | Area | Beds / Baths | Price | Details |
|---|

Latest news about housing in Kirkland, WA collected exclusively by city-data.com from local newspapers, TV, and radio stations


Median year apartment built: 1985
Household type by relationship:
Households: 92,155- Male householders: 21,265 (6,309 living alone), Female householders: 18,718 (5,949 living alone)
18,285 spouses (17,070 opposite-sex spouses), 4,646 unmarried partners, (4,374 opposite-sex unmarried partners), 21,486 children (20,787 natural, 384 adopted, 315 stepchildren), 815 grandchildren, 467 brothers or sisters, 1,187 parents, 0 foster children, 326 other relatives, 3,374 non-relatives
- In group quarters: 1,586
Size of family households: 11,226 2-persons, 4,800 3-persons, 4,825 4-persons, 1,635 5-persons, 230 6-persons, 81 7-or-more-persons.
Size of nonfamily households: 12,258 1-person, 4,220 2-persons, 488 3-persons, 97 4-persons, 73 5-persons, 50 6-persons.
13,091 married couples with children.
3,854 single-parent households (1,222 men, 2,632 women).
71.1% of residents of Kirkland speak English at home.
5.7% of residents speak Spanish at home (70% speak English very well, 22% speak English well, 7% speak English not well, 2% don't speak English at all).
10.7% of residents speak other Indo-European language at home (81% speak English very well, 11% speak English well, 6% speak English not well, 2% don't speak English at all).
11.1% of residents speak Asian or Pacific Island language at home (59% speak English very well, 27% speak English well, 11% speak English not well, 3% don't speak English at all).
1.3% of residents speak other language at home (95% speak English very well, 4% speak English well, 1% speak English not well).
Foreign born population: 25,490 (27.7%)
(51.1% of them are naturalized citizens)
| Here: | 6.4 |
| State: | 6.5 |
| Here: | 3.6 |
| State: | 3.9 |
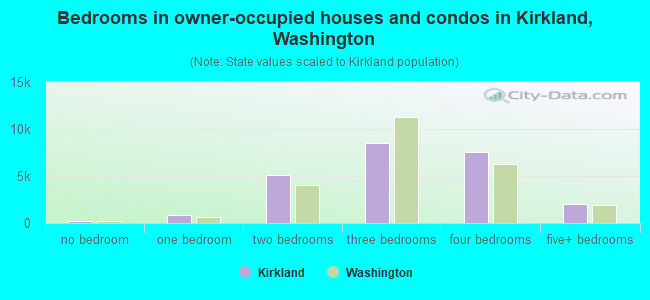
- Bedrooms in owner-occupied houses and condos in Kirkland, Washington
- 186no bedroom
- 8681 bedroom
- 5,0902 bedrooms
- 8,5443 bedrooms
- 7,5384 bedrooms
- 2,0715+ bedrooms
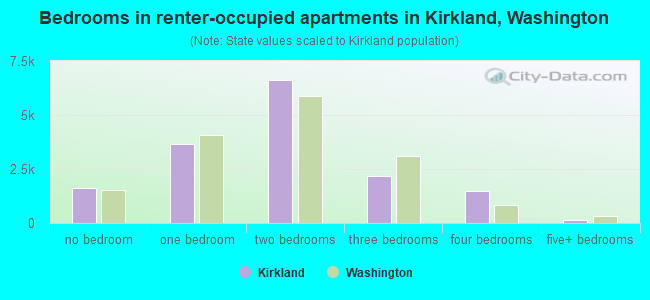
- Bedrooms in renter-occupied apartments in Kirkland, Washington
- 1,640no bedroom
- 3,6401 bedroom
- 6,6032 bedrooms
- 2,1903 bedrooms
- 1,4854 bedrooms
- 1285+ bedrooms
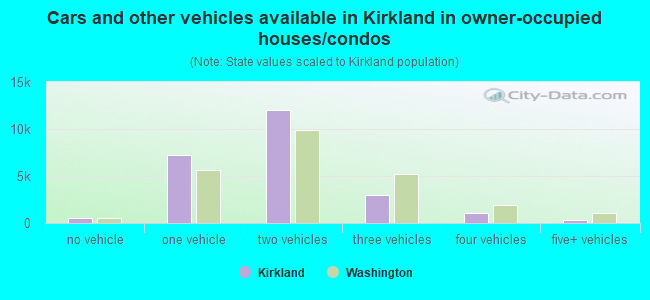
- Cars and other vehicles available in Kirkland in owner-occupied houses/condos
- 545no vehicle
- 7,2661 vehicle
- 12,0672 vehicles
- 2,9843 vehicles
- 1,0814 vehicles
- 3545+ vehicles
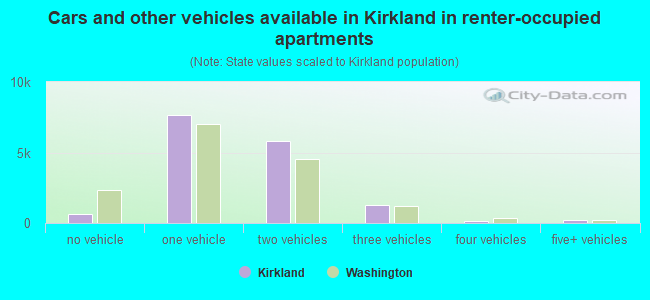
- Cars and other vehicles available in Kirkland in renter-occupied apartments
- 633no vehicle
- 7,6761 vehicle
- 5,8032 vehicles
- 1,2463 vehicles
- 1264 vehicles
- 2025+ vehicles
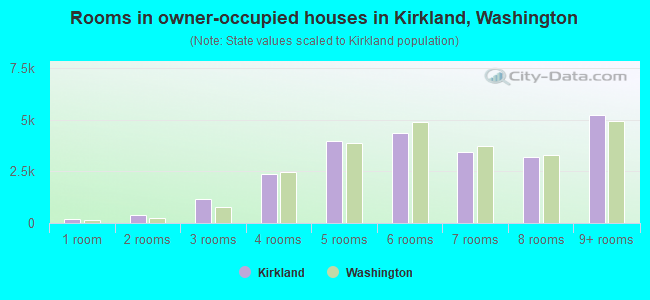
- Rooms in owner-occupied houses in Kirkland, Washington
- 1861 room
- 3782 rooms
- 1,1413 rooms
- 2,3734 rooms
- 3,9685 rooms
- 4,3716 rooms
- 3,4537 rooms
- 3,2008 rooms
- 5,2279+ rooms
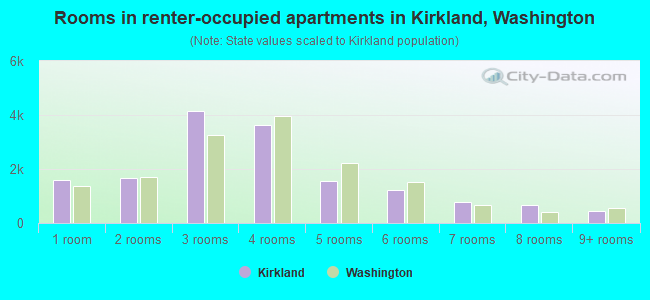
- Rooms in renter-occupied apartments in Kirkland, Washington
- 1,5911 room
- 1,6522 rooms
- 4,1553 rooms
- 3,6254 rooms
- 1,5435 rooms
- 1,2366 rooms
- 7827 rooms
- 6618 rooms
- 4419+ rooms
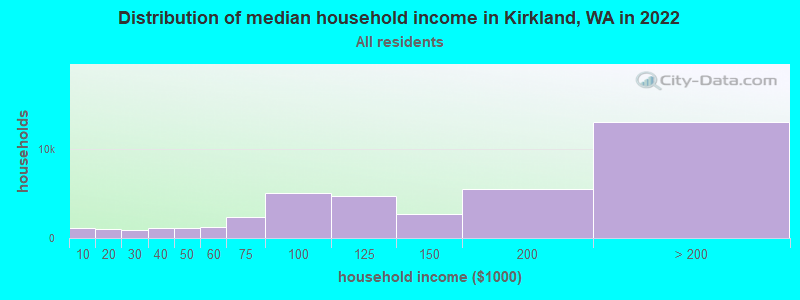
Kirkland, WA household income distribution

- 1,162Less than $10,000
- 1,038$10,000 to $19,999
- 918$20,000 to $29,999
- 1,160$30,000 to $39,999
- 1,173$40,000 to $49,999
- 1,199$50,000 to $59,999
- 2,365$60,000 to $74,999
- 5,068$75,000 to $99,999
- 4,655$100,000 to $124,999
- 2,710$125,000 to $149,999
- 5,533$150,000 to $199,999
- 13,002$200,000 or more
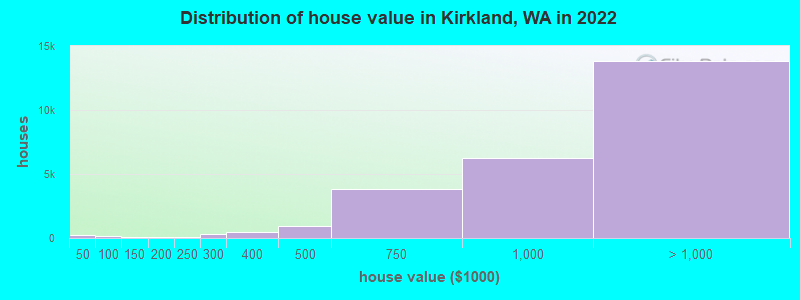
Home value of owner - occupied houses in 2022 in Kirkland, WA
-
- 193Less than $10,000
- 5$15,000 to $19,999
- 19$40,000 to $49,999
- 35$50,000 to $59,999
- 49$70,000 to $79,999
- 39$80,000 to $89,999
- 32$90,000 to $99,999
- 44$100,000 to $124,999
- 68$150,000 to $174,999
- 9$175,000 to $199,999
- 86$200,000 to $249,999
- 304$250,000 to $299,999
- 448$300,000 to $399,999
- 903$400,000 to $499,999
- 3,789$500,000 to $749,999
- 6,214$750,000 to $999,999
- 5,837$1,000,000 to $1,499,999
- 3,713$1,500,000 to $1,999,999
- 4,254$2,000,000 or more
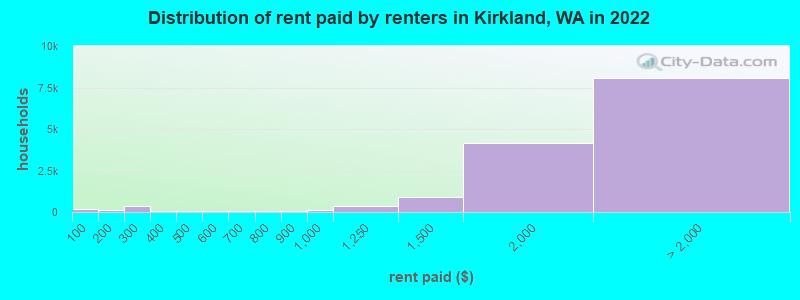
Rent paid by renters in 2022 in Kirkland, WA
-
- 169Less than $100
- 91$100 to $149
- 49$150 to $199
- 235$200 to $249
- 135$250 to $299
- 66$300 to $349
- 7$400 to $449
- 42$450 to $499
- 66$500 to $549
- 3$550 to $599
- 30$600 to $649
- 57$650 to $699
- 18$700 to $749
- 24$750 to $799
- 70$800 to $899
- 125$900 to $999
- 379$1,000 to $1,249
- 875$1,250 to $1,499
- 4,176$1,500 to $1,999
- 3,432$2,000 to $2,499
- 1,994$2,500 to $2,999
- 1,279$3,000 to $3,499
- 1,014$3,500 or more
- 335No cash rent
Percentage of workers working in this county: 93.4%
Number of people working at home: 16,971 (33.5% of all workers)
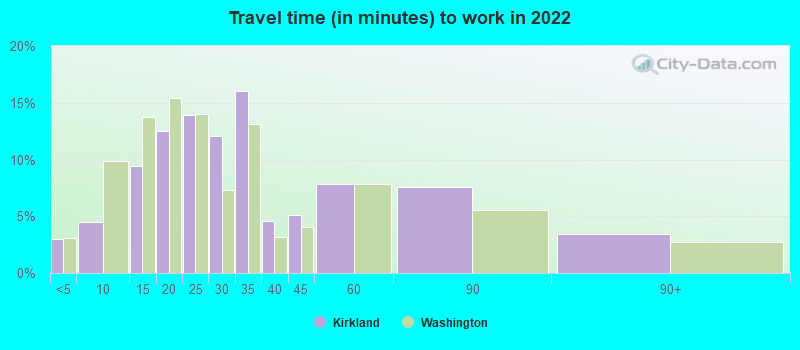
Travel time to work (commute)
- Less than 5 minutes: 947
- 5 to 9 minutes: 1,972
- 10 to 14 minutes: 5,453
- 15 to 19 minutes: 5,251
- 20 to 24 minutes: 5,187
- 25 to 29 minutes: 2,149
- 30 to 34 minutes: 6,065
- 35 to 39 minutes: 1,011
- 40 to 44 minutes: 1,060
- 45 to 59 minutes: 2,308
- 60 to 89 minutes: 396
- 90 or more minutes: 187
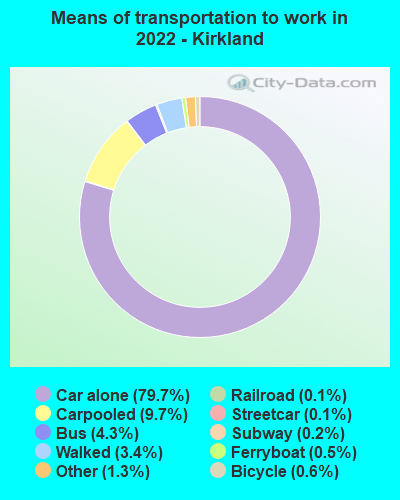
Means of transportation to work:
- Drove a car alone: 30,528 (58.3%)
- Carpooled: 3,587 (6.9%)
- Bus: 1,005 (1.9%)
- Subway or elevated rail: 58 (0.1%)
- Long-distance train or commuter rail: 41 (0.1%)
- Light rail, streetcar or trolley: 63 (0.1%)
- Ferryboat: 181 (0.3%)
- Taxi: 461 (0.9%)
- Bicycle: 202 (0.4%)
- Walked: 1,164 (2.2%)
- Worked at home: 16,971 (32.4%)
- Unemployment by race in 2022
- Unemployment rate for White non-Hispanic residents
- 2.6%Males
- 1.9%Females
- Unemployment rate for Black residents
- 2.8%Males
- 1.0%Females
- Unemployment rate for American Indian and Alaska Native residents
- 7.3%Females
- Unemployment rate for Asian residents
- 2.9%Males
- 3.9%Females
- Unemployment rate for other race residents
- 1.0%Males
- 8.1%Females
- Unemployment rate for two or more race residents
- 4.0%Males
- 2.5%Females
- Unemployment rate for Hispanic or Latino residents
- 3.7%Males
- 7.1%Females
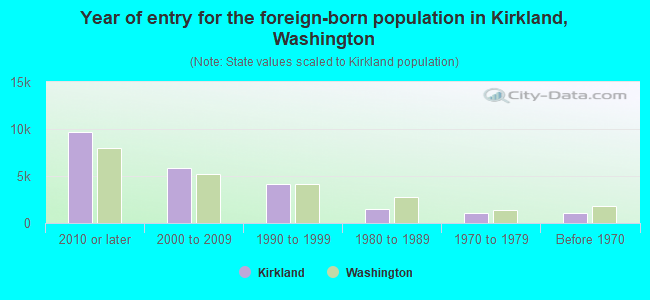
- Year of entry for the foreign-born population in Kirkland, Washington
- 9,6532010 or later
- 5,8392000 to 2009
- 4,1931990 to 1999
- 1,4651980 to 1989
- 1,0131970 to 1979
- 1,077Before 1970
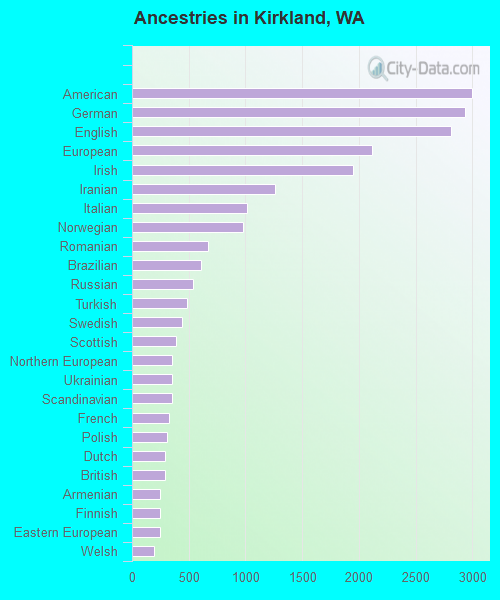
First ancestries reported:
- American: 2,997 (6.4%)
- German: 2,938 (6.3%)
- English: 2,810 (6.0%)
- European: 2,114 (4.5%)
- Irish: 1,948 (4.1%)
- Iranian: 1,257 (2.7%)
- Italian: 1,018 (2.2%)
- Norwegian: 975 (2.1%)
- Romanian: 666 (1.4%)
- Brazilian: 611 (1.3%)
- Russian: 538 (1.1%)
- Turkish: 483 (1.0%)
- Swedish: 443 (0.9%)
- Scottish: 387 (0.8%)
- Northern European: 356 (0.8%)
- Ukrainian: 353 (0.8%)
- Scandinavian: 353 (0.8%)
- French: 325 (0.7%)
- Polish: 309 (0.7%)
- Dutch: 291 (0.6%)
- British: 289 (0.6%)
- Armenian: 251 (0.5%)
- Finnish: 250 (0.5%)
- Eastern European: 246 (0.5%)
- Welsh: 197 (0.4%)
- Australian: 184 (0.4%)
- Canadian: 183 (0.4%)
- Iraqi: 165 (0.4%)
- Danish: 144 (0.3%)
- Yugoslavian: 134 (0.3%)
- Israeli: 133 (0.3%)
- Serbian: 133 (0.3%)
- Greek: 124 (0.3%)
- Arab: 123 (0.3%)
- Scotch-Irish: 115 (0.2%)
- Czech: 111 (0.2%)
- Nigerian: 110 (0.2%)
- French Canadian: 89 (0.2%)
- Egyptian: 77 (0.2%)
- Palestinian: 67 (0.1%)
- Austrian: 56 (0.1%)
- Czechoslovakian: 51 (0.1%)
- Lebanese: 45 (0.10%)
- Hungarian: 41 (0.09%)
- Portuguese: 38 (0.08%)
- Slovak: 36 (0.08%)
- Latvian: 34 (0.07%)
- Croatian: 32 (0.07%)
- Bulgarian: 31 (0.07%)
- Ethiopian: 31 (0.07%)
- Jamaican: 30 (0.06%)
- Swiss: 29 (0.06%)
- Jordanian: 28 (0.06%)
- African: 28 (0.06%)
- Slovene: 22 (0.05%)
- South African: 22 (0.05%)
- Guyanese: 20 (0.04%)
- Icelander: 19 (0.04%)
- Kenyan: 15 (0.03%)
- Pennsylvania German: 10 (0.02%)
- New Zealander: 8 (0.02%)
- Lithuanian: 7 (0.01%)
- Afghan: 5 (0.01%)
- Slavic: 5 (0.01%)
- Belgian: 4 (0.01%)
- West Indian: 4 (0.01%)
- Ghanaian: 3 (0.01%)
Most common places of birth for foreign-born residents (%):
| Kirkland: | 13.4% (3,152) |
| Washington: | 7.4% (84,470) |
| Kirkland: | 13.2% (3,107) |
| Washington: | 8.9% (101,353) |
| Kirkland: | 7.5% (1,765) |
| Washington: | 21.1% (241,655) |
| Kirkland: | 5.9% (1,396) |
| Washington: | 0.8% (9,359) |
| Kirkland: | 5.0% (1,176) |
| Washington: | 4.1% (47,238) |
| Kirkland: | 4.2% (982) |
| Washington: | 0.9% (10,499) |
| Kirkland: | 3.8% (901) |
| Washington: | 4.3% (48,886) |
| Kirkland: | 3.2% (762) |
| Washington: | 0.9% (9,937) |
| Kirkland: | 3.1% (717) |
| Washington: | 5.4% (62,003) |
| Kirkland: | 2.9% (670) |
| Washington: | 1.9% (21,540) |
| Kirkland: | 2.8% (650) |
| Washington: | 1.5% (16,607) |
| Kirkland: | 2.1% (497) |
| Washington: | 0.7% (7,568) |
| Kirkland: | 1.9% (444) |
| Washington: | 1.6% (17,761) |
| Kirkland: | 1.8% (434) |
| Washington: | 1.5% (17,453) |
| Kirkland: | 1.8% (427) |
| Washington: | 0.5% (6,259) |
| Kirkland: | 1.8% (415) |
| Washington: | 6.3% (71,661) |
Place of birth for U.S.-born residents:
- This state: 32,594
- Other state: 32,418
- Northeast: 4,975
- Midwest: 7,171
- South: 6,011
- West: 14,261
82.4% of Kirkland residents lived in the same house 1 years ago.
Out of people who lived in different houses, 39.3% lived in this county.
Out of people who lived in different counties, 40.8% lived in Washington.
| Kirkland: | 82.4% |
| State average: | 85.2% |
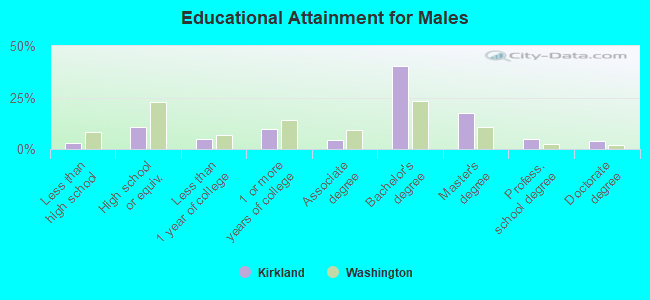
Education attainment for males 25 years and older:
- No schooling: 106
- Nursery to 4th grade: 481
- 5th and 6th grade: 0
- 7th and 8th grade: 177
- 9th grade: 71
- 10th grade: 0
- 11th grade: 0
- 12th grade, no diploma: 201
- High school graduate (or equivalency): 3,619
- Less than 1 year of college: 1,708
- Some college more than 1 year, no degree: 3,315
- Associate degree: 1,481
- Bachelor's degree: 13,631
- Master's degree: 5,934
- Professional school degree: 1,586
- Doctorate degree: 1,383
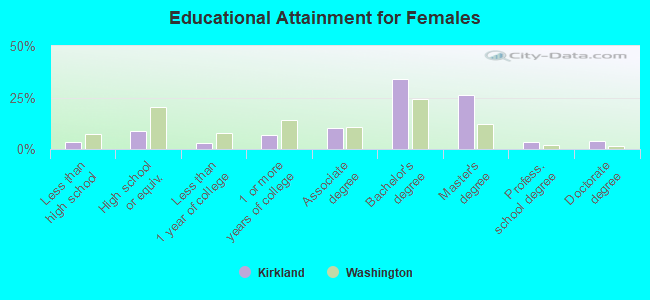
Education attainment for females 25 years and older:
- No schooling: 637
- Nursery to 4th grade: 221
- 5th and 6th grade: 46
- 7th and 8th grade: 82
- 9th grade: 0
- 10th grade: 0
- 11th grade: 219
- 12th grade, no diploma: 43
- High school graduate (or equivalency): 2,996
- Less than 1 year of college: 1,003
- Some college more than 1 year, no degree: 2,437
- Associate degree: 3,477
- Bachelor's degree: 11,872
- Master's degree: 9,076
- Professional school degree: 1,221
- Doctorate degree: 1,367


Housing units in structures:
- One, detached: 21,899
- One, attached: 3,144
- Two: 49
- 3 or 4: 1,476
- 5 to 9: 4,180
- 10 to 19: 2,610
- 20 to 49: 2,773
- 50 or more: 7,117
- Boats, RVs, vans, etc.: 79
Housing units lacking complete kitchen facilities in 2022: 2.3%
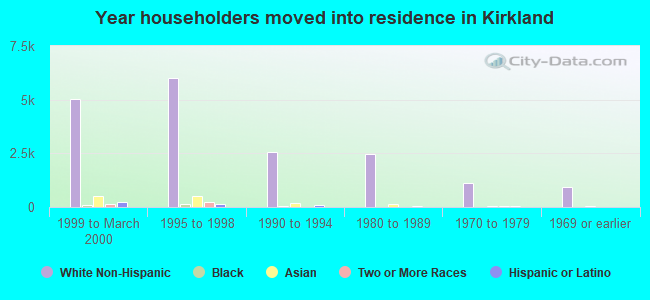
House/condo owner moved in on average 10 years ago
Renter moved in on average 2 years ago
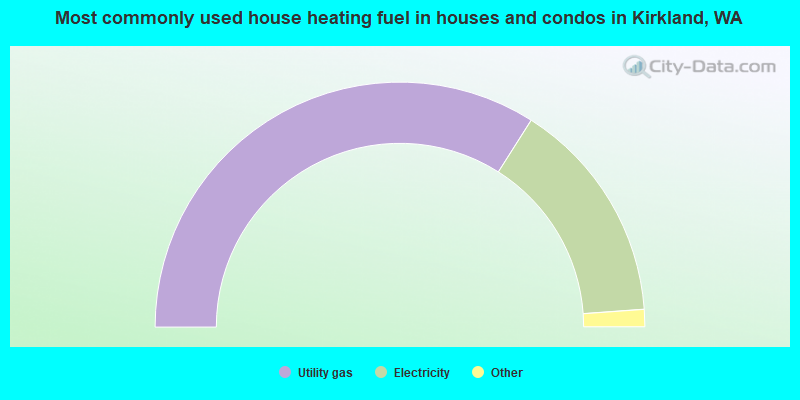
- 68.0%Utility gas
- 29.7%Electricity
- 1.2%Bottled, tank, or LP gas
- 0.6%Fuel oil, kerosene, etc.
- 0.2%Wood
- 0.2%Solar energy
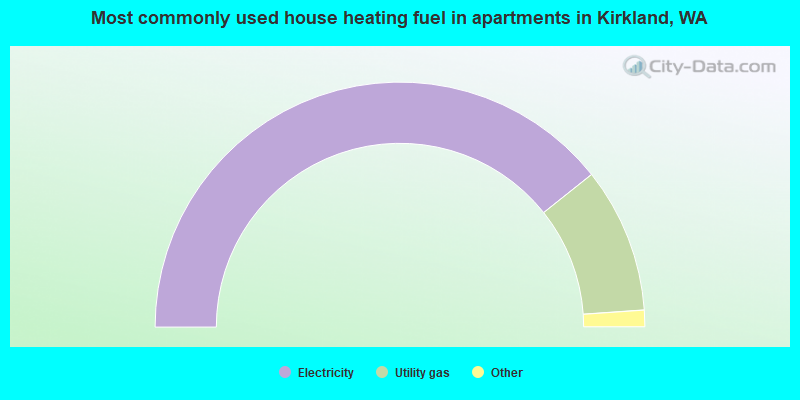
- 78.6%Electricity
- 19.2%Utility gas
- 0.8%Fuel oil, kerosene, etc.
- 0.6%No fuel used
- 0.3%Bottled, tank, or LP gas
- 0.3%Wood
- 0.2%Other fuel
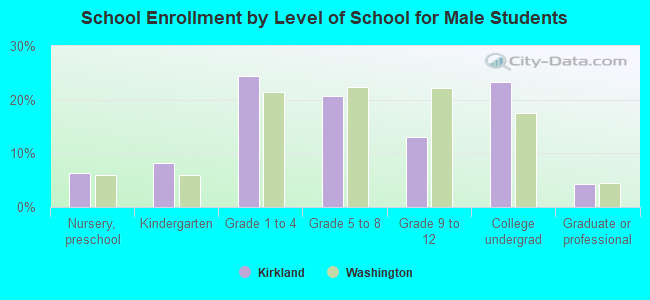
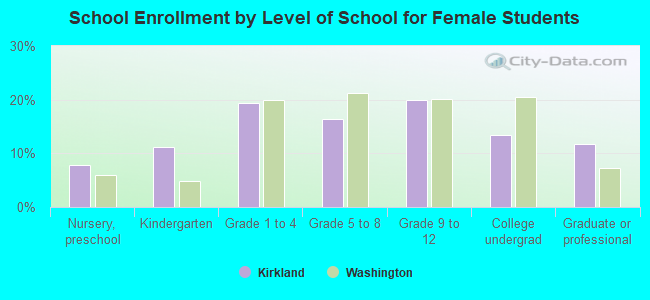
Private vs. public school enrollment:
| Here: | 12.7% |
| Washington: | 12.4% |
| Here: | 18.2% |
| Washington: | 9.2% |
| Here: | 30.6% |
| Washington: | 16.5% |