Knob Creek, TN (Tennessee) Houses and Residents
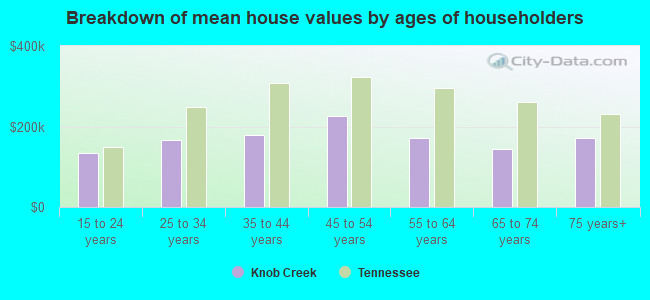
| Knob Creek: | $263,581 |
| Tennessee: | $284,800 |
Total population: 6,543 (Urban population: 0, Rural population: 5,589 (228 farm, 5,361 nonfarm))
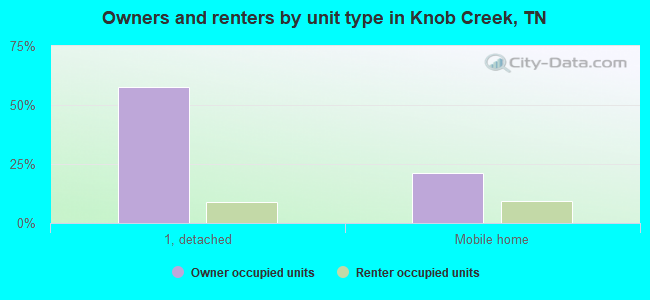
Houses: 2,687 (2,219 occupied: 1,757 owner occupied, 462 renter occupied)
| % of renters here: | 21% |
| State: | 33% |
Housing density: 50 houses/condos per square mile
Median price asked for vacant for-sale houses and condos in 2022 in this county: $355,070.
Median contract rent in 2022: $706 (lower quartile is $580, upper quartile is $967)
Median rent asked for vacant for-rent units in 2022: $787
Median gross rent in Knob Creek, TN in 2022: $952
Housing units in Knob Creek with a mortgage: 514 (89 second mortgage, 55 home equity loan, 0 both second mortgage and home equity loan)
Houses without a mortgage: 445


Household type by relationship:
Households: 88,907- In family households: 75,769 (18,010 male householders, 6,992 female householders)
19,214 spouses, 22,992 children (20,813 natural, 637 adopted, 1,542 stepchildren), 2,537 grandchildren, 802 brothers or sisters, 812 parents, foster children, 1,166 other relatives, 2,497 non-relatives
- In nonfamily households: 13,138 (4,771 male householders (3,562 living alone)), 5,570 female householders (4,701 living alone)), 2,797 nonrelatives
- In group quarters: 982 (808 institutionalized population)
11,249 married couples with children.
3,454 single-parent households (883 men, 2,571 women).
98.3% of residents of Knob Creek speak English at home.
1.1% of residents speak Spanish at home (39% speak English very well, 30% speak English well, 30% speak English not well).
0.3% of residents speak other Indo-European language at home (47% speak English very well, 53% speak English not well).
0.3% of residents speak Asian or Pacific Island language at home (71% speak English very well, 29% speak English well).
Foreign born population: 341 (4.4%)
(3.2% of them are naturalized citizens)
| Here: | 6.1 |
| State: | 6.5 |
| Here: | 4.4 |
| State: | 4.4 |
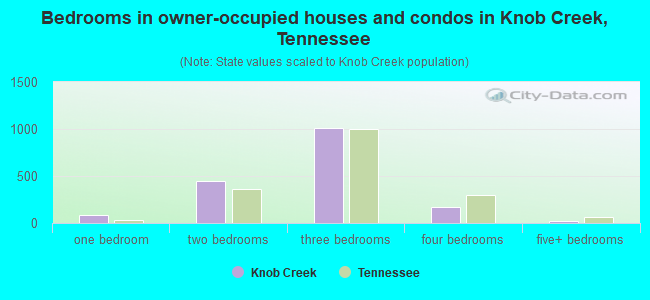
- Bedrooms in owner-occupied houses and condos in Knob Creek, Tennessee
- 7no bedroom
- 891 bedroom
- 4512 bedrooms
- 1,0123 bedrooms
- 1754 bedrooms
- 235+ bedrooms
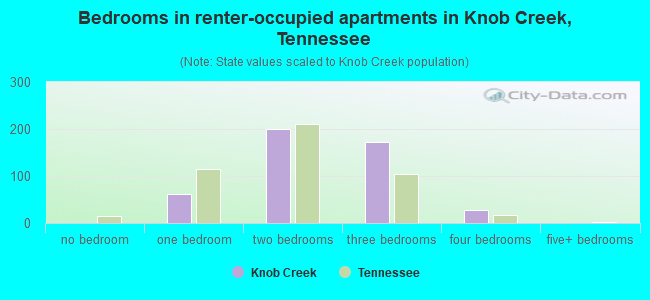
- Bedrooms in renter-occupied apartments in Knob Creek, Tennessee
- 0no bedroom
- 611 bedroom
- 2002 bedrooms
- 1733 bedrooms
- 284 bedrooms
- 05+ bedrooms
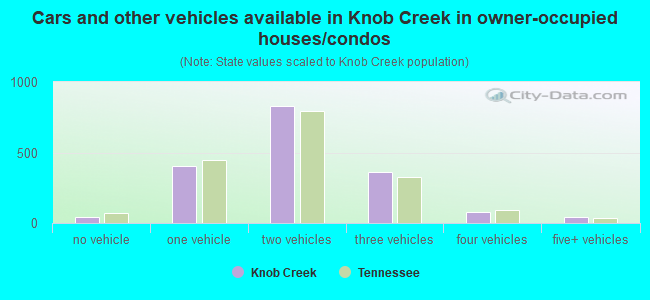
- Cars and other vehicles available in Knob Creek in owner-occupied houses/condos
- 41no vehicle
- 4041 vehicle
- 8312 vehicles
- 3613 vehicles
- 754 vehicles
- 455+ vehicles
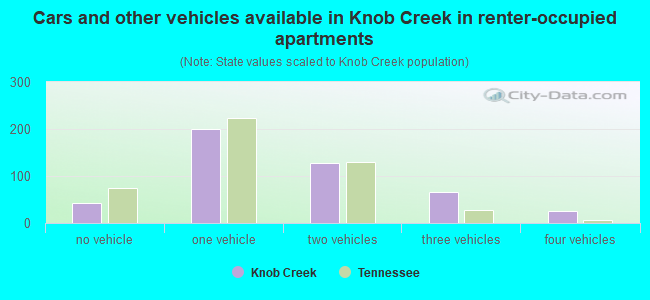
- Cars and other vehicles available in Knob Creek in renter-occupied apartments
- 43no vehicle
- 2011 vehicle
- 1282 vehicles
- 653 vehicles
- 254 vehicles
- 05+ vehicles
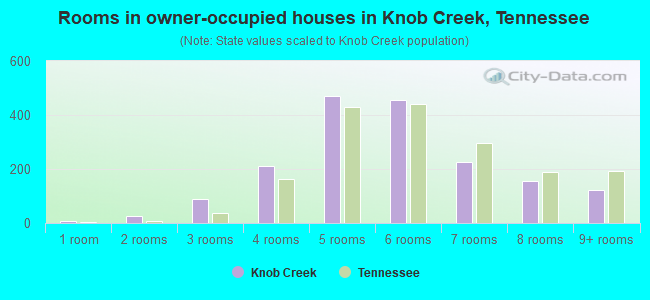
- Rooms in owner-occupied houses in Knob Creek, Tennessee
- 71 room
- 252 rooms
- 883 rooms
- 2124 rooms
- 4695 rooms
- 4546 rooms
- 2257 rooms
- 1558 rooms
- 1229+ rooms
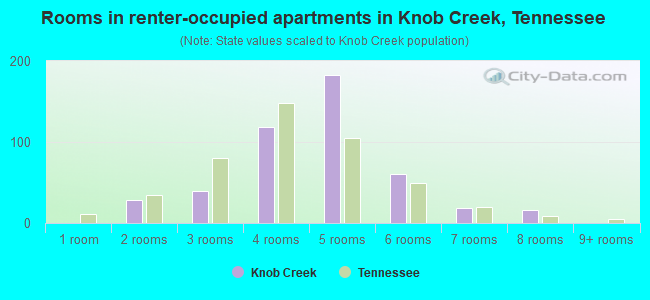
- Rooms in renter-occupied apartments in Knob Creek, Tennessee
- 01 room
- 282 rooms
- 393 rooms
- 1184 rooms
- 1835 rooms
- 606 rooms
- 187 rooms
- 168 rooms
- 09+ rooms
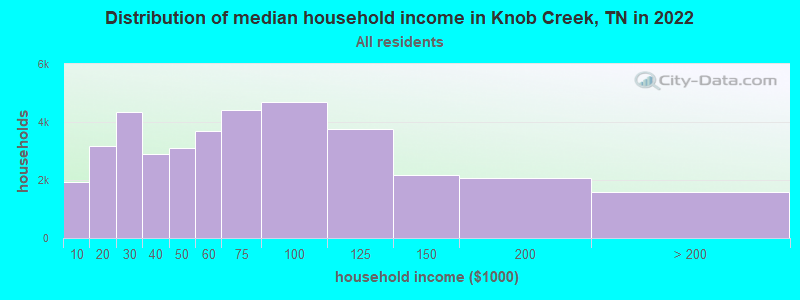
Knob Creek, TN household income distribution

- 1,915Less than $10,000
- 3,156$10,000 to $19,999
- 4,333$20,000 to $29,999
- 2,901$30,000 to $39,999
- 3,094$40,000 to $49,999
- 3,706$50,000 to $59,999
- 4,397$60,000 to $74,999
- 4,688$75,000 to $99,999
- 3,752$100,000 to $124,999
- 2,160$125,000 to $149,999
- 2,078$150,000 to $199,999
- 1,593$200,000 or more
Percentage of workers working in this county: 73.9%
Number of people working at home: 299 (9.8% of all workers)
Travel time to work (commute)
- Less than 5 minutes: 0
- 5 to 9 minutes: 47
- 10 to 14 minutes: 208
- 15 to 19 minutes: 470
- 20 to 24 minutes: 521
- 25 to 29 minutes: 130
- 30 to 34 minutes: 641
- 35 to 39 minutes: 73
- 40 to 44 minutes: 109
- 45 to 59 minutes: 363
- 60 to 89 minutes: 25
- 90 or more minutes: 50
Means of transportation to work:
- Drove a car alone: 2,080 (76.4%)
- Carpooled: 550 (20.2%)
- Other means: 7 (0.3%)
- Worked at home: 84 (3.1%)
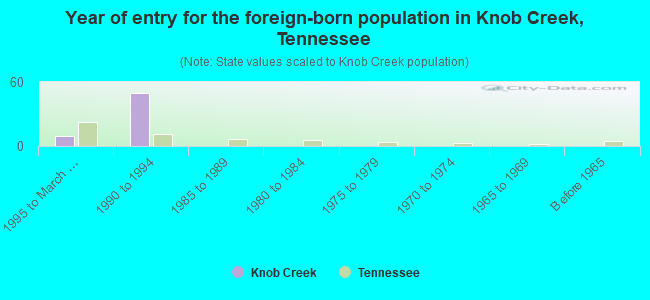
- Year of entry for the foreign-born population in Knob Creek, Tennessee
- 91995 to March 2000
- 501990 to 1994
- 01985 to 1989
- 01980 to 1984
- 01975 to 1979
- 01970 to 1974
- 01965 to 1969
- 0Before 1965
Most common places of birth for foreign-born residents (%):
| Knob Creek: | 64.4% (38) |
| Tennessee: | 2.6% (4,078) |
| Knob Creek: | 15.3% (9) |
| Tennessee: | 28.1% (44,682) |
| Knob Creek: | 11.9% (7) |
| Tennessee: | 0.4% (599) |
| Knob Creek: | 8.5% (5) |
| Tennessee: | 3.8% (6,106) |
Place of birth for U.S.-born residents:
- This state: 3,748
- Other state: 1,764
- Northeast: 202
- Midwest: 600
- South: 902
- West: 60
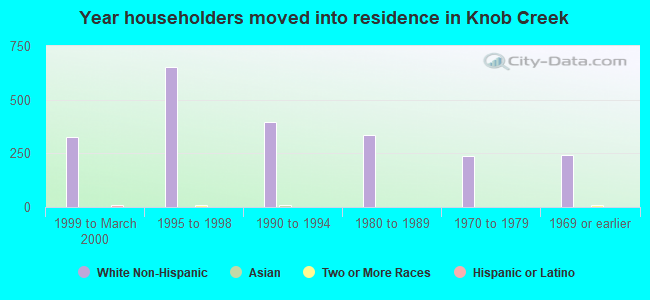
59% of Knob Creek residents lived in the same house 5 years ago.
Out of people who lived in different houses, 55% lived in this county.
Out of people who lived in different counties, 42% lived in Tennessee.
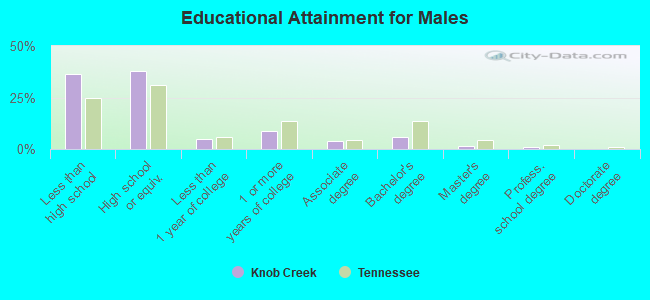
Education attainment for males 25 years and older:
- No schooling: 32
- Nursery to 4th grade: 26
- 5th and 6th grade: 35
- 7th and 8th grade: 268
- 9th grade: 78
- 10th grade: 95
- 11th grade: 91
- 12th grade, no diploma: 52
- High school graduate (or equivalency): 704
- Less than 1 year of college: 88
- Some college more than 1 year, no degree: 163
- Associate degree: 68
- Bachelor's degree: 111
- Master's degree: 27
- Professional school degree: 16
- Doctorate degree: 0
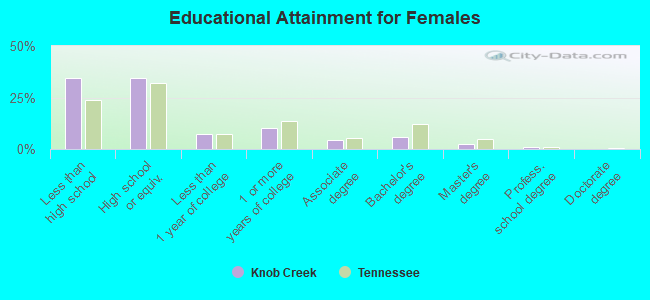
Education attainment for females 25 years and older:
- No schooling: 35
- Nursery to 4th grade: 21
- 5th and 6th grade: 22
- 7th and 8th grade: 218
- 9th grade: 78
- 10th grade: 133
- 11th grade: 84
- 12th grade, no diploma: 78
- High school graduate (or equivalency): 667
- Less than 1 year of college: 138
- Some college more than 1 year, no degree: 201
- Associate degree: 80
- Bachelor's degree: 117
- Master's degree: 48
- Professional school degree: 17
- Doctorate degree: 0


Housing units in structures:
- One, detached: 1,856
- Two: 51
- 3 or 4: 24
- Mobile homes: 756
Median worth of mobile homes: $77,411
Housing units lacking complete kitchen facilities: 2.6%
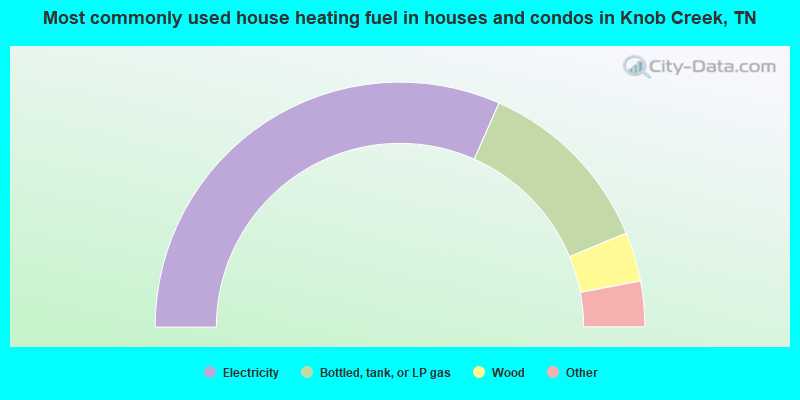
- 63.2%Electricity
- 24.2%Bottled, tank, or LP gas
- 6.5%Wood
- 3.9%Fuel oil, kerosene, etc.
- 1.7%Utility gas
- 0.4%Other fuel
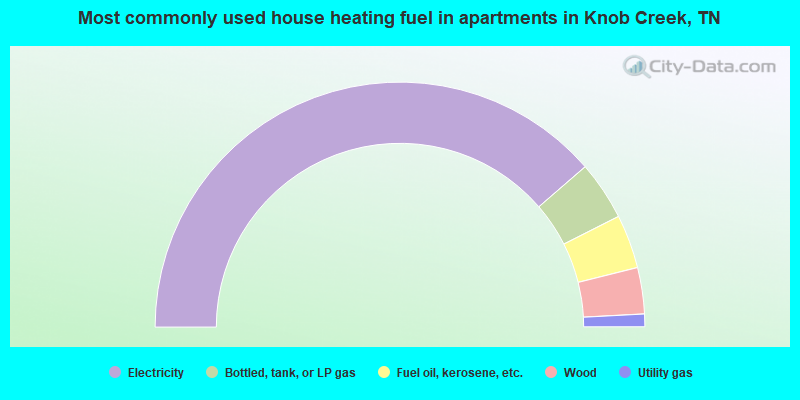
- 77.3%Electricity
- 7.8%Bottled, tank, or LP gas
- 7.1%Fuel oil, kerosene, etc.
- 6.1%Wood
- 1.7%Utility gas
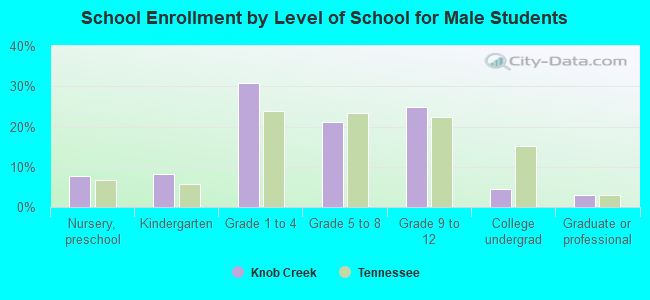
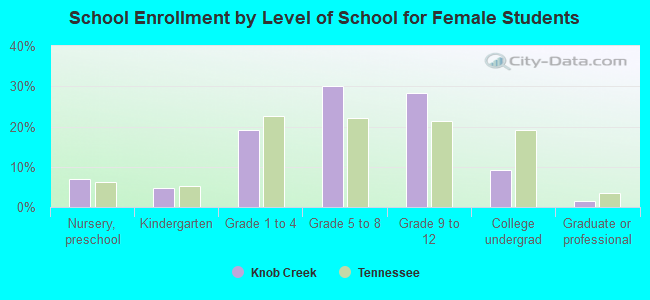
Private vs. public school enrollment:
| Here: | 4.0% |
| Tennessee: | 9.5% |
| Here: | 3.1% |
| Tennessee: | 10.4% |
| Here: | 0.0% |
| Tennessee: | 22.8% |