Jump to a detailed profile or search site with Google Custom Search

La Canada Flintridge, CA (California) Houses and Residents

Estimated median house or condo value in 2022: $2,182,118 (it was $588,200 in 2000)
La Canada Flintridge:

$2,182,118
California:

$715,900
Lower value quartile - upper value quartile: $1,608,438 - $2,190,193

Mean price in 2022:

Detached houses: $2,339,446
Here:

$2,339,446
State:

$988,808

Townhouses or other attached units: $970,380
Here:

$970,380
State:

$838,546

In 5-or-more-unit structures: $432,128
Here:

$432,128
State:

$730,996

Total population: 20,662 (Urban population: 20,381, Rural population: 0)

Houses: 7,065 (6,526 occupied: 5,828 owner occupied, 723 renter occupied)

% of renters here:

11%
State:

44%

Housing density: 817 houses/condos per square mile

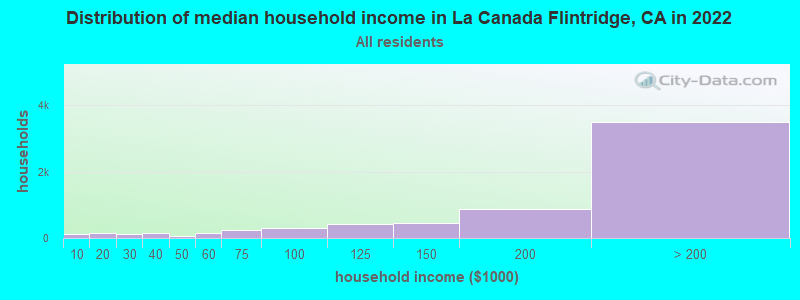
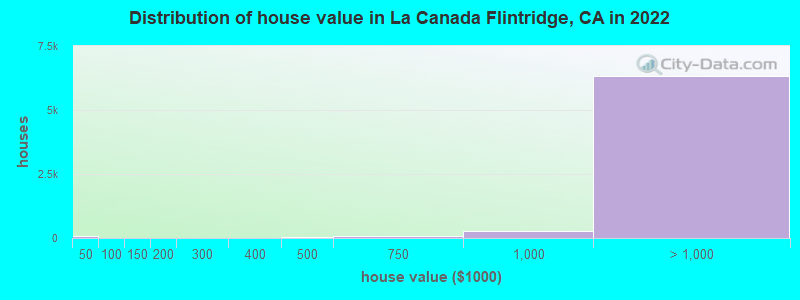
Median price asked for vacant for-sale houses and condos in 2022: $6,325,802.

Median contract rent in 2022: over $2,000 (lower quartile is over $2,000, upper quartile is over $2,000)


Median rent asked for vacant for-rent units in 2022: $6,724


Median gross rent in La Canada Flintridge, CA in 2022: over $2,000

Housing units in La Canada Flintridge with a mortgage: 3,810 (602 second mortgage, 48 home equity loan, 521 both second mortgage and home equity loan)
Houses without a mortgage: 47

Median household income for houses/condos with a mortgage: $248,703

Median household income for apartments without a mortgage: $182,381

Median monthly housing costs: $3,935

Compare current foreclosures near La Canada Flintridge, CA:

Check out more offers near La Canada Flintridge, CA.
Powered by Foreclosure.com


La Canada Flintridge, California Age and Sex of Residents
Median year house/condo built: 1957

Median year apartment built: 1958

Household type by relationship:

Households: 19,935
  • Male householders: 3,376 (228 living alone), Female householders: 2,934 (457 living alone)
  • 4,923 spouses (4,877 opposite-sex spouses), 78 unmarried partners, (78 opposite-sex unmarried partners), 7,393 children (7,135 natural, 168 adopted, 89 stepchildren), 190 grandchildren, 30 brothers or sisters, 353 parents, 0 foster children, 180 other relatives, 423 non-relatives
  • In group quarters: 50

Size of family households: 2,006 2-persons, 1,115 3-persons, 1,555 4-persons, 758 5-persons, 99 6-persons, 65 7-or-more-persons.

Size of nonfamily households: 736 1-person, 156 2-persons, 9 3-persons.

4,726 married couples with children.
414 single-parent households (116 men, 298 women).

69.5% of residents of La Canada Flintridge speak English at home.
5.7% of residents speak Spanish at home (74% speak English very well, 21% speak English well, 5% speak English not well).
9.3% of residents speak other Indo-European language at home (83% speak English very well, 10% speak English well, 7% speak English not well).
15.8% of residents speak Asian or Pacific Island language at home (60% speak English very well, 26% speak English well, 13% speak English not well, 1% don't speak English at all).
0.7% of residents speak other language at home (91% speak English very well, 9% don't speak English at all).

Foreign born population: 5,013 (25.1%)
(74.4% of them are naturalized citizens)

Median number of rooms in houses and condos:
Here:

7.6
State:

6.0

Median number of rooms in apartments
Here:

5.1
State:

3.9

Owner-occupied Renter-occupied
Bedrooms in owner-occupied houses and condos in La Canada Flintridge, California
  • Bedrooms in owner-occupied houses and condos in La Canada Flintridge, California
  • 0no bedroom
  • 731 bedroom
  • 4112 bedrooms
  • 2,0143 bedrooms
  • 2,4294 bedrooms
  • 9015+ bedrooms
Bedrooms in renter-occupied apartments in La Canada Flintridge, California
  • Bedrooms in renter-occupied apartments in La Canada Flintridge, California
  • 0no bedroom
  • 331 bedroom
  • 2142 bedrooms
  • 3383 bedrooms
  • 444 bedrooms
  • 945+ bedrooms
Owner-occupied Renter-occupied
Cars and other vehicles available in La Canada Flintridge in owner-occupied houses/condos
  • Cars and other vehicles available in La Canada Flintridge in owner-occupied houses/condos
  • 105no vehicle
  • 8071 vehicle
  • 2,6122 vehicles
  • 1,4033 vehicles
  • 6294 vehicles
  • 2735+ vehicles
Cars and other vehicles available in La Canada Flintridge in renter-occupied apartments
  • Cars and other vehicles available in La Canada Flintridge in renter-occupied apartments
  • 8no vehicle
  • 1181 vehicle
  • 3282 vehicles
  • 1903 vehicles
  • 794 vehicles
  • 05+ vehicles
Owner-occupied Renter-occupied
Rooms in owner-occupied houses in La Canada Flintridge, California
  • Rooms in owner-occupied houses in La Canada Flintridge, California
  • 01 room
  • 82 rooms
  • 603 rooms
  • 2154 rooms
  • 5915 rooms
  • 8366 rooms
  • 1,0087 rooms
  • 1,1088 rooms
  • 2,0039+ rooms
Rooms in renter-occupied apartments in La Canada Flintridge, California
  • Rooms in renter-occupied apartments in La Canada Flintridge, California
  • 01 room
  • 162 rooms
  • 223 rooms
  • 1984 rooms
  • 1995 rooms
  • 1356 rooms
  • 557 rooms
  • 498 rooms
  • 499+ rooms
Year house built
Median 2022 house/condo value by year built
Median house/condo value by year householder moved into unit
Breakdown of mean house values by ages of householders
  • La Canada Flintridge, CA household income distribution

  • Distribution of median household income in La Canada Flintridge, CA in 2022
  • 124Less than $10,000
  • 164$10,000 to $19,999
  • 125$20,000 to $29,999
  • 156$30,000 to $39,999
  • 49$40,000 to $49,999
  • 163$50,000 to $59,999
  • 254$60,000 to $74,999
  • 314$75,000 to $99,999
  • 409$100,000 to $124,999
  • 439$125,000 to $149,999
  • 886$150,000 to $199,999
  • 3,497$200,000 or more
  • Home value of owner - occupied houses in 2022 in La Canada Flintridge, CA

  • Distribution of house value in La Canada Flintridge, CA in 2022
  • 59Less than $10,000
  • 12$50,000 to $59,999
  • 7$100,000 to $124,999
  • 14$150,000 to $174,999
  • 17$300,000 to $399,999
  • 37$400,000 to $499,999
  • 80$500,000 to $749,999
  • 265$750,000 to $999,999
  • 1,110$1,000,000 to $1,499,999
  • 1,833$1,500,000 to $1,999,999
  • 3,393$2,000,000 or more
  • Rent paid by renters in 2022 in La Canada Flintridge, CA

  • Distribution of rent paid by renters in La Canada Flintridge, CA in 2022
  • 12$1,000 to $1,249
  • 10$1,250 to $1,499
  • 98$1,500 to $1,999
  • 119$2,000 to $2,499
  • 20$2,500 to $2,999
  • 80$3,000 to $3,499
  • 315$3,500 or more
  • 91No cash rent
Time Leaving Home To Go To Work in 2022

Percentage of workers working in this county: 98.0%
Number of people working at home: 2,723 (31.7% of all workers)

Travel time (in minutes) to work in 2022

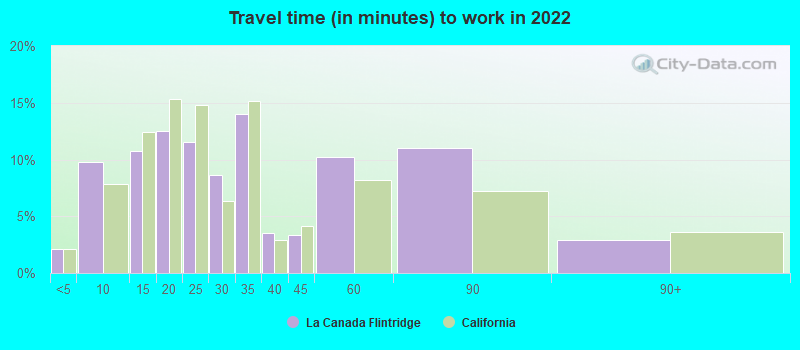
Travel time to work (commute)

  • Less than 5 minutes: 151
  • 5 to 9 minutes: 466
  • 10 to 14 minutes: 797
  • 15 to 19 minutes: 625
  • 20 to 24 minutes: 737
  • 25 to 29 minutes: 494
  • 30 to 34 minutes: 1,095
  • 35 to 39 minutes: 292
  • 40 to 44 minutes: 403
  • 45 to 59 minutes: 599
  • 60 to 89 minutes: 445
  • 90 or more minutes: 122
Means of transportation to work in 2022 - La Canada Flintridge

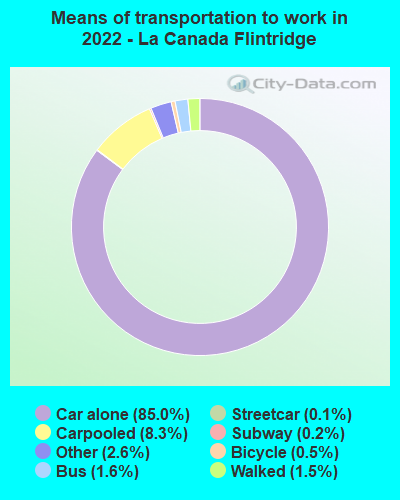
Means of transportation to work:

  • Drove a car alone: 5,072 (60.4%)
  • Carpooled: 550 (6.5%)
  • Bus: 87 (1.0%)
  • Subway or elevated rail: 6 (0.1%)
  • Long-distance train or commuter rail: 7 (0.1%)
  • Taxi: 172 (2.0%)
  • Bicycle: 31 (0.4%)
  • Walked: 99 (1.2%)
  • Worked at home: 2,723 (32.4%)
Class of Workers in 2022
  • Unemployment by race in 2022
  • Unemployment rate for White non-Hispanic residents
  • 4.3%Males
  • 2.5%Females
  • Unemployment rate for Asian residents
  • 5.3%Males
  • 0.5%Females
  • Unemployment rate for two or more race residents
  • 12.5%Males
  • Unemployment rate for Hispanic or Latino residents
  • 3.0%Females
Year of entry for the foreign-born population in La Canada Flintridge, California
  • Year of entry for the foreign-born population in La Canada Flintridge, California
  • 5832010 or later
  • 6672000 to 2009
  • 1,1011990 to 1999
  • 1,1431980 to 1989
  • 1,1351970 to 1979
  • 944Before 1970
Ancestries in La Canada Flintridge, CA

First ancestries reported:

  • Armenian: 944 (8.9%)
  • English: 526 (5.0%)
  • Italian: 427 (4.0%)
  • German: 352 (3.3%)
  • European: 350 (3.3%)
  • Irish: 282 (2.7%)
  • American: 244 (2.3%)
  • Iranian: 229 (2.2%)
  • British: 129 (1.2%)
  • Dutch: 90 (0.8%)
  • Portuguese: 90 (0.8%)
  • Eastern European: 83 (0.8%)
  • Polish: 83 (0.8%)
  • French: 82 (0.8%)
  • Swedish: 80 (0.8%)
  • Scottish: 67 (0.6%)
  • Norwegian: 65 (0.6%)
  • Egyptian: 59 (0.6%)
  • Lithuanian: 43 (0.4%)
  • Greek: 41 (0.4%)
  • Northern European: 41 (0.4%)
  • Hungarian: 23 (0.2%)
  • Swiss: 23 (0.2%)
  • Russian: 22 (0.2%)
  • Scotch-Irish: 22 (0.2%)
  • Danish: 19 (0.2%)
  • French Canadian: 19 (0.2%)
  • Lebanese: 16 (0.2%)
  • Welsh: 16 (0.2%)
  • Croatian: 15 (0.1%)
  • Albanian: 10 (0.09%)
  • Romanian: 9 (0.08%)
  • Austrian: 9 (0.08%)
  • Maltese: 9 (0.08%)
  • Slovak: 9 (0.08%)
  • Australian: 9 (0.08%)
  • Scandinavian: 8 (0.08%)
  • Ukrainian: 8 (0.08%)
  • Canadian: 7 (0.07%)
  • Belgian: 7 (0.07%)
  • Israeli: 5 (0.05%)

Most common places of birth for foreign-born residents (%):

Korea
La Canada Flintridge:

32.9% (1,647)
California:

3.0% (315,248)

China, excluding Hong Kong and Taiwan
La Canada Flintridge:

6.3% (317)
California:

6.6% (684,672)

Iran
La Canada Flintridge:

5.6% (279)
California:

2.0% (206,004)

India
La Canada Flintridge:

4.9% (244)
California:

5.2% (539,184)

Taiwan
La Canada Flintridge:

4.5% (227)
California:

1.7% (176,274)

Colombia
La Canada Flintridge:

4.3% (215)
California:

0.5% (55,249)

Philippines
La Canada Flintridge:

4.1% (205)
California:

7.8% (818,297)

Canada
La Canada Flintridge:

3.6% (178)
California:

1.2% (127,477)

Vietnam
La Canada Flintridge:

2.8% (139)
California:

4.9% (512,335)

Mexico
La Canada Flintridge:

2.7% (137)
California:

37.2% (3,881,193)

Azerbaijan
La Canada Flintridge:

2.2% (109)
California:

0.1% (6,119)

Germany
La Canada Flintridge:

1.9% (94)
California:

0.7% (73,304)

Armenia
La Canada Flintridge:

1.7% (85)
California:

0.8% (78,847)

Place of birth for U.S.-born residents:

  • This state: 11,341
  • Other state: 3,344
  • Northeast: 927
  • Midwest: 1,063
  • South: 920
  • West: 431

89.4% of La Canada Flintridge residents lived in the same house 1 years ago.
   Out of people who lived in different houses, 44.0% lived in this county.
   Out of people who lived in different counties, 28.2% lived in California.


La Canada Flintridge:

89.4%
State average:

88.9%

Education attainment for males 25 years and older:

  • No schooling: 103
  • Nursery to 4th grade: 0
  • 5th and 6th grade: 0
  • 7th and 8th grade: 28
  • 9th grade: 4
  • 10th grade: 10
  • 11th grade: 4
  • 12th grade, no diploma: 12
  • High school graduate (or equivalency): 330
  • Less than 1 year of college: 133
  • Some college more than 1 year, no degree: 607
  • Associate degree: 233
  • Bachelor's degree: 2,539
  • Master's degree: 1,395
  • Professional school degree: 846
  • Doctorate degree: 427
Educational Attainment for Males

Education attainment for females 25 years and older:

  • No schooling: 53
  • Nursery to 4th grade: 0
  • 5th and 6th grade: 11
  • 7th and 8th grade: 24
  • 9th grade: 0
  • 10th grade: 0
  • 11th grade: 51
  • 12th grade, no diploma: 20
  • High school graduate (or equivalency): 508
  • Less than 1 year of college: 206
  • Some college more than 1 year, no degree: 574
  • Associate degree: 535
  • Bachelor's degree: 2,663
  • Master's degree: 1,391
  • Professional school degree: 890
  • Doctorate degree: 132
Educational Attainment for Females
La Canada Flintridge marital status for males
La Canada Flintridge marital status for females

Housing units in structures:

  • One, detached: 6,692
  • One, attached: 144
  • 3 or 4: 115
  • 5 to 9: 48
  • 10 to 19: 49
  • 20 to 49: 14
Housing units lacking complete plumbing facilities in 2022: 0.5%

Housing units lacking complete kitchen facilities in 2022: 0.4%

House/condo owner moved in on average 16 years ago

Renter moved in on average 4 years ago

Year householders moved into residence in La Canada Flintridge
Houses and condos Apartments
Most commonly used house heating fuel in houses and condos in La Canada Flintridge, CA
  • 84.4%Utility gas
  • 13.0%Electricity
  • 1.7%Bottled, tank, or LP gas
  • 0.6%Solar energy
  • 0.2%Wood
Most commonly used house heating fuel in apartments in La Canada Flintridge, CA
  • 76.1%Utility gas
  • 22.5%Electricity
  • 1.4%Bottled, tank, or LP gas

Private vs. public school enrollment:

Students in private schools in grades 1 to 8 (elementary and middle school): 260
Here:

10.3%
California:

10.5%

Students in private schools in grades 9 to 12 (high school): 211
Here:

11.3%
California:

8.5%

Students in private undergraduate colleges: 154
Here:

28.6%
California:

15.9%
School Enrollment by Level of School for Male Students
School Enrollment by Level of School for Female Students
Age and Sex of Sensory-Disabled Noninstitutionalized Residents
Age and Sex of Physically-Disabled Noninstitutionalized Residents
Age and Sex of Mentally-Disabled Noninstitutionalized Residents
Age and Sex of Self-Care Disabled Noninstitutionalized Residents
Age and Sex of Go-Outside-Home Disabled Noninstitutionalized Residents
Age and Sex of Noninstitutionalized Residents with Employment Disability