La Cienega, NM (New Mexico) Houses and Residents
| La Cienega: | $436,126 |
| New Mexico: | $243,100 |
Mean price in 2022:
Detached houses: $408,544
Here: $408,544 State: $322,045 Mobile homes: $224,566
Here: $224,566 State: $117,675
Total population: 3,819 (Urban population: 1,735, Rural population: 1,288 (122 farm, 1,166 nonfarm))
Houses: 1,407 (1,354 occupied: 1,155 owner occupied, 251 renter occupied)
| % of renters here: | 18% |
| State: | 29% |
Housing density: 105 houses/condos per square mile
Median price asked for vacant for-sale houses and condos in 2022 in this county: $272,239.
Median contract rent in 2022: $894 (lower quartile is $585, upper quartile is $1,037)
Median rent asked for vacant for-rent units in 2022: $496
Median gross rent in La Cienega, NM in 2022: $963
Housing units in La Cienega with a mortgage: 816 (20 second mortgage, 0 home equity loan, 0 both second mortgage and home equity loan)
Houses without a mortgage: 0
Median household income for houses/condos with a mortgage: $107,601
Median household income for apartments without a mortgage: $79,706
Median monthly housing costs: $1,464
Compare current foreclosures near La Cienega, NM:
| Photo | Address | Area | Beds / Baths | Price | Details |
|---|---|---|---|---|---|

|
#1
Avenida De Las Alturas
Santa Fe, NM 87505
|
1,644 sq. feet
|
2 baths 3 beds |
$529,900
|
show details |

|
#2
Bishops Lodge Rd
Santa Fe, NM 87501
|
- sq. feet
|
3 baths 4 beds |
show details | |

|
#3
San Benito St Unit B
Santa Fe, NM 87507
|
- sq. feet
|
- baths - beds |
show details | |

|
#4
Woods Loop
Santa Fe, NM 87505
|
- sq. feet
|
- baths - beds |
show details | |

|
#5
Sunset St Apt H
Santa Fe, NM 87501
|
- sq. feet
|
- baths - beds |
show details | |

|
#6
Griffin St, C O Kay Carlson Notary Pu
Santa Fe, NM 87501
|
- sq. feet
|
- baths - beds |
show details | |

|
#7
Fort Union Dr
Santa Fe, NM 87505
|
- sq. feet
|
- baths - beds |
show details | |

|
#8
Camino Carlos Rey
Santa Fe, NM 87507
|
- sq. feet
|
- baths - beds |
show details | |

|
#9
Aster Ln
Santa Fe, NM 87507
|
- sq. feet
|
- baths - beds |
show details | |

|
#10
Los Pinos Rd
Santa Fe, NM 87507
|
- sq. feet
|
- baths - beds |
show details |
| Photo | Address | Area | Beds / Baths | Price | Details |
|---|---|---|---|---|---|

|
#11
Santo Domingo St Unit C
Santa Fe, NM 87507
|
- sq. feet
|
- baths - beds |
show details | |

|
#12
Jaramillo Ln
Santa Fe, NM 87507
|
- sq. feet
|
- baths - beds |
show details | |

|
#13
Bonitas Loop
Santa Fe, NM 87507
|
- sq. feet
|
- baths - beds |
show details | |

|
#14
Jemez Rd, Trlr 32
Santa Fe, NM 87507
|
- sq. feet
|
- baths - beds |
show details | |

|
#15
Zepol Rd, Trlr 123
Santa Fe, NM 87507
|
- sq. feet
|
- baths - beds |
show details | |

|
#16
Erica
Santa Fe, NM 87507
|
- sq. feet
|
- baths - beds |
show details | |

|
#17
Mesa Del Oro Loop
Santa Fe, NM 87507
|
- sq. feet
|
- baths - beds |
show details | |

|
#18
Pinon Vista St
Santa Fe, NM 87501
|
- sq. feet
|
- baths - beds |
show details | |

|
#19
Monte Azul Pl
Santa Fe, NM 87507
|
- sq. feet
|
- baths - beds |
show details | |

|
#20
N Guadalupe St # 620
Santa Fe, NM 87501
|
- sq. feet
|
- baths - beds |
show details |
| Photo | Address | Area | Beds / Baths | Price | Details |
|---|---|---|---|---|---|

|
#21
Granada St
Santa Fe, NM 87505
|
- sq. feet
|
- baths - beds |
show details | |

|
#22
Paseo De La Conquistadora
Santa Fe, NM 87501
|
- sq. feet
|
- baths - beds |
show details | |

|
#23
Calle Roble
Santa Fe, NM 87501
|
- sq. feet
|
- baths - beds |
show details | |

|
#24
Miguel Chavez Rd Unit 116
Santa Fe, NM 87505
|
- sq. feet
|
- baths - beds |
show details | |

|
#25
Calle Ensenada
Santa Fe, NM 87505
|
- sq. feet
|
- baths - beds |
show details | |

|
#26
Avenida Aldea
Santa Fe, NM 87507
|
- sq. feet
|
- baths - beds |
show details | |

|
#27
Calle Lisa
Santa Fe, NM 87507
|
- sq. feet
|
- baths - beds |
show details | |

|
#28
Avenida De Isidro
Santa Fe, NM 87505
|
- sq. feet
|
- baths - beds |
show details | |

|
#29
Camino Consuelo
Santa Fe, NM 87507
|
- sq. feet
|
- baths - beds |
show details | |

|
#30
Calle Carmilita
Santa Fe, NM 87505
|
- sq. feet
|
- baths - beds |
show details |
| Photo | Address | Area | Beds / Baths | Price | Details |
|---|---|---|---|---|---|

|
Check over 1 million property listings on Foreclosure.com!
|
browse all offers | |||
| Photo | Address | Area | Beds / Baths | Price | Details |
|---|


 | Gardening in SF (18 replies) |
| Recommend a kiva builder (11 replies) |
| Avoid Airport Road Area?? (12 replies) |
| Camper attacked (59 replies) |
| Monsoons - Santa Fe Area, Discussion (58 replies) |
| santa fe demographics (60 replies) |

Median year apartment built: 1983
Household type by relationship:
Households: 3,978- Male householders: 584 (95 living alone), Female householders: 746 (127 living alone)
665 spouses (656 opposite-sex spouses), 133 unmarried partners, (133 opposite-sex unmarried partners), 1,123 children (1,057 natural, 21 adopted, 45 stepchildren), 366 grandchildren, 62 brothers or sisters, 143 parents, 0 foster children, 145 other relatives, 8 non-relatives
Size of family households: 373 2-persons, 349 3-persons, 87 4-persons, 114 5-persons, 74 6-persons, 21 7-or-more-persons.
Size of nonfamily households: 244 1-person, 77 2-persons.
463 married couples with children.
120 single-parent households (9 men, 111 women).
47.5% of residents of La Cienega speak English at home.
51.3% of residents speak Spanish at home (56% speak English very well, 20% speak English well, 17% speak English not well, 7% don't speak English at all).
1.1% of residents speak Asian or Pacific Island language at home (100% speak English very well).
Foreign born population: 1,061 (26.7%)
(34.9% of them are naturalized citizens)
| Here: | 5.4 |
| State: | 5.9 |
| Here: | 3.8 |
| State: | 4.2 |

- Bedrooms in owner-occupied houses and condos in La Cienega, New Mexico
- 45no bedroom
- 511 bedroom
- 892 bedrooms
- 8423 bedrooms
- 934 bedrooms
- 365+ bedrooms

- Bedrooms in renter-occupied apartments in La Cienega, New Mexico
- 0no bedroom
- 01 bedroom
- 1482 bedrooms
- 943 bedrooms
- 104 bedrooms
- 05+ bedrooms

- Cars and other vehicles available in La Cienega in owner-occupied houses/condos
- 0no vehicle
- 1511 vehicle
- 1882 vehicles
- 5643 vehicles
- 1404 vehicles
- 1145+ vehicles

- Cars and other vehicles available in La Cienega in renter-occupied apartments
- 31no vehicle
- 751 vehicle
- 792 vehicles
- 03 vehicles
- 674 vehicles
- 05+ vehicles

- Rooms in owner-occupied houses in La Cienega, New Mexico
- 451 room
- 512 rooms
- 153 rooms
- 2764 rooms
- 2705 rooms
- 2386 rooms
- 1327 rooms
- 618 rooms
- 699+ rooms

- Rooms in renter-occupied apartments in La Cienega, New Mexico
- 01 room
- 02 rooms
- 943 rooms
- 554 rooms
- 595 rooms
- 256 rooms
- 07 rooms
- 108 rooms
- 109+ rooms


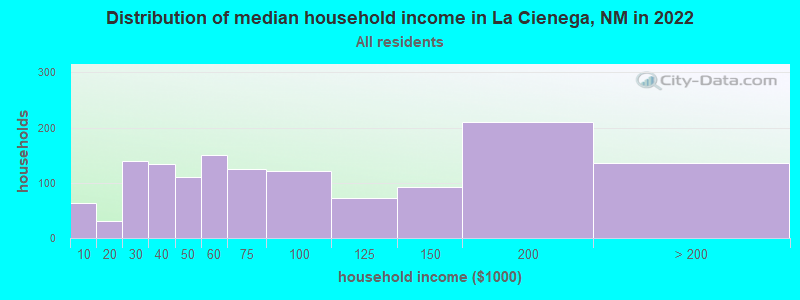
La Cienega, NM household income distribution

- 64Less than $10,000
- 30$10,000 to $19,999
- 140$20,000 to $29,999
- 134$30,000 to $39,999
- 111$40,000 to $49,999
- 151$50,000 to $59,999
- 125$60,000 to $74,999
- 122$75,000 to $99,999
- 72$100,000 to $124,999
- 93$125,000 to $149,999
- 210$150,000 to $199,999
- 136$200,000 or more
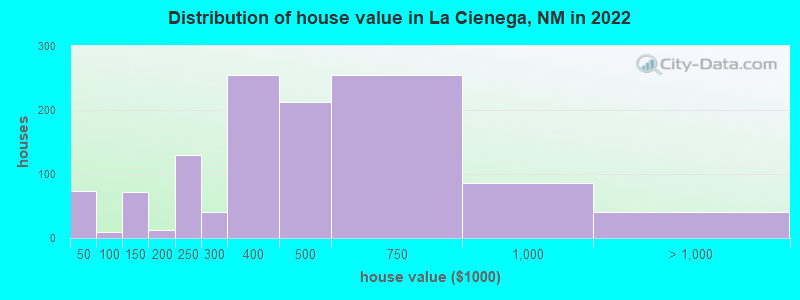
Home value of owner - occupied houses in 2022 in La Cienega, NM
-
- 59$10,000 to $14,999
- 6$15,000 to $19,999
- 6$25,000 to $29,999
- 10$80,000 to $89,999
- 61$100,000 to $124,999
- 10$125,000 to $149,999
- 6$150,000 to $174,999
- 5$175,000 to $199,999
- 129$200,000 to $249,999
- 41$250,000 to $299,999
- 254$300,000 to $399,999
- 213$400,000 to $499,999
- 253$500,000 to $749,999
- 85$750,000 to $999,999
- 13$1,000,000 to $1,499,999
- 27$1,500,000 to $1,999,999
Rent paid by renters in 2022 in La Cienega, NM
-
- 31$200 to $249
- 17$550 to $599
- 82$800 to $899
- 23$900 to $999
- 30$1,000 to $1,249
- 10$1,250 to $1,499
- 17$3,500 or more
- 31No cash rent


Percentage of workers working in this county: 94.1%
Number of people working at home: 180 (8.1% of all workers)
Travel time to work (commute)
- Less than 5 minutes: 75
- 5 to 9 minutes: 47
- 10 to 14 minutes: 56
- 15 to 19 minutes: 302
- 20 to 24 minutes: 440
- 25 to 29 minutes: 213
- 30 to 34 minutes: 631
- 35 to 39 minutes: 11
- 40 to 44 minutes: 51
- 45 to 59 minutes: 60
- 60 to 89 minutes: 81
- 90 or more minutes: 24
Means of transportation to work:
- Drove a car alone: 1,036 (72.7%)
- Carpooled: 353 (24.8%)
- Walked: 28 (2.0%)
- Other means: 9 (0.6%)

- Unemployment by race in 2022
- Unemployment rate for White non-Hispanic residents
- 5.7%Males
- Unemployment rate for two or more race residents
- 5.8%Males
- 3.6%Females
- Unemployment rate for Hispanic or Latino residents
- 5.2%Males
- 5.9%Females

- Year of entry for the foreign-born population in La Cienega, New Mexico
- 2422010 or later
- 1652000 to 2009
- 3921990 to 1999
- 571980 to 1989
- 01970 to 1979
- 40Before 1970

First ancestries reported:
- American: 45 (1.7%)
- European: 31 (1.2%)
- Scottish: 28 (1.1%)
- English: 27 (1.0%)
- Norwegian: 26 (1.0%)
- Irish: 24 (0.9%)
- Finnish: 20 (0.8%)
- Italian: 18 (0.7%)
- Eastern European: 10 (0.4%)
- Swedish: 10 (0.4%)
- German: 8 (0.3%)
- Dutch: 7 (0.3%)
- Northern European: 7 (0.3%)
Most common places of birth for foreign-born residents (%):
| La Cienega: | 58.7% (626) |
| New Mexico: | 66.5% (129,316) |
| La Cienega: | 22.0% (235) |
| New Mexico: | 0.8% (1,561) |
| La Cienega: | 14.4% (153) |
| New Mexico: | 1.1% (2,049) |
Place of birth for U.S.-born residents:
- This state: 1,914
- Other state: 820
- Northeast: 90
- Midwest: 101
- South: 294
- West: 348
97.8% of La Cienega residents lived in the same house 1 years ago.
Out of people who lived in different houses, 35.2% lived in this county.
Out of people who lived in different counties, 45.7% lived in New Mexico.
| La Cienega: | 97.8% |
| State average: | 88.2% |
Education attainment for males 25 years and older:
- No schooling: 74
- Nursery to 4th grade: 24
- 5th and 6th grade: 0
- 7th and 8th grade: 3
- 9th grade: 59
- 10th grade: 38
- 11th grade: 23
- 12th grade, no diploma: 13
- High school graduate (or equivalency): 390
- Less than 1 year of college: 36
- Some college more than 1 year, no degree: 174
- Associate degree: 60
- Bachelor's degree: 195
- Master's degree: 153
- Professional school degree: 0
- Doctorate degree: 6

Education attainment for females 25 years and older:
- No schooling: 0
- Nursery to 4th grade: 36
- 5th and 6th grade: 147
- 7th and 8th grade: 18
- 9th grade: 3
- 10th grade: 0
- 11th grade: 88
- 12th grade, no diploma: 19
- High school graduate (or equivalency): 268
- Less than 1 year of college: 28
- Some college more than 1 year, no degree: 263
- Associate degree: 91
- Bachelor's degree: 165
- Master's degree: 114
- Professional school degree: 6
- Doctorate degree: 0


Housing units in structures:
- One, detached: 980
- Two: 9
- Mobile homes: 385
- Boats, RVs, vans, etc.: 31
Median worth of mobile homes: $227,406
Housing units lacking complete kitchen facilities in 2022: 1.1%
House/condo owner moved in on average 10 years ago
Renter moved in on average 1 years ago

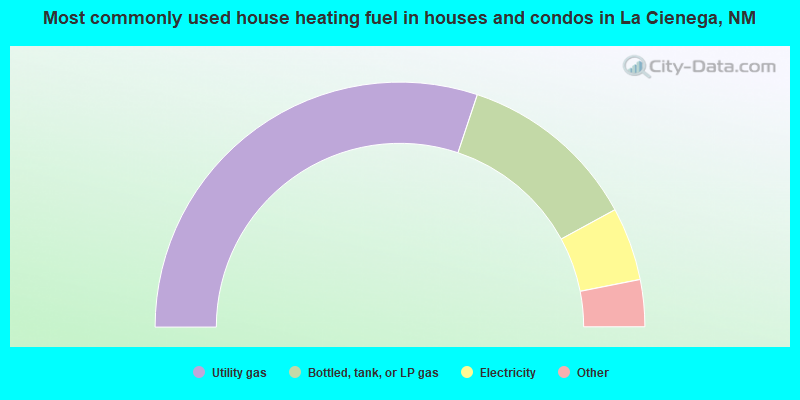
- 60.3%Utility gas
- 23.9%Bottled, tank, or LP gas
- 9.7%Electricity
- 3.3%Wood
- 2.9%Other fuel
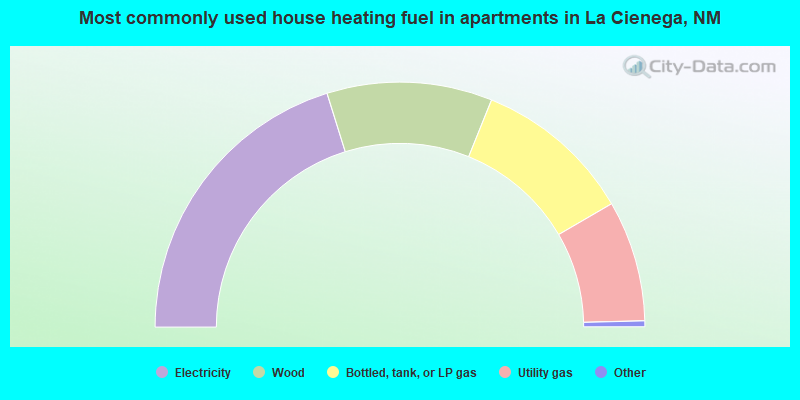
- 40.7%Electricity
- 22.0%Wood
- 21.2%Bottled, tank, or LP gas
- 16.1%Utility gas
Private vs. public school enrollment:
| Here: | 5.3% |
| New Mexico: | 10.2% |
| Here: | 1.7% |
| New Mexico: | 10.0% |
| Here: | 0.0% |
| New Mexico: | 12.3% |


