La Grange, IL (Illinois) Houses and Residents
Estimated median house or condo value in 2022: $561,546 (it was $255,500 in 2000 )
La Grange:
$561,546Illinois:
$251,600
Lower value quartile - upper value quartile: $359,984 - $795,287Mean price in 2022: Detached houses: $713,149 Here:
$713,149State:
$310,164
Townhouses or other attached units: $324,459 Here:
$324,459State:
$286,230
In 2-unit structures: $261,989 Here:
$261,989State:
$299,638
In 3-to-4-unit structures: $227,987 Here:
$227,987State:
$330,907
In 5-or-more-unit structures: $266,475 Here:
$266,475State:
$318,887
Total population: 15,759 (Urban population: 15,724, Rural population: 0)
Houses: 6,086 (5,815 occupied: 4,857 owner occupied, 1,057 renter occupied )
% of renters here:
18%State:
33%
Housing density: 2,426 houses/condos per square mile
Median price asked for vacant for-sale houses and condos in 2022: $2,307,077.
Median contract rent in 2022: $1,554 (lower quartile is $1,123, upper quartile is $1,988)
Median rent asked for vacant for-rent units in 2022: $1,021
Median gross rent in La Grange, IL in 2022: $1,632
Housing units in La Grange with a mortgage: 3,228 (612 second mortgage, 28 home equity loan, 539 both second mortgage and home equity loan )Houses without a mortgage: 19
Median household income for houses/condos with a mortgage: $197,508
Median household income for apartments without a mortgage: $93,451
Median monthly housing costs: $2,192
Data:
Median house or condo value ($)
Median house or condo value ($ change since 2000)
Median house or condo value ($) - White
Median house or condo value ($) - Black or African American
Median house or condo value ($) - Asian
Median house or condo value ($) - Hispanic or Latino
Median house or condo value ($) - American Indian and Alaska Native
Median house or condo value ($) - Multirace
Median house or condo value ($) - Other Race
Median price asked for mobile homes ($)
Household density (households per square mile)
Mean house or condo value by units in structure - 1, detached ($)
Mean house or condo value by units in structure - 1, attached ($)
Mean house or condo value by units in structure - 2 ($)
Mean house or condo value by units in structure by units in structure - 3 or 4 ($)
Mean house or condo value by units in structure - 5 or more ($)
Mean house or condo value by units in structure - Boat, RV, van, etc. ($)
Mean house or condo value by units in structure - Mobile home ($)
Median contract rent ($)
Median contract rent - Lower quartile ($)
Median contract rent - Upper quartile ($)
Median gross rent ($)
Urban houses (%)
Rural houses (%)
Houses occupied (%)
Houses occupied (% change since 2000)
Houses owner occupied (%)
Houses owner occupied (% change since 2000)
Houses renter occupied (%)
Houses renter occupied (% change since 2000)
Vacant housing units - For rent (%)
Vacant housing units - For rent (% change since 2000)
Vacant housing units - For sale only (%)
Vacant housing units - For sale only (% change since 2000)
Vacant housing units - Rented or sold, not occupied (%)
Vacant housing units - Rented or sold, not occupied (% change since 2000)
Vacant housing units - For seasonal, recreational, or occasional use (%)
Vacant housing units - For seasonal, recreational, or occasional use (% change since 2000)
Vacant housing units - For migrant workers (%)
Vacant housing units - For migrant workers (% change since 2000)
Vacant housing units - Other vacant (%)
Vacant housing units - Other vacant (% change since 2000)
Median monthly housing costs ($)
Median household income for houses/condos with a mortgage ($)
Median household income for houses/condos without a mortgage ($)
Median household income ($)
Median household income ($) - White
Median household income ($) - Black or African American
Median household income ($) - Asian
Median household income ($) - Hispanic or Latino
Median household income ($) - American Indian and Alaska Native
Median household income ($) - Multirace
Median household income ($) - Other Race
Mortgage status - with mortgage (%)
Mortgage status - with second mortgage (%)
Mortgage status - with home equity loan (%)
Mortgage status - with both second mortgage and home equity loan (%)
Mortgage status - without a mortgage (%)
Median year house/condo built
Median year apartment built
Household type by relationship - Male householder living alone (%)
Household type by relationship - Male householder not living alone (%)
Household type by relationship - Female householder living alone (%)
Household type by relationship - Female householder not living alone (%)
Household type by relationship - Opposite-Sex spouse (%)
Household type by relationship - Same-Sex spouse (%)
Household type by relationship - Opposite-Sex unmarried partner (%)
Household type by relationship - Same-Sex unmarried partner (%)
Household type by relationship - In group quarters (%)
Size of family households - 2-person household (%)
Size of family households - 3-person household (%)
Size of family households - 4-person household (%)
Size of family households - 5-person household (%)
Size of family households - 6-person household (%)
Size of family households - 7-or-more-person household (%)
Size of nonfamily households - 1-person household (%)
Size of nonfamily households - 2-person household (%)
Size of nonfamily households - 3-person household (%)
Size of nonfamily households - 4-person household (%)
Size of nonfamily households - 5-person household (%)
Size of nonfamily households - 6-person household (%)
Size of nonfamily households - 7-or-moreperson household (%)
Year house built - Built 2010 or later (%)
Year house built - Built 2000 to 2009 (%)
Year house built - Built 1990 to 1999 (%)
Year house built - Built 1980 to 1989 (%)
Year house built - Built 1970 to 1979 (%)
Year house built - Built 1960 to 1969 (%)
Year house built - Built 1950 to 1959 (%)
Year house built - Built 1940 to 1949 (%)
Year house built - Built 1939 or earlier (%)
Median number of rooms in houses and condos
Median number of rooms in apartments
Median number of bedrooms in owner occupied houses
Mean number of bedrooms in owner occupied houses
Median number of bedrooms in renter occupied houses
Mean number of bedrooms in renter occupied houses
Median number of vehichles in owner occupied houses
Mean number of vehichles in owner occupied houses
Median number of vehichles in renter occupied houses
Mean number of vehichles in renter occupied houses
Rooms in owner-occupied houses - 1 room (%)
Rooms in owner-occupied houses - 2 rooms (%)
Rooms in owner-occupied houses - 3 rooms (%)
Rooms in owner-occupied houses - 4 rooms (%)
Rooms in owner-occupied houses - 5 rooms (%)
Rooms in owner-occupied houses - 6 rooms (%)
Rooms in owner-occupied houses - 7 rooms (%)
Rooms in owner-occupied houses - 8 rooms (%)
Rooms in owner-occupied houses - 9+ rooms (%)
Rooms in renter-occupied houses - 1 room (%)
Rooms in renter-occupied houses - 2 rooms (%)
Rooms in renter-occupied houses - 3 rooms (%)
Rooms in renter-occupied houses - 4 rooms (%)
Rooms in renter-occupied houses - 5 rooms (%)
Rooms in renter-occupied houses - 6 rooms (%)
Rooms in renter-occupied houses - 7 rooms (%)
Rooms in renter-occupied houses - 8 rooms (%)
Rooms in renter-occupied houses - 9+ rooms (%)
Bedrooms in owner-occupied houses - no bedrooms (%)
Bedrooms in owner-occupied houses - 1 bedroom (%)
Bedrooms in owner-occupied houses - 2 bedrooms (%)
Bedrooms in owner-occupied houses - 3 bedrooms (%)
Bedrooms in owner-occupied houses - 4 bedrooms (%)
Bedrooms in owner-occupied houses - 5+ bedrooms (%)
Bedrooms in renter-occupied houses - no bedrooms (%)
Bedrooms in renter-occupied houses - 1 bedroom (%)
Bedrooms in renter-occupied houses - 2 bedrooms (%)
Bedrooms in renter-occupied houses - 3 bedrooms (%)
Bedrooms in renter-occupied houses - 4 bedrooms (%)
Bedrooms in renter-occupied houses - 5+ bedrooms (%)
Vehicles available in owner-occupied houses - no vehicle available (%)
Vehicles available in owner-occupied houses - 1 vehicle available(%)
Vehicles available in owner-occupied houses - 2 Vehicles available (%)
Vehicles available in owner-occupied houses - 3 Vehicles available (%)
Vehicles available in owner-occupied houses - 4 Vehicles available (%)
Vehicles available in owner-occupied houses - 5+ Vehicles available (%)
Vehicles available in renter-occupied houses - no vehicle available (%)
Vehicles available in renter-occupied houses - 1 vehicle available (%)
Vehicles available in renter-occupied houses - 2 Vehicles available (%)
Vehicles available in renter-occupied houses - 3 Vehicles available (%)
Vehicles available in renter-occupied houses - 4 Vehicles available (%)
Vehicles available in renter-occupied houses - 5+ Vehicles available (%)
Housing units in structures - 1, detached (%)
Housing units in structures - 1, attached (%)
Housing units in structures - 2 (%)
Housing units in structures - 3 or 4 (%)
Housing units in structures - 5 to 9 (%)
Housing units in structures - 10 to 19 (%)
Housing units in structures - 20 to 49 (%)
Housing units in structures - 50 or more (%)
Housing units in structures - Mobile home (%)
Housing units in structures - Boat, RV, van, etc. (%)
Housing units in structures - Owners - 1, detached (%)
Housing units in structures - Owners - 1, attached (%)
Housing units in structures - Owners - 2 (%)
Housing units in structures - Owners - 3 or 4 (%)
Housing units in structures - Owners - 5 to 9 (%)
Housing units in structures - Owners - 10 to 19 (%)
Housing units in structures - Owners - 20 to 49 (%)
Housing units in structures - Owners - 50 or more (%)
Housing units in structures - Owners - Mobile home (%)
Housing units in structures - Owners - Boat, RV, van, etc. (%)
Housing units in structures - Renters - 1, detached (%)
Housing units in structures - Renters - 1, attached (%)
Housing units in structures - Renters - 2 (%)
Housing units in structures - Renters - 3 or 4 (%)
Housing units in structures - Renters - 5 to 9 (%)
Housing units in structures - Renters - 10 to 19 (%)
Housing units in structures - Renters - 20 to 49 (%)
Housing units in structures - Renters - 50 or more (%)
Housing units in structures - Renters - Mobile home (%)
Housing units in structures - Renters - Boat, RV, van, etc. (%)
House/condo owner moved in on average (years ago)
Renter moved in on average (years ago)
Year householder moved into unit - Moved in 1999 to March 2000 (%)
Year householder moved into unit - Moved in 1999 to March 2000 (%) - White
Year householder moved into unit - Moved in 1999 to March 2000 (%) - Black or African American
Year householder moved into unit - Moved in 1999 to March 2000 (%) - Asian
Year householder moved into unit - Moved in 1999 to March 2000 (%) - Hispanic or Latino
Year householder moved into unit - Moved in 1999 to March 2000 (%) - American Indian and Alaska Native
Year householder moved into unit - Moved in 1999 to March 2000 (%) - Multirace
Year householder moved into unit - Moved in 1999 to March 2000 (%) - Other Race
Year householder moved into unit - Moved in 1995 to 1998 (%)
Year householder moved into unit - Moved in 1995 to 1998 (%) - White
Year householder moved into unit - Moved in 1995 to 1998 (%) - Black or African American
Year householder moved into unit - Moved in 1995 to 1998 (%) - Asian
Year householder moved into unit - Moved in 1995 to 1998 (%) - Hispanic or Latino
Year householder moved into unit - Moved in 1995 to 1998 (%) - American Indian and Alaska Native
Year householder moved into unit - Moved in 1995 to 1998 (%) - Multirace
Year householder moved into unit - Moved in 1995 to 1998 (%) - Other Race
Year householder moved into unit - Moved in 1990 to 1994 (%)
Year householder moved into unit - Moved in 1990 to 1994 (%) - White
Year householder moved into unit - Moved in 1990 to 1994 (%) - Black or African American
Year householder moved into unit - Moved in 1990 to 1994 (%) - Asian
Year householder moved into unit - Moved in 1990 to 1994 (%) - Hispanic or Latino
Year householder moved into unit - Moved in 1990 to 1994 (%) - American Indian and Alaska Native
Year householder moved into unit - Moved in 1990 to 1994 (%) - Multirace
Year householder moved into unit - Moved in 1990 to 1994 (%) - Other Race
Year householder moved into unit - Moved in 1980 to 1989 (%)
Year householder moved into unit - Moved in 1980 to 1989 (%) - White
Year householder moved into unit - Moved in 1980 to 1989 (%) - Black or African American
Year householder moved into unit - Moved in 1980 to 1989 (%) - Asian
Year householder moved into unit - Moved in 1980 to 1989 (%) - Hispanic or Latino
Year householder moved into unit - Moved in 1980 to 1989 (%) - American Indian and Alaska Native
Year householder moved into unit - Moved in 1980 to 1989 (%) - Multirace
Year householder moved into unit - Moved in 1980 to 1989 (%) - Other Race
Year householder moved into unit - Moved in 1970 to 1979 (%)
Year householder moved into unit - Moved in 1970 to 1979 (%) - White
Year householder moved into unit - Moved in 1970 to 1979 (%) - Black or African American
Year householder moved into unit - Moved in 1970 to 1979 (%) - Asian
Year householder moved into unit - Moved in 1970 to 1979 (%) - Hispanic or Latino
Year householder moved into unit - Moved in 1970 to 1979 (%) - American Indian and Alaska Native
Year householder moved into unit - Moved in 1970 to 1979 (%) - Multirace
Year householder moved into unit - Moved in 1970 to 1979 (%) - Other Race
Year householder moved into unit - Moved in 1969 or earlier (%)
Year householder moved into unit - Moved in 1969 or earlier (%) - White
Year householder moved into unit - Moved in 1969 or earlier (%) - Black or African American
Year householder moved into unit - Moved in 1969 or earlier (%) - Asian
Year householder moved into unit - Moved in 1969 or earlier (%) - Hispanic or Latino
Year householder moved into unit - Moved in 1969 or earlier (%) - American Indian and Alaska Native
Year householder moved into unit - Moved in 1969 or earlier (%) - Multirace
Year householder moved into unit - Moved in 1969 or earlier (%) - Other Race
Housing units lacking complete plumbing facilities (%)
Housing units lacking complete kitchen facilities (%)
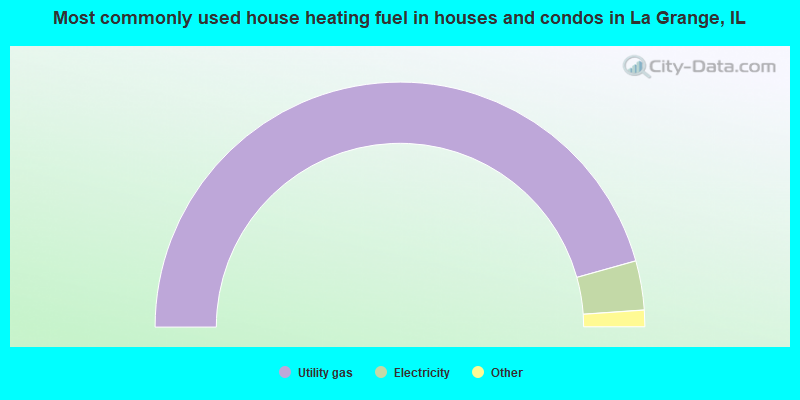
House heating fuel used in houses and condos - Utility gas (%)
House heating fuel used in houses and condos - Bottled, tank, or LP gas (%)
House heating fuel used in houses and condos - Electricity (%)
House heating fuel used in houses and condos - Fuel oil, kerosene, etc. (%)
House heating fuel used in houses and condos - Coal or coke (%)
House heating fuel used in houses and condos - Wood (%)
House heating fuel used in houses and condos - Solar energy (%)
House heating fuel used in houses and condos - Other fuel (%)
House heating fuel used in houses and condos - No fuel used (%)
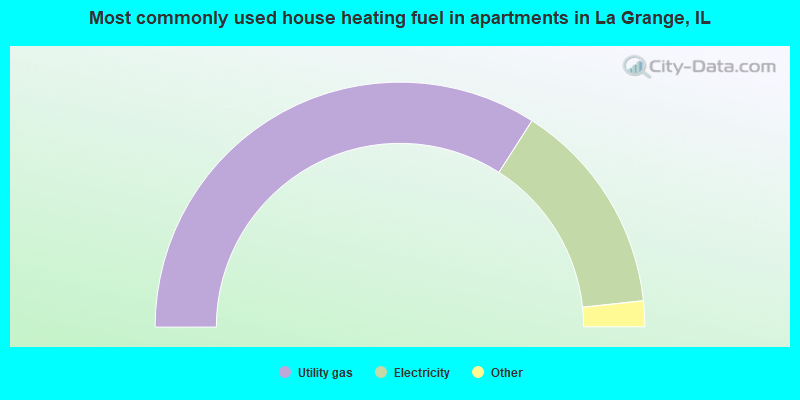
House heating fuel used in apartments - Utility gas (%)
House heating fuel used in apartments - Bottled, tank, or LP gas (%)
House heating fuel used in apartments - Electricity (%)
House heating fuel used in apartments - Fuel oil, kerosene, etc. (%)
House heating fuel used in apartments - Coal or coke (%)
House heating fuel used in apartments - Wood (%)
House heating fuel used in apartments - Solar energy (%)
House heating fuel used in apartments - Other fuel (%)
House heating fuel used in apartments - No fuel used (%)
Median year house/condo built: 1950Median year apartment built: 1967Household type by relationship:
Households: 15,769
Male householders: 2,796 (486 living alone ), Female householders: 2,865 (879 living alone )3,527 spouses (3,527 opposite-sex spouses ), 204 unmarried partners , (204 opposite-sex unmarried partners ), 5,475 children (5,300 natural , 60 adopted , 114 stepchildren ), 139 grandchildren , 68 brothers or sisters , 109 parents , 0 foster children , 153 other relatives , 86 non-relatives In group quarters: 342
Size of family households: 1,672 2-persons , 861 3-persons , 1,077 4-persons , 525 5-persons , 111 6-persons , 21 7-or-more-persons .
Size of nonfamily households: 1,467 1-person , 102 2-persons , 12 4-persons .
3,640 married couples with children. single-parent households (178 men , 293 women ).
87.7% of residents of La Grange speak English at home. of residents speak Spanish at home (83% speak English very well , 13% speak English well , 3% speak English not well , 1% don't speak English at all ).of residents speak other Indo-European language at home (63% speak English very well , 30% speak English well , 7% speak English not well ).of residents speak Asian or Pacific Island language at home (45% speak English very well , 35% speak English well , 20% don't speak English at all ).of residents speak other language at home (53% speak English very well , 47% speak English well ).
Foreign born population: 1,043 (6.6%)of them are naturalized citizens )
Median number of rooms in houses and condos:
Median number of rooms in apartments
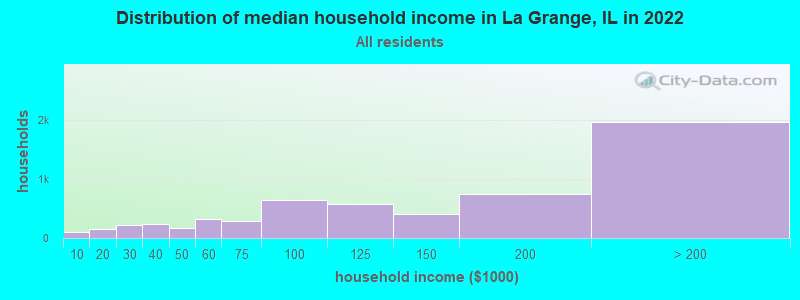
La Grange, IL household income distribution 106 Less than $10,000161 $10,000 to $19,999226 $20,000 to $29,999231 $30,000 to $39,999174 $40,000 to $49,999317 $50,000 to $59,999284 $60,000 to $74,999639 $75,000 to $99,999570 $100,000 to $124,999401 $125,000 to $149,999744 $150,000 to $199,9991,971 $200,000 or more
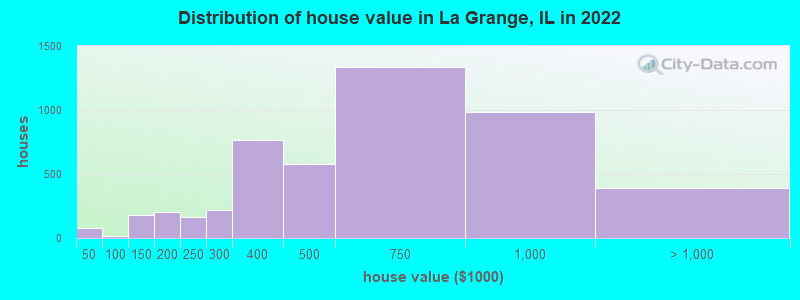
Home value of owner - occupied houses in 2022 in La Grange, IL 49 Less than $10,00010 $15,000 to $19,9999 $30,000 to $34,9997 $40,000 to $49,9996 $50,000 to $59,9994 $90,000 to $99,99942 $100,000 to $124,999139 $125,000 to $149,99977 $150,000 to $174,999123 $175,000 to $199,999162 $200,000 to $249,999215 $250,000 to $299,999762 $300,000 to $399,999575 $400,000 to $499,9991,338 $500,000 to $749,999980 $750,000 to $999,999277 $1,000,000 to $1,499,999109 $1,500,000 to $1,999,999Rent paid by renters in 2022 in La Grange, IL 31 $600 to $64917 $650 to $69953 $750 to $79952 $800 to $89959 $900 to $999101 $1,000 to $1,249152 $1,250 to $1,499317 $1,500 to $1,999124 $2,000 to $2,49927 $2,500 to $2,99916 $3,000 to $3,49983 $3,500 or more40 No cash rent
Percentage of workers working in this county: 83.1%Number of people working at home: 2,310 (29.7% of all workers )
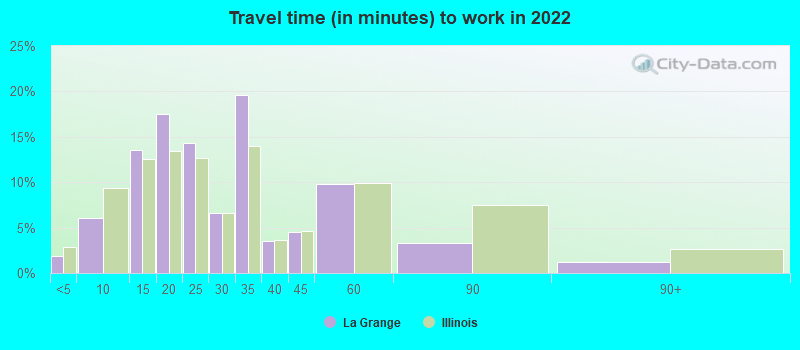
Travel time to work (commute)
Less than 5 minutes: 875 to 9 minutes: 67110 to 14 minutes: 40215 to 19 minutes: 58420 to 24 minutes: 75725 to 29 minutes: 26030 to 34 minutes: 91135 to 39 minutes: 15040 to 44 minutes: 37245 to 59 minutes: 71160 to 89 minutes: 68190 or more minutes: 144
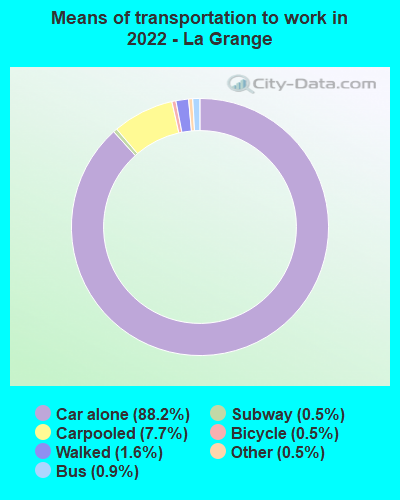
Means of transportation to work:
Drove a car alone: 7,329 (71.3%)Carpooled: 688 (6.7%)Bus : 68 (0.7%)Long-distance train or commuter rail : 27 (0.3%)Taxi: 44 (0.4%)Bicycle: 45 (0.4%)Walked: 138 (1.3%)Worked at home: 2,310 (22.5%)
Unemployment by race in 2022
Unemployment rate for White non-Hispanic residents 2.1% Males1.2% FemalesUnemployment rate for Hispanic or Latino residents 2.0% Females
Year of entry for the foreign-born population in La Grange, Illinois
102 2010 or later 167 2000 to 2009 338 1990 to 1999 130 1980 to 1989 89 1970 to 1979 428 Before 1970
First ancestries reported:
Irish: 1,202 (18.0%)
Polish: 777 (11.6%)
American: 471 (7.1%)
German: 430 (6.4%)
English: 400 (6.0%)
Italian: 290 (4.3%)
Serbian: 268 (4.0%)
Czech: 192 (2.9%)
Palestinian: 144 (2.2%)
European: 113 (1.7%)
Scottish: 76 (1.1%)
Slovak: 69 (1.0%)
Lithuanian: 68 (1.0%)
Croatian: 61 (0.9%)
Greek: 47 (0.7%)
Slovene: 46 (0.7%)
French: 42 (0.6%)
Haitian: 39 (0.6%)
Russian: 38 (0.6%)
Swedish: 38 (0.6%)
Norwegian: 37 (0.6%)
Eastern European: 30 (0.4%)
Ukrainian: 26 (0.4%)
Latvian: 25 (0.4%)
Macedonian: 24 (0.4%)
Dutch: 21 (0.3%)
Scandinavian: 18 (0.3%)
Canadian: 16 (0.2%)
British: 13 (0.2%)
Portuguese: 11 (0.2%)
Scotch-Irish: 11 (0.2%)
Belgian: 10 (0.1%)
Northern European: 9 (0.1%)
Luxembourger: 8 (0.1%)
Welsh: 8 (0.1%)
Austrian: 7 (0.1%)
Arab: 6 (0.09%)
African: 6 (0.09%)
Danish: 5 (0.07%) Most common places of birth for foreign-born residents (%): Mexico La Grange:
33.2% (346)Illinois:
34.7% (626,958)
Serbia La Grange:
10.2% (106)Illinois:
0.5% (8,574)
Colombia La Grange:
8.6% (90)Illinois:
0.9% (16,553)
Poland La Grange:
5.6% (58)Illinois:
6.9% (124,474)
France La Grange:
4.8% (50)Illinois:
0.3% (5,895)
Canada La Grange:
3.5% (36)Illinois:
1.1% (19,306)
Czechoslovakia (includes Czech Republic and Slovakia) La Grange:
3.4% (35)Illinois:
0.3% (4,741)
Ireland La Grange:
3.2% (33)Illinois:
0.4% (6,611)
Germany La Grange:
2.8% (29)Illinois:
1.0% (18,753)
Italy La Grange:
2.8% (29)Illinois:
0.9% (15,679)
Korea La Grange:
2.4% (25)Illinois:
2.2% (40,393)
Lithuania La Grange:
2.3% (24)Illinois:
0.6% (10,249)
China, excluding Hong Kong and Taiwan La Grange:
1.9% (20)Illinois:
4.1% (74,364)
Ecuador La Grange:
1.7% (18)Illinois:
0.9% (16,844)
Place of birth for U.S.-born residents:
This state: 11,864Other state: 2,687Northeast: 532Midwest: 1,452South: 520West: 221 89.0% of La Grange residents lived in the same house 1 years ago.
Out of people who lived in different houses, 44.1% lived in this county.
Out of people who lived in different counties, 46.4% lived in Illinois.
La Grange:
89.0%State average:
88.3%
Education attainment for males 25 years and older:
No schooling: 70Nursery to 4th grade: 85th and 6th grade: 07th and 8th grade: 369th grade: 2410th grade: 3011th grade: 012th grade, no diploma: 76High school graduate (or equivalency): 619Less than 1 year of college: 162Some college more than 1 year, no degree: 495Associate degree: 293Bachelor's degree: 1,848Master's degree: 1,036Professional school degree: 228Doctorate degree: 117
Education attainment for females 25 years and older:
No schooling: 9Nursery to 4th grade: 105th and 6th grade: 07th and 8th grade: 179th grade: 010th grade: 2911th grade: 2212th grade, no diploma: 7High school graduate (or equivalency): 856Less than 1 year of college: 288Some college more than 1 year, no degree: 523Associate degree: 385Bachelor's degree: 1,748Master's degree: 1,244Professional school degree: 263Doctorate degree: 151
Housing units in structures:
One, detached: 4,232One, attached: 128Two: 2413 or 4: 1985 to 9: 25010 to 19: 55420 to 49: 25150 or more: 214Mobile homes: 15Housing units lacking complete plumbing facilities in 2022: 0.9%Housing units lacking complete kitchen facilities in 2022: 0.9%House/condo owner moved in on average 16 years ago
Renter moved in on average 1 years ago
Private vs. public school enrollment:
Students in private schools in grades 1 to 8 (elementary and middle school): 192 Students in private schools in grades 9 to 12 (high school): 53 Students in private undergraduate colleges: 91