La Habra Heights, CA (California) Houses and Residents
| La Habra Heights: | $1,176,493 |
| California: | $715,900 |
Mean price in 2022:
Detached houses: $1,805,137
Here: $1,805,137 State: $988,808
Total population: 5,466 (Urban population: 5,402, Rural population: 0)
Houses: 2,064 (1,949 occupied: 1,745 owner occupied, 211 renter occupied)
| % of renters here: | 11% |
| State: | 44% |
Housing density: 333 houses/condos per square mile
Median price asked for vacant for-sale houses and condos in 2022: $787,717.
Median gross rent in La Habra Heights, CA in 2022: $1,208
Housing units in La Habra Heights with a mortgage: 1,112 (90 second mortgage, 0 home equity loan, 93 both second mortgage and home equity loan)
Houses without a mortgage: 15
Median household income for houses/condos with a mortgage: $219,886
Median household income for apartments without a mortgage: $176,150
Median monthly housing costs: $2,580
Compare current foreclosures near La Habra Heights, CA:
| Photo | Address | Area | Beds / Baths | Price | Details |
|---|---|---|---|---|---|

|
#1
Millbury Ave
Baldwin Park, CA 91706
|
1,632 sq. feet
|
2 baths 4 beds |
$850,000
|
show details |

|
#2
E Norma Ave
West Covina, CA 91791
|
1,134 sq. feet
|
2 baths 3 beds |
$599,000
|
show details |

|
#3
E Holton St
West Covina, CA 91791
|
- sq. feet
|
2 baths 3 beds |
$450,000
|
show details |

|
#4
Bohlig Rd Apt 45
Los Angeles, CA 90032
|
813 sq. feet
|
2 baths 2 beds |
show details | |

|
#5
Norwalk Blvd Apt
Hawaiian Gardens, CA 90716
|
800 sq. feet
|
2 baths 1 beds |
show details | |

|
#6
E Jackson Ave Unit C
Anaheim, CA 92806
|
1,266 sq. feet
|
2 baths 3 beds |
show details | |

|
#7
And 6111 Northside Drive
Los Angeles, CA 90022
|
1,329 sq. feet
|
4 baths 3 beds |
show details | |

|
#8
W Arbor St # 57
Long Beach, CA 90805
|
1,585 sq. feet
|
2 baths 3 beds |
show details | |

|
#9
N Magnolia Ave Apt D
Anaheim, CA 92801
|
1,292 sq. feet
|
2 baths 3 beds |
show details | |

|
#10
Elburg St Unit A
Paramount, CA 90723
|
1,131 sq. feet
|
2 baths 3 beds |
show details |
| Photo | Address | Area | Beds / Baths | Price | Details |
|---|---|---|---|---|---|

|
#11
Redondo Avenue, Units 5-8
Long Beach, CA 90804
|
3,360 sq. feet
|
4 baths 8 beds |
show details | |

|
#12
14th St
Chino, CA 91710
|
1,526 sq. feet
|
2 baths 3 beds |
show details | |

|
#13
Daroca Ave
San Gabriel, CA 91775
|
1,318 sq. feet
|
2 baths 2 beds |
show details | |

|
#14
Lexington Ave
El Monte, CA 91731
|
2,312 sq. feet
|
3 baths 4 beds |
show details | |

|
#15
Pomering Rd
Downey, CA 90241
|
1,549 sq. feet
|
2 baths 3 beds |
show details | |

|
#16
S Daisy Ave
Santa Ana, CA 92703
|
1,088 sq. feet
|
1 baths 3 beds |
show details | |

|
#17
Cortland Ave
Paramount, CA 90723
|
2,354 sq. feet
|
3 baths 4 beds |
show details | |

|
#18
Firebird Ave
Whittier, CA 90605
|
897 sq. feet
|
1 baths 2 beds |
show details | |

|
#19
N Myrtlewood Ave
West Covina, CA 91791
|
1,854 sq. feet
|
3 baths 3 beds |
show details | |

|
#20
Fernbank Ave
Monterey Park, CA 91754
|
1,310 sq. feet
|
2 baths 3 beds |
show details |
| Photo | Address | Area | Beds / Baths | Price | Details |
|---|---|---|---|---|---|

|
#21
W Burke Dr
Montebello, CA 90640
|
3,845 sq. feet
|
6 baths 5 beds |
show details | |

|
#22
Curtis And King Rd
Norwalk, CA 90650
|
1,947 sq. feet
|
2 baths 3 beds |
show details | |

|
#23
Lees Ave
Long Beach, CA 90808
|
887 sq. feet
|
1 baths 2 beds |
show details | |

|
#24
E Palmerstone St
Compton, CA 90221
|
1,410 sq. feet
|
2 baths 3 beds |
show details | |

|
#25
Meadow View Dr
Pomona, CA 91766
|
1,538 sq. feet
|
2 baths 4 beds |
show details | |

|
#26
N Vera Cruz St
Montebello, CA 90640
|
1,701 sq. feet
|
2 baths 3 beds |
show details | |

|
#27
Johnson Ave
Long Beach, CA 90805
|
1,252 sq. feet
|
2 baths 3 beds |
show details | |

|
#28
Catalina Ave #108
Pasadena, CA 91106
|
1,269 sq. feet
|
2 baths 2 beds |
show details | |

|
#29
Skyview Cir
Pomona, CA 91766
|
2,060 sq. feet
|
3 baths 4 beds |
show details | |

|
#30
Date St
Montebello, CA 90640
|
1,440 sq. feet
|
2 baths 3 beds |
show details |
| Photo | Address | Area | Beds / Baths | Price | Details |
|---|---|---|---|---|---|

|
#31
Virginia St
Lynwood, CA 90262
|
1,548 sq. feet
|
2 baths 3 beds |
show details | |

|
#32
Wagon Train Ln
Diamond Bar, CA 91765
|
3,554 sq. feet
|
3 baths 4 beds |
show details | |

|
#33
W Wilson St
Pomona, CA 91768
|
576 sq. feet
|
1 baths 1 beds |
show details | |

|
#34
Jackson St
Garden Grove, CA 92841
|
- sq. feet
|
1 baths 4 beds |
show details | |

|
#35
Englewild Dr
Glendora, CA 91741
|
4,585 sq. feet
|
4 baths 4 beds |
show details | |

|
#36
Flora St
Montclair, CA 91763
|
1,145 sq. feet
|
2 baths 4 beds |
show details | |

|
#37
Clarissa St
Garden Grove, CA 92840
|
1,098 sq. feet
|
2 baths 3 beds |
show details | |

|
#38
S Towne Ave
Pomona, CA 91766
|
1,980 sq. feet
|
3 baths 3 beds |
show details | |

|
#39
W Tudor St
Covina, CA 91722
|
1,745 sq. feet
|
2 baths 4 beds |
show details | |

|
#40
Calico Ave
Pico Rivera, CA 90660
|
2,220 sq. feet
|
2 baths 3 beds |
show details |
| Photo | Address | Area | Beds / Baths | Price | Details |
|---|---|---|---|---|---|

|
#41
Calendula Ave
Fountain Valley, CA 92708
|
1,615 sq. feet
|
2 baths 4 beds |
show details | |

|
#42
Fry St
Bell Gardens, CA 90201
|
2,467 sq. feet
|
3 baths 6 beds |
show details | |

|
#43
& 5917a Everett Ave
Huntington Park, CA 90255
|
- sq. feet
|
1 baths 2 beds |
show details | |

|
#44
N Gordon St
Pomona, CA 91768
|
1,653 sq. feet
|
2 baths 3 beds |
show details | |

|
#45
W Olinda Ln
Anaheim, CA 92804
|
1,399 sq. feet
|
2 baths 3 beds |
show details | |

|
#46
Arlee Ave
Norwalk, CA 90650
|
872 sq. feet
|
1 baths 2 beds |
show details | |

|
#47
E 54th St
Maywood, CA 90270
|
1,066 sq. feet
|
1 baths 2 beds |
show details | |

|
#48
Locust St
Chino, CA 91710
|
2,611 sq. feet
|
3 baths 3 beds |
show details | |

|
#49
Adelita St
Montebello, CA 90640
|
2,435 sq. feet
|
3 baths 4 beds |
show details | |

|
Check over 1 million property listings on Foreclosure.com!
|
browse all offers | |||


Median year apartment built: 1942
Household type by relationship:
Households: 5,477- Male householders: 1,221 (249 living alone), Female householders: 663 (85 living alone)
1,201 spouses (1,201 opposite-sex spouses), 37 unmarried partners, (33 opposite-sex unmarried partners), 1,433 children (1,378 natural, 48 adopted, 5 stepchildren), 241 grandchildren, 36 brothers or sisters, 176 parents, 0 foster children, 160 other relatives, 280 non-relatives
- In group quarters: 25
Size of family households: 609 2-persons, 307 3-persons, 339 4-persons, 123 5-persons, 71 6-persons, 25 7-or-more-persons.
Size of nonfamily households: 358 1-person, 55 2-persons, 61 3-persons.
584 married couples with children.
62 single-parent households (20 men, 42 women).
64.7% of residents of La Habra Heights speak English at home.
17.4% of residents speak Spanish at home (89% speak English very well, 11% speak English well).
4.8% of residents speak other Indo-European language at home (100% speak English very well).
13.4% of residents speak Asian or Pacific Island language at home (28% speak English very well, 39% speak English well, 28% speak English not well, 5% don't speak English at all).
0.6% of residents speak other language at home (24% speak English very well, 76% speak English not well).
Foreign born population: 1,391 (25.4%)
(84.2% of them are naturalized citizens)
| Here: | 6.6 |
| State: | 6.0 |
| Here: | 3.7 |
| State: | 3.9 |

- Bedrooms in owner-occupied houses and condos in La Habra Heights, California
- 25no bedroom
- 01 bedroom
- 1822 bedrooms
- 6733 bedrooms
- 5834 bedrooms
- 2825+ bedrooms

- Bedrooms in renter-occupied apartments in La Habra Heights, California
- 91no bedroom
- 01 bedroom
- 472 bedrooms
- 193 bedrooms
- 214 bedrooms
- 335+ bedrooms

- Cars and other vehicles available in La Habra Heights in owner-occupied houses/condos
- 30no vehicle
- 2891 vehicle
- 6252 vehicles
- 4553 vehicles
- 1934 vehicles
- 1535+ vehicles

- Cars and other vehicles available in La Habra Heights in renter-occupied apartments
- 91no vehicle
- 61 vehicle
- 312 vehicles
- 283 vehicles
- 214 vehicles
- 335+ vehicles

- Rooms in owner-occupied houses in La Habra Heights, California
- 251 room
- 02 rooms
- 423 rooms
- 1394 rooms
- 1385 rooms
- 4816 rooms
- 2237 rooms
- 2758 rooms
- 4219+ rooms

- Rooms in renter-occupied apartments in La Habra Heights, California
- 911 room
- 02 rooms
- 93 rooms
- 314 rooms
- 255 rooms
- 06 rooms
- 07 rooms
- 218 rooms
- 339+ rooms


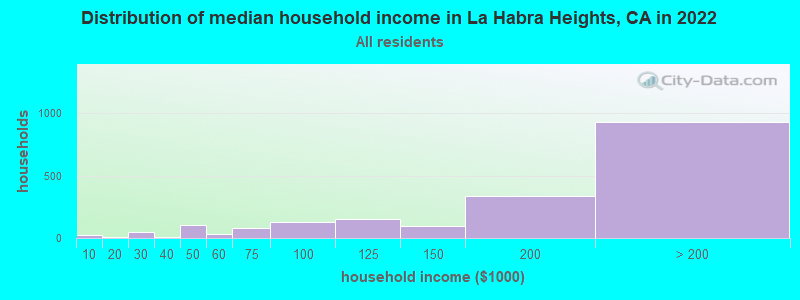
La Habra Heights, CA household income distribution

- 26Less than $10,000
- 8$10,000 to $19,999
- 52$20,000 to $29,999
- 10$30,000 to $39,999
- 107$40,000 to $49,999
- 34$50,000 to $59,999
- 79$60,000 to $74,999
- 125$75,000 to $99,999
- 153$100,000 to $124,999
- 97$125,000 to $149,999
- 333$150,000 to $199,999
- 930$200,000 or more
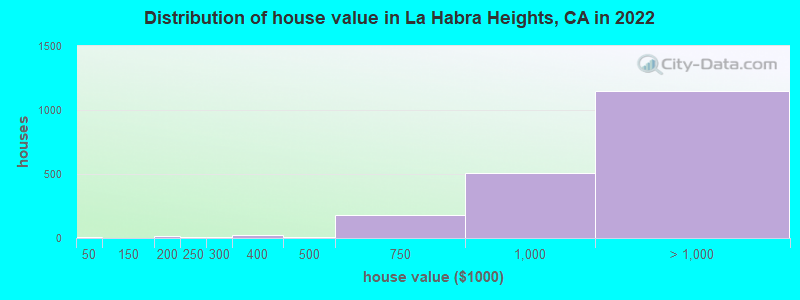
Home value of owner - occupied houses in 2022 in La Habra Heights, CA
-
- 11Less than $10,000
- 12$150,000 to $174,999
- 6$200,000 to $249,999
- 9$250,000 to $299,999
- 24$300,000 to $399,999
- 5$400,000 to $499,999
- 181$500,000 to $749,999
- 503$750,000 to $999,999
- 747$1,000,000 to $1,499,999
- 195$1,500,000 to $1,999,999
- 206$2,000,000 or more
Rent paid by renters in 2022 in La Habra Heights, CA
-
- 75$650 to $699
- 20$900 to $999
- 10$1,000 to $1,249
- 50$1,500 to $1,999
- 43$3,500 or more


Percentage of workers working in this county: 70.0%
Number of people working at home: 467 (16.3% of all workers)
Travel time to work (commute)
- Less than 5 minutes: 64
- 5 to 9 minutes: 43
- 10 to 14 minutes: 82
- 15 to 19 minutes: 219
- 20 to 24 minutes: 389
- 25 to 29 minutes: 103
- 30 to 34 minutes: 188
- 35 to 39 minutes: 158
- 40 to 44 minutes: 308
- 45 to 59 minutes: 516
- 60 to 89 minutes: 249
- 90 or more minutes: 61
Means of transportation to work:
- Drove a car alone: 1,949 (79.2%)
- Carpooled: 277 (11.3%)
- Bus or trolley bus: 17 (0.7%)
- Railroad: 4 (0.2%)
- Bicycle: 17 (0.7%)
- Walked: 12 (0.5%)
- Worked at home: 186 (7.6%)

- Unemployment by race in 2022
- Unemployment rate for White non-Hispanic residents
- 0.6%Males
- 3.0%Females
- Unemployment rate for Asian residents
- 1.8%Males
- 1.9%Females
- Unemployment rate for Hispanic or Latino residents
- 1.6%Females

- Year of entry for the foreign-born population in La Habra Heights, California
- 2762010 or later
- 2762000 to 2009
- 921990 to 1999
- 4181980 to 1989
- 2581970 to 1979
- 238Before 1970

First ancestries reported:
- English: 293 (9.1%)
- American: 182 (5.7%)
- German: 124 (3.9%)
- European: 120 (3.7%)
- Jamaican: 78 (2.4%)
- Italian: 46 (1.4%)
- Greek: 43 (1.3%)
- Scottish: 36 (1.1%)
- Northern European: 31 (1.0%)
- French: 20 (0.6%)
- Czech: 18 (0.6%)
- Finnish: 18 (0.6%)
- Russian: 13 (0.4%)
- Iranian: 10 (0.3%)
- Danish: 8 (0.2%)
- Irish: 8 (0.2%)
- Palestinian: 7 (0.2%)
- Armenian: 7 (0.2%)
- Polish: 6 (0.2%)
- British: 5 (0.2%)
- Canadian: 5 (0.2%)
Most common places of birth for foreign-born residents (%):
| La Habra Heights: | 13.0% (181) |
| California: | 6.6% (684,672) |
| La Habra Heights: | 11.4% (158) |
| California: | 0.6% (57,953) |
| La Habra Heights: | 11.1% (154) |
| California: | 37.2% (3,881,193) |
| La Habra Heights: | 10.8% (150) |
| California: | 5.2% (539,184) |
| La Habra Heights: | 8.5% (118) |
| California: | 1.7% (176,274) |
| La Habra Heights: | 7.1% (99) |
| California: | 0.3% (28,176) |
| La Habra Heights: | 6.8% (95) |
| California: | 2.8% (290,436) |
| La Habra Heights: | 4.6% (64) |
| California: | 0.8% (78,847) |
| La Habra Heights: | 4.2% (58) |
| California: | 3.0% (315,248) |
| La Habra Heights: | 3.5% (48) |
| California: | 7.8% (818,297) |
| La Habra Heights: | 3.2% (44) |
| California: | 0.2% (16,384) |
| La Habra Heights: | 3.2% (44) |
| California: | 0.6% (60,582) |
| La Habra Heights: | 2.3% (32) |
| California: | 1.2% (127,477) |
| La Habra Heights: | 2.0% (28) |
| California: | 0.2% (23,058) |
| La Habra Heights: | 1.7% (24) |
| California: | 0.5% (51,974) |
| La Habra Heights: | 1.5% (21) |
| California: | 0.6% (66,590) |
Place of birth for U.S.-born residents:
- This state: 3,172
- Other state: 870
- Northeast: 146
- Midwest: 333
- South: 268
- West: 115
88.3% of La Habra Heights residents lived in the same house 1 years ago.
Out of people who lived in different houses, 23.6% lived in this county.
Out of people who lived in different counties, 75.4% lived in California.
| La Habra Heights: | 88.3% |
| State average: | 88.9% |
Education attainment for males 25 years and older:
- No schooling: 8
- Nursery to 4th grade: 0
- 5th and 6th grade: 22
- 7th and 8th grade: 0
- 9th grade: 0
- 10th grade: 0
- 11th grade: 0
- 12th grade, no diploma: 24
- High school graduate (or equivalency): 172
- Less than 1 year of college: 174
- Some college more than 1 year, no degree: 219
- Associate degree: 232
- Bachelor's degree: 561
- Master's degree: 358
- Professional school degree: 119
- Doctorate degree: 176

Education attainment for females 25 years and older:
- No schooling: 44
- Nursery to 4th grade: 4
- 5th and 6th grade: 1
- 7th and 8th grade: 0
- 9th grade: 0
- 10th grade: 0
- 11th grade: 13
- 12th grade, no diploma: 48
- High school graduate (or equivalency): 262
- Less than 1 year of college: 148
- Some college more than 1 year, no degree: 231
- Associate degree: 223
- Bachelor's degree: 635
- Master's degree: 348
- Professional school degree: 238
- Doctorate degree: 9


Housing units in structures:
- One, detached: 1,967
- One, attached: 68
- 3 or 4: 9
- 10 to 19: 10
- 50 or more: 8
Housing units lacking complete kitchen facilities in 2022: 2.2%
House/condo owner moved in on average 17 years ago
Renter moved in on average 11 years ago

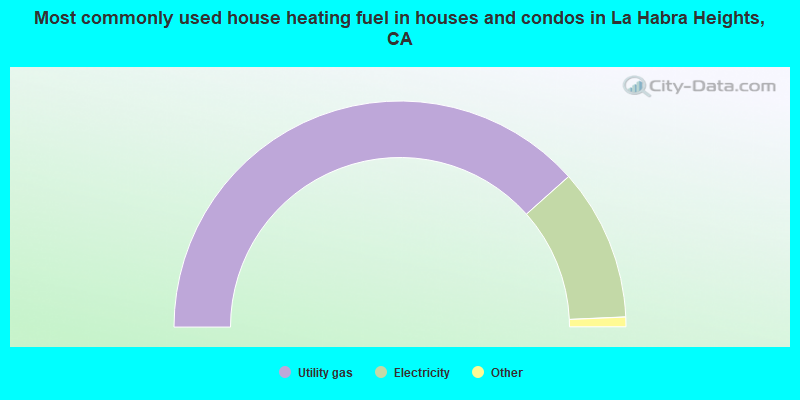
- 76.9%Utility gas
- 21.8%Electricity
- 0.9%Wood
- 0.4%Solar energy
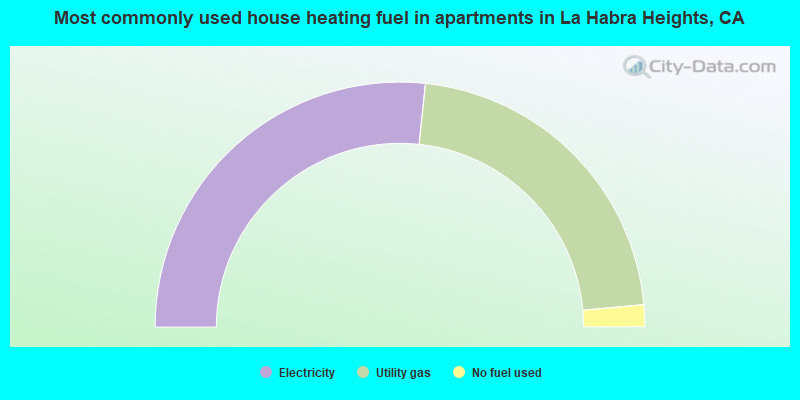
- 53.4%Electricity
- 43.8%Utility gas
- 2.9%No fuel used
Private vs. public school enrollment:
| Here: | 16.2% |
| California: | 10.5% |
| Here: | 30.4% |
| California: | 8.5% |
| Here: | 44.0% |
| California: | 15.9% |


