Jump to a detailed profile or search site with Google Custom Search

La Mesa, CA (California) Houses and Residents

Estimated median house or condo value in 2022: $798,737 (it was $192,800 in 2000)
La Mesa:

$798,737
California:

$715,900
Lower value quartile - upper value quartile: $610,210 - $1,008,523

Mean price in 2022:

Detached houses: $918,997
Here:

$918,997
State:

$988,808

Townhouses or other attached units: $640,791
Here:

$640,791
State:

$838,546

In 2-unit structures: $612,304
Here:

$612,304
State:

$1,138,100

In 3-to-4-unit structures: $551,852
Here:

$551,852
State:

$824,253

In 5-or-more-unit structures: $437,076
Here:

$437,076
State:

$730,996

Mobile homes: $159,566
Here:

$159,566
State:

$184,506

Occupied boats, RVs, vans, etc.: $22,881
Here:

$22,881
State:

$204,957

Total population: 59,177 (Urban population: 54,751, Rural population: 0)

Houses: 26,509 (25,165 occupied: 11,347 owner occupied, 13,977 renter occupied)

% of renters here:

55%
State:

44%

Housing density: 2,862 houses/condos per square mile

Median price asked for vacant for-sale houses and condos in 2022: $1,783,684.

Median contract rent in 2022: $1,751 (lower quartile is $1,412, upper quartile is over $2,000)


Median rent asked for vacant for-rent units in 2022: $1,831


Median gross rent in La Mesa, CA in 2022: $1,849

Housing units in La Mesa with a mortgage: 7,774 (732 second mortgage, 4 home equity loan, 553 both second mortgage and home equity loan)
Houses without a mortgage: 56

Median household income for houses/condos with a mortgage: $132,170

Median household income for apartments without a mortgage: $89,377

Median monthly housing costs: $1,898

Compare current foreclosures in La Mesa, CA:

Check out more offers in La Mesa, CA.
Powered by Foreclosure.com

Settings
X
Data:
Loading data...
Based on 2000-2022 data
Loading data...

123
Hide US histogram

La Mesa, California Age and Sex of Residents
Median year house/condo built: 1959

Median year apartment built: 1975

Household type by relationship:

Households: 60,638
  • Male householders: 11,533 (3,598 living alone), Female householders: 13,188 (4,584 living alone)
  • 9,813 spouses (9,607 opposite-sex spouses), 2,115 unmarried partners, (1,973 opposite-sex unmarried partners), 15,826 children (14,997 natural, 248 adopted, 580 stepchildren), 1,277 grandchildren, 974 brothers or sisters, 948 parents, 38 foster children, 671 other relatives, 3,297 non-relatives
  • In group quarters: 952

Size of family households: 6,304 2-persons, 3,785 3-persons, 2,680 4-persons, 1,115 5-persons, 350 6-persons, 125 7-or-more-persons.

Size of nonfamily households: 8,401 1-person, 2,049 2-persons, 363 3-persons, 227 4-persons, 15 5-persons, 3 7-or-more-persons.

7,873 married couples with children.
3,077 single-parent households (1,074 men, 2,003 women).

74.8% of residents of La Mesa speak English at home.
13.9% of residents speak Spanish at home (79% speak English very well, 11% speak English well, 8% speak English not well, 3% don't speak English at all).
4.0% of residents speak other Indo-European language at home (66% speak English very well, 28% speak English well, 4% speak English not well, 2% don't speak English at all).
5.0% of residents speak Asian or Pacific Island language at home (65% speak English very well, 20% speak English well, 14% speak English not well, 1% don't speak English at all).
2.3% of residents speak other language at home (79% speak English very well, 15% speak English well, 6% speak English not well).

Foreign born population: 8,407 (13.9%)
(70.4% of them are naturalized citizens)

Median number of rooms in houses and condos:
Here:

5.9
State:

6.0

Median number of rooms in apartments
Here:

3.6
State:

3.9

Owner-occupied Renter-occupied
Bedrooms in owner-occupied houses and condos in La Mesa, California
  • Bedrooms in owner-occupied houses and condos in La Mesa, California
  • 72no bedroom
  • 3411 bedroom
  • 2,2742 bedrooms
  • 5,8443 bedrooms
  • 2,2464 bedrooms
  • 5705+ bedrooms
Bedrooms in renter-occupied apartments in La Mesa, California
  • Bedrooms in renter-occupied apartments in La Mesa, California
  • 1,185no bedroom
  • 5,0991 bedroom
  • 5,3652 bedrooms
  • 2,0923 bedrooms
  • 1824 bedrooms
  • 545+ bedrooms
Owner-occupied Renter-occupied
Cars and other vehicles available in La Mesa in owner-occupied houses/condos
  • Cars and other vehicles available in La Mesa in owner-occupied houses/condos
  • 140no vehicle
  • 2,7891 vehicle
  • 4,9132 vehicles
  • 2,3233 vehicles
  • 8414 vehicles
  • 3425+ vehicles
Cars and other vehicles available in La Mesa in renter-occupied apartments
  • Cars and other vehicles available in La Mesa in renter-occupied apartments
  • 1,686no vehicle
  • 6,2481 vehicle
  • 4,7692 vehicles
  • 8463 vehicles
  • 2874 vehicles
  • 1425+ vehicles
Owner-occupied Renter-occupied
Rooms in owner-occupied houses in La Mesa, California
  • Rooms in owner-occupied houses in La Mesa, California
  • 591 room
  • 1212 rooms
  • 3493 rooms
  • 1,3234 rooms
  • 2,6445 rooms
  • 2,7626 rooms
  • 1,6717 rooms
  • 1,1018 rooms
  • 1,3179+ rooms
Rooms in renter-occupied apartments in La Mesa, California
  • Rooms in renter-occupied apartments in La Mesa, California
  • 9591 room
  • 1,3202 rooms
  • 4,3303 rooms
  • 3,7654 rooms
  • 2,1325 rooms
  • 1,0366 rooms
  • 2357 rooms
  • 818 rooms
  • 1199+ rooms
Year house built
Median 2022 house/condo value by year built
Median house/condo value by year householder moved into unit
Breakdown of mean house values by ages of householders
Owners and renters by unit type in La Mesa, CA
  • La Mesa, CA household income distribution

  • Distribution of median household income in La Mesa, CA in 2022
  • 1,300Less than $10,000
  • 1,283$10,000 to $19,999
  • 1,841$20,000 to $29,999
  • 1,375$30,000 to $39,999
  • 1,672$40,000 to $49,999
  • 2,028$50,000 to $59,999
  • 1,917$60,000 to $74,999
  • 2,937$75,000 to $99,999
  • 3,481$100,000 to $124,999
  • 1,616$125,000 to $149,999
  • 2,806$150,000 to $199,999
  • 2,987$200,000 or more
  • Home value of owner - occupied houses in 2022 in La Mesa, CA

  • Distribution of house value in La Mesa, CA in 2022
  • 102Less than $10,000
  • 35$10,000 to $14,999
  • 19$15,000 to $19,999
  • 12$20,000 to $24,999
  • 11$50,000 to $59,999
  • 52$60,000 to $69,999
  • 13$80,000 to $89,999
  • 2$90,000 to $99,999
  • 31$100,000 to $124,999
  • 25$150,000 to $174,999
  • 16$200,000 to $249,999
  • 51$250,000 to $299,999
  • 364$300,000 to $399,999
  • 659$400,000 to $499,999
  • 3,680$500,000 to $749,999
  • 4,042$750,000 to $999,999
  • 1,094$1,000,000 to $1,499,999
  • 115$1,500,000 to $1,999,999
  • 161$2,000,000 or more
  • Rent paid by renters in 2022 in La Mesa, CA

  • Distribution of rent paid by renters in La Mesa, CA in 2022
  • 19Less than $100
  • 17$100 to $149
  • 18$150 to $199
  • 226$200 to $249
  • 60$250 to $299
  • 104$300 to $349
  • 56$350 to $399
  • 30$400 to $449
  • 43$450 to $499
  • 12$500 to $549
  • 19$550 to $599
  • 9$600 to $649
  • 88$700 to $749
  • 31$750 to $799
  • 166$800 to $899
  • 435$900 to $999
  • 970$1,000 to $1,249
  • 1,705$1,250 to $1,499
  • 5,537$1,500 to $1,999
  • 2,430$2,000 to $2,499
  • 810$2,500 to $2,999
  • 409$3,000 to $3,499
  • 58$3,500 or more
  • 394No cash rent
Time Leaving Home To Go To Work in 2022

Percentage of workers working in this county: 99.3%
Number of people working at home: 5,156 (16.2% of all workers)

Travel time (in minutes) to work in 2022

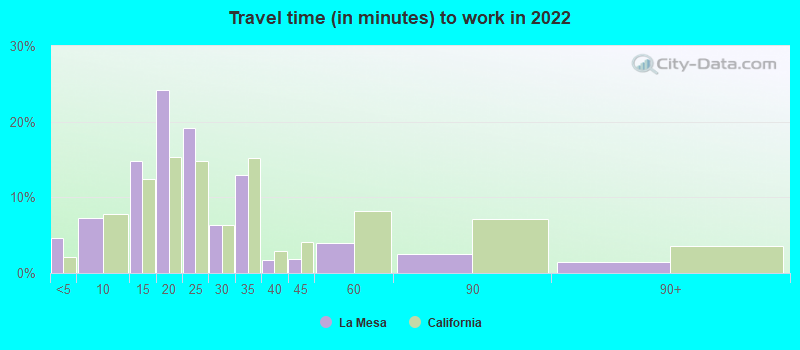
Travel time to work (commute)

  • Less than 5 minutes: 976
  • 5 to 9 minutes: 1,510
  • 10 to 14 minutes: 3,376
  • 15 to 19 minutes: 4,038
  • 20 to 24 minutes: 5,372
  • 25 to 29 minutes: 2,395
  • 30 to 34 minutes: 4,650
  • 35 to 39 minutes: 653
  • 40 to 44 minutes: 695
  • 45 to 59 minutes: 1,629
  • 60 to 89 minutes: 806
  • 90 or more minutes: 657
Means of transportation to work in 2022 - La Mesa

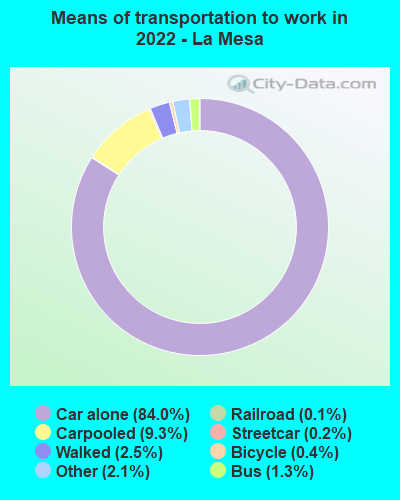
Means of transportation to work:

  • Drove a car alone: 19,883 (68.5%)
  • Carpooled: 2,308 (7.9%)
  • Bus: 273 (0.9%)
  • Subway or elevated rail: 44 (0.2%)
  • Long-distance train or commuter rail: 5 (0.0%)
  • Light rail, streetcar or trolley: 41 (0.1%)
  • Taxi: 507 (1.7%)
  • Bicycle: 101 (0.3%)
  • Walked: 658 (2.3%)
  • Worked at home: 5,156 (17.8%)
Class of Workers in 2022
  • Unemployment by race in 2022
  • Unemployment rate for White non-Hispanic residents
  • 5.5%Males
  • 4.3%Females
  • Unemployment rate for Black residents
  • 6.5%Males
  • 6.0%Females
  • Unemployment rate for Asian residents
  • 3.0%Males
  • 7.6%Females
  • Unemployment rate for other race residents
  • 6.7%Males
  • Unemployment rate for two or more race residents
  • 5.7%Males
  • 4.7%Females
  • Unemployment rate for Hispanic or Latino residents
  • 6.0%Males
  • 1.3%Females
Year of entry for the foreign-born population in La Mesa, California
  • Year of entry for the foreign-born population in La Mesa, California
  • 2,3882010 or later
  • 1,6352000 to 2009
  • 1,3381990 to 1999
  • 1,4481980 to 1989
  • 9461970 to 1979
  • 1,464Before 1970
Ancestries in La Mesa, CA

First ancestries reported:

  • German: 1,488 (5.6%)
  • English: 1,372 (5.1%)
  • American: 1,226 (4.6%)
  • Irish: 1,157 (4.3%)
  • European: 748 (2.8%)
  • Italian: 687 (2.6%)
  • Polish: 432 (1.6%)
  • Norwegian: 400 (1.5%)
  • Arab: 376 (1.4%)
  • Ethiopian: 318 (1.2%)
  • French: 291 (1.1%)
  • Ukrainian: 248 (0.9%)
  • Portuguese: 226 (0.8%)
  • Iraqi: 224 (0.8%)
  • African: 215 (0.8%)
  • Romanian: 215 (0.8%)
  • Dutch: 198 (0.7%)
  • Scottish: 160 (0.6%)
  • Canadian: 148 (0.6%)
  • Iranian: 146 (0.5%)
  • Russian: 138 (0.5%)
  • Greek: 123 (0.5%)
  • Swedish: 120 (0.4%)
  • French Canadian: 116 (0.4%)
  • Czech: 111 (0.4%)
  • Eastern European: 110 (0.4%)
  • Swiss: 107 (0.4%)
  • Scotch-Irish: 106 (0.4%)
  • Nigerian: 103 (0.4%)
  • Armenian: 92 (0.3%)
  • Scandinavian: 91 (0.3%)
  • Haitian: 85 (0.3%)
  • Lebanese: 84 (0.3%)
  • Somali: 76 (0.3%)
  • British: 70 (0.3%)
  • Egyptian: 62 (0.2%)
  • Northern European: 55 (0.2%)
  • Danish: 43 (0.2%)
  • Moroccan: 41 (0.2%)
  • Croatian: 37 (0.1%)
  • Hungarian: 33 (0.1%)
  • Palestinian: 32 (0.1%)
  • Ghanaian: 27 (0.1%)
  • Lithuanian: 22 (0.08%)
  • Assyrian: 20 (0.07%)
  • Welsh: 20 (0.07%)
  • Icelander: 19 (0.07%)
  • Serbian: 13 (0.05%)
  • Barbadian: 13 (0.05%)
  • Afghan: 11 (0.04%)
  • Finnish: 8 (0.03%)
  • Turkish: 7 (0.03%)
  • Czechoslovakian: 6 (0.02%)
  • Belizean: 3 (0.01%)

Most common places of birth for foreign-born residents (%):

Mexico
La Mesa:

27.8% (2,341)
California:

37.2% (3,881,193)

Vietnam
La Mesa:

9.9% (834)
California:

4.9% (512,335)

Philippines
La Mesa:

9.0% (755)
California:

7.8% (818,297)

Poland
La Mesa:

3.6% (303)
California:

0.2% (20,997)

Iraq
La Mesa:

3.5% (295)
California:

0.4% (40,941)

Canada
La Mesa:

3.3% (274)
California:

1.2% (127,477)

China, excluding Hong Kong and Taiwan
La Mesa:

3.0% (251)
California:

6.6% (684,672)

Russia
La Mesa:

2.5% (209)
California:

0.7% (71,932)

Germany
La Mesa:

2.3% (195)
California:

0.7% (73,304)

Syria
La Mesa:

1.6% (137)
California:

0.3% (30,949)

Japan
La Mesa:

1.6% (134)
California:

1.0% (103,575)

Iran
La Mesa:

1.6% (132)
California:

2.0% (206,004)

Place of birth for U.S.-born residents:

  • This state: 35,545
  • Other state: 15,345
  • Northeast: 3,439
  • Midwest: 4,852
  • South: 4,641
  • West: 2,402

85.6% of La Mesa residents lived in the same house 1 years ago.
   Out of people who lived in different houses, 45.5% lived in this county.
   Out of people who lived in different counties, 46.3% lived in California.


La Mesa:

85.6%
State average:

88.9%

Education attainment for males 25 years and older:

  • No schooling: 155
  • Nursery to 4th grade: 21
  • 5th and 6th grade: 78
  • 7th and 8th grade: 169
  • 9th grade: 26
  • 10th grade: 43
  • 11th grade: 56
  • 12th grade, no diploma: 550
  • High school graduate (or equivalency): 3,703
  • Less than 1 year of college: 1,719
  • Some college more than 1 year, no degree: 4,104
  • Associate degree: 1,780
  • Bachelor's degree: 4,997
  • Master's degree: 1,874
  • Professional school degree: 503
  • Doctorate degree: 556
Educational Attainment for Males

Education attainment for females 25 years and older:

  • No schooling: 209
  • Nursery to 4th grade: 87
  • 5th and 6th grade: 91
  • 7th and 8th grade: 141
  • 9th grade: 122
  • 10th grade: 94
  • 11th grade: 200
  • 12th grade, no diploma: 403
  • High school graduate (or equivalency): 3,522
  • Less than 1 year of college: 1,956
  • Some college more than 1 year, no degree: 3,989
  • Associate degree: 3,012
  • Bachelor's degree: 5,835
  • Master's degree: 2,437
  • Professional school degree: 551
  • Doctorate degree: 364
Educational Attainment for Females
La Mesa marital status for males
La Mesa marital status for females

Housing units in structures:

  • One, detached: 12,193
  • One, attached: 1,710
  • Two: 938
  • 3 or 4: 1,302
  • 5 to 9: 1,387
  • 10 to 19: 2,464
  • 20 to 49: 2,236
  • 50 or more: 3,886
  • Mobile homes: 258
  • Boats, RVs, vans, etc.: 130

Median worth of mobile homes: $123,821

Housing units lacking complete plumbing facilities in 2022: 0.4%

Housing units lacking complete kitchen facilities in 2022: 1.3%

House/condo owner moved in on average 12 years ago

Renter moved in on average 5 years ago

Year householders moved into residence in La Mesa
Houses and condos Apartments
Most commonly used house heating fuel in houses and condos in La Mesa, CA
  • 68.2%Utility gas
  • 24.7%Electricity
  • 4.7%Solar energy
  • 1.2%Bottled, tank, or LP gas
  • 0.6%No fuel used
  • 0.5%Wood
Most commonly used house heating fuel in apartments in La Mesa, CA
  • 56.3%Electricity
  • 31.4%Utility gas
  • 10.0%No fuel used
  • 0.8%Wood
  • 0.7%Bottled, tank, or LP gas
  • 0.5%Solar energy
  • 0.2%Other fuel

Private vs. public school enrollment:

Students in private schools in grades 1 to 8 (elementary and middle school): 804
Here:

15.0%
California:

10.5%

Students in private schools in grades 9 to 12 (high school): 233
Here:

9.4%
California:

8.5%

Students in private undergraduate colleges: 552
Here:

16.0%
California:

15.9%
School Enrollment by Level of School for Male Students
School Enrollment by Level of School for Female Students
Age and Sex of Sensory-Disabled Noninstitutionalized Residents
Age and Sex of Physically-Disabled Noninstitutionalized Residents
Age and Sex of Mentally-Disabled Noninstitutionalized Residents
Age and Sex of Self-Care Disabled Noninstitutionalized Residents
Age and Sex of Go-Outside-Home Disabled Noninstitutionalized Residents
Age and Sex of Noninstitutionalized Residents with Employment Disability