Housing density: 785 houses/condos per square mile
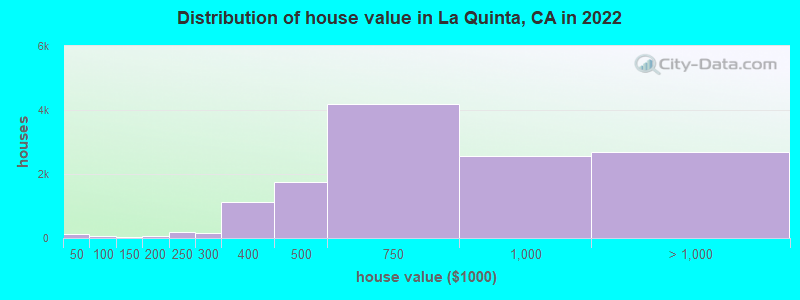
Median price asked for vacant for-sale houses and condos in 2022: $899,391.
Median contract rent in 2022: $1,688 (lower quartile is $1,007, upper quartile is over $2,000)
Median rent asked for vacant for-rent units in 2022: $4,171
Median gross rent in La Quinta, CA in 2022: $1,827
Housing units in La Quinta with a mortgage: 7,812 (523 second mortgage, 37 home equity loan, 465 both second mortgage and home equity loan) Houses without a mortgage: 139
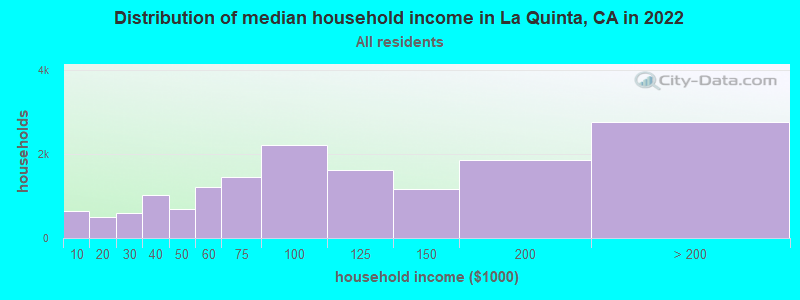
Median household income for houses/condos with a mortgage: $114,821
Median household income for apartments without a mortgage: $95,308
Size of family households: 6,310 2-persons, 1,866 3-persons, 1,460 4-persons, 898 5-persons, 122 6-persons, 128 7-or-more-persons.
Size of nonfamily households: 3,927 1-person, 920 2-persons, 41 3-persons.
3,577 married couples with children.
2,058 single-parent households (761 men, 1,297 women).
71.2% of residents of La Quinta speak English at home.
24.6% of residents speak Spanish at home (73% speak English very well, 17% speak English well, 9% speak English not well, 1% don't speak English at all).
2.3% of residents speak other Indo-European language at home (83% speak English very well, 13% speak English well, 4% speak English not well).
1.8% of residents speak Asian or Pacific Island language at home (65% speak English very well, 21% speak English well, 14% speak English not well).
0.4% of residents speak other language at home (88% speak English very well, 12% speak English well).
Foreign born population: 5,574 (14.4%)
(67.9% of them are naturalized citizens)
Percentage of workers working in this county: 93.3% Number of people working at home: 2,986 (18.7% of all workers)
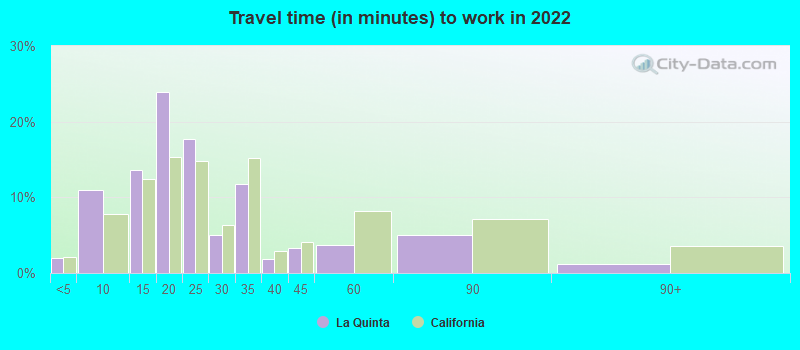
Travel time to work (commute)
Less than 5 minutes: 146
5 to 9 minutes: 1,539
10 to 14 minutes: 1,778
15 to 19 minutes: 2,063
20 to 24 minutes: 2,370
25 to 29 minutes: 1,157
30 to 34 minutes: 1,657
35 to 39 minutes: 421
40 to 44 minutes: 337
45 to 59 minutes: 526
60 to 89 minutes: 729
90 or more minutes: 519
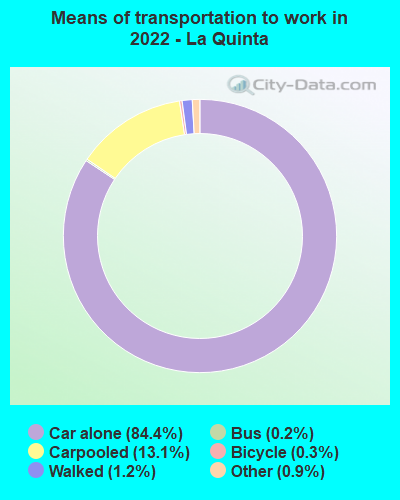
Means of transportation to work:
Drove a car alone: 10,071 (67.9%)
Carpooled: 1,694 (11.4%)
Bus: 23 (0.2%)
Taxi: 112 (0.8%)
Bicycle: 44 (0.3%)
Walked: 137 (0.9%)
Worked at home: 2,986 (20.1%)
Unemployment by race in 2022
Unemployment rate for White non-Hispanic residents
3.0%Males
9.4%Females
Unemployment rate for Black residents
20.2%Females
Unemployment rate for Asian residents
18.6%Males
10.3%Females
Unemployment rate for other race residents
10.0%Males
14.3%Females
Unemployment rate for two or more race residents
1.7%Males
0.1%Females
Unemployment rate for Hispanic or Latino residents
6.0%Males
8.3%Females
Year of entry for the foreign-born population in La Quinta, California
8482010 or later
1,1322000 to 2009
9601990 to 1999
1,0971980 to 1989
5631970 to 1979
759Before 1970
First ancestries reported:
English: 1,421 (6.6%)
German: 1,138 (5.3%)
American: 1,007 (4.7%)
Irish: 897 (4.2%)
Italian: 746 (3.5%)
Polish: 377 (1.7%)
Canadian: 360 (1.7%)
European: 252 (1.2%)
Scottish: 211 (1.0%)
Eastern European: 207 (1.0%)
Scotch-Irish: 193 (0.9%)
Norwegian: 173 (0.8%)
Armenian: 152 (0.7%)
British: 145 (0.7%)
Austrian: 133 (0.6%)
Dutch: 117 (0.5%)
Czech: 116 (0.5%)
Scandinavian: 96 (0.4%)
Russian: 86 (0.4%)
French Canadian: 86 (0.4%)
French: 82 (0.4%)
Hungarian: 75 (0.3%)
Egyptian: 70 (0.3%)
Swedish: 70 (0.3%)
Greek: 61 (0.3%)
Slovak: 59 (0.3%)
African: 42 (0.2%)
Northern European: 41 (0.2%)
Portuguese: 41 (0.2%)
Palestinian: 40 (0.2%)
Swiss: 35 (0.2%)
Ukrainian: 29 (0.1%)
Estonian: 25 (0.1%)
Danish: 25 (0.1%)
Iranian: 25 (0.1%)
Finnish: 21 (0.10%)
Slavic: 18 (0.08%)
Welsh: 18 (0.08%)
Albanian: 17 (0.08%)
Czechoslovakian: 17 (0.08%)
Croatian: 10 (0.05%)
Lebanese: 9 (0.04%)
Basque: 8 (0.04%)
Yugoslavian: 6 (0.03%)
Ghanaian: 2 (0.01%)
Most common places of birth for foreign-born residents (%):
Mexico
La Quinta:
46.4% (2,589)
California:
37.2% (3,881,193)
Canada
La Quinta:
14.0% (781)
California:
1.2% (127,477)
Taiwan
La Quinta:
3.3% (186)
California:
1.7% (176,274)
China, excluding Hong Kong and Taiwan
La Quinta:
3.3% (183)
California:
6.6% (684,672)
Vietnam
La Quinta:
3.0% (165)
California:
4.9% (512,335)
Philippines
La Quinta:
2.4% (131)
California:
7.8% (818,297)
Argentina
La Quinta:
2.2% (120)
California:
0.3% (33,960)
Guatemala
La Quinta:
2.1% (115)
California:
2.8% (290,436)
England
La Quinta:
1.8% (99)
California:
0.6% (57,953)
Place of birth for U.S.-born residents:
This state: 21,867
Other state: 10,324
Northeast: 2,373
Midwest: 4,155
South: 1,871
West: 1,950
90.7% of La Quinta residents lived in the same house 1 years ago. Out of people who lived in different houses, 28.9% lived in this county. Out of people who lived in different counties, 68.5% lived in California.
La Quinta:
90.7%
State average:
88.9%
Education attainment for males 25 years and older:
No schooling: 146
Nursery to 4th grade: 8
5th and 6th grade: 59
7th and 8th grade: 36
9th grade: 138
10th grade: 28
11th grade: 103
12th grade, no diploma: 438
High school graduate (or equivalency): 3,260
Less than 1 year of college: 924
Some college more than 1 year, no degree: 1,954
Associate degree: 1,124
Bachelor's degree: 3,599
Master's degree: 1,446
Professional school degree: 699
Doctorate degree: 332
Education attainment for females 25 years and older:
No schooling: 248
Nursery to 4th grade: 78
5th and 6th grade: 208
7th and 8th grade: 66
9th grade: 131
10th grade: 0
11th grade: 45
12th grade, no diploma: 411
High school graduate (or equivalency): 3,064
Less than 1 year of college: 1,462
Some college more than 1 year, no degree: 2,070
Associate degree: 1,685
Bachelor's degree: 3,637
Master's degree: 1,399
Professional school degree: 391
Doctorate degree: 86
Housing units in structures:
One, detached: 19,237
One, attached: 2,113
Two: 395
3 or 4: 854
5 to 9: 1,157
10 to 19: 399
20 to 49: 78
50 or more: 287
Mobile homes: 409
Boats, RVs, vans, etc.: 8
Median worth of mobile homes: $24,425
Housing units lacking complete plumbing facilities in 2022: 1.1%
Housing units lacking complete kitchen facilities in 2022: 2.4%