La Sara, TX (Texas) Houses and Residents
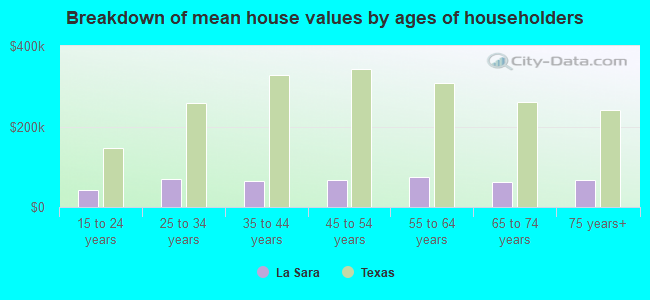
| La Sara: | $67,245 |
| Texas: | $275,400 |
Total population: 7,190 (Urban population: 4,845 (all inside urban clusters), Rural population: 2,207 (86 farm, 2,121 nonfarm))
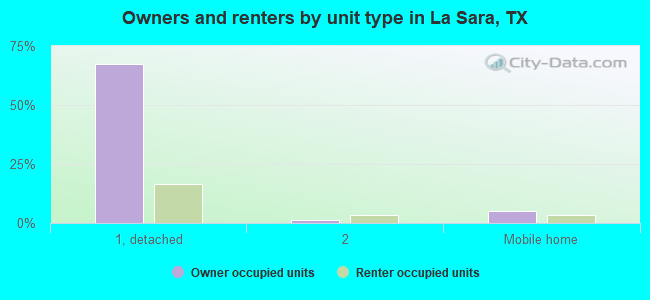
Houses: 2,237 (1,972 occupied: 1,478 owner occupied, 494 renter occupied)
| % of renters here: | 25% |
| State: | 38% |
Housing density: 16 houses/condos per square mile
Median price asked for vacant for-sale houses and condos in 2022 in this county: $48,560.
Median contract rent in 2022: $467 (lower quartile is $341, upper quartile is $735)
Median rent asked for vacant for-rent units in 2022: $580
Median gross rent in La Sara, TX in 2022: $676
Housing units in La Sara with a mortgage: 404 (0 second mortgage, 2 home equity loan, 0 both second mortgage and home equity loan)
Houses without a mortgage: 829


Household type by relationship:
Households: 18,880- In family households: 17,581 (2,944 male householders, 1,663 female householders)
3,144 spouses, 6,823 children (6,418 natural, 115 adopted, 290 stepchildren), 1,391 grandchildren, 266 brothers or sisters, 211 parents, foster children, 435 other relatives, 380 non-relatives
- In nonfamily households: 1,299 (521 male householders (455 living alone)), 636 female householders (580 living alone)), 142 nonrelatives
- In group quarters: 3,254 (all institutionalized)
4,153 married couples with children.
1,065 single-parent households (182 men, 883 women).
15.5% of residents of La Sara speak English at home.
84.4% of residents speak Spanish at home (55% speak English very well, 28% speak English well, 12% speak English not well, 6% don't speak English at all).
0.1% of residents speak other Indo-European language at home (100% speak English well).
Foreign born population: 2,004 (19.9%)
(57.3% of them are naturalized citizens)
| Here: | 5.0 |
| State: | 6.3 |
| Here: | 5.1 |
| State: | 4.0 |
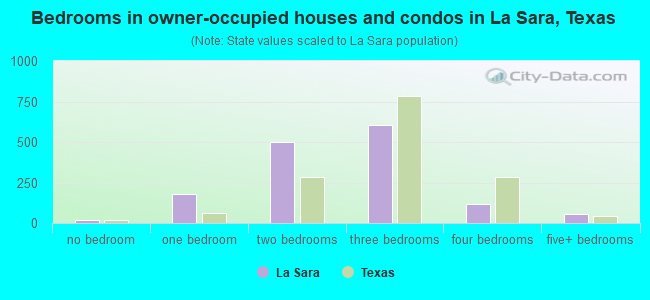
- Bedrooms in owner-occupied houses and condos in La Sara, Texas
- 19no bedroom
- 1771 bedroom
- 5012 bedrooms
- 6083 bedrooms
- 1184 bedrooms
- 555+ bedrooms
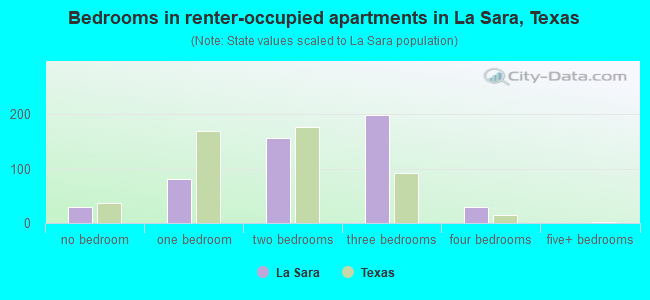
- Bedrooms in renter-occupied apartments in La Sara, Texas
- 29no bedroom
- 811 bedroom
- 1562 bedrooms
- 1993 bedrooms
- 294 bedrooms
- 05+ bedrooms
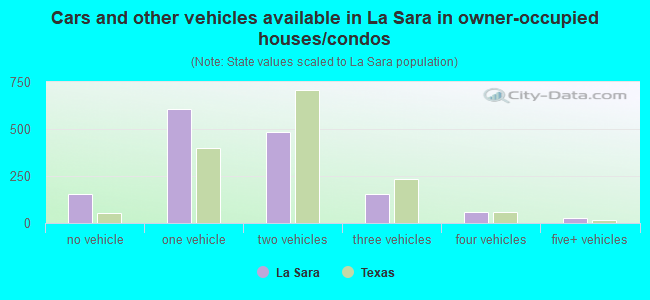
- Cars and other vehicles available in La Sara in owner-occupied houses/condos
- 152no vehicle
- 6071 vehicle
- 4852 vehicles
- 1543 vehicles
- 564 vehicles
- 245+ vehicles
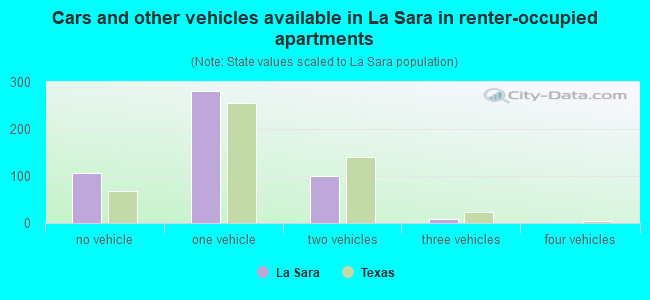
- Cars and other vehicles available in La Sara in renter-occupied apartments
- 106no vehicle
- 2801 vehicle
- 992 vehicles
- 93 vehicles
- 04 vehicles
- 05+ vehicles
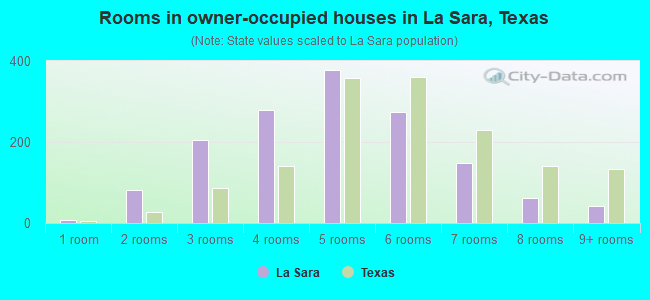
- Rooms in owner-occupied houses in La Sara, Texas
- 71 room
- 812 rooms
- 2063 rooms
- 2794 rooms
- 3775 rooms
- 2756 rooms
- 1497 rooms
- 628 rooms
- 429+ rooms
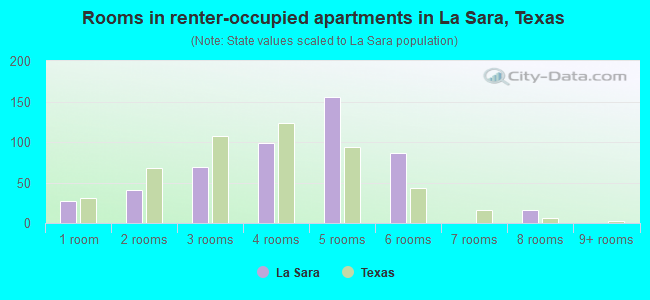
- Rooms in renter-occupied apartments in La Sara, Texas
- 271 room
- 412 rooms
- 693 rooms
- 994 rooms
- 1555 rooms
- 876 rooms
- 07 rooms
- 168 rooms
- 09+ rooms
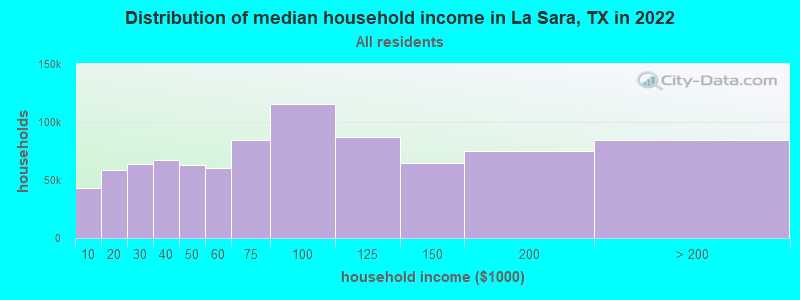
La Sara, TX household income distribution

- 185,758Less than $10,000
- 223,703$10,000 to $19,999
- 241,686$20,000 to $29,999
- 261,119$30,000 to $39,999
- 244,157$40,000 to $49,999
- 241,567$50,000 to $59,999
- 330,528$60,000 to $74,999
- 425,954$75,000 to $99,999
- 315,929$100,000 to $124,999
- 221,067$125,000 to $149,999
- 289,852$150,000 to $199,999
- 358,910$200,000 or more
Percentage of workers working in this county: 67.3%
Number of people working at home: 457 (14.0% of all workers)
Travel time to work (commute)
- Less than 5 minutes: 151
- 5 to 9 minutes: 366
- 10 to 14 minutes: 479
- 15 to 19 minutes: 252
- 20 to 24 minutes: 101
- 25 to 29 minutes: 65
- 30 to 34 minutes: 361
- 35 to 39 minutes: 22
- 40 to 44 minutes: 46
- 45 to 59 minutes: 137
- 60 to 89 minutes: 60
- 90 or more minutes: 43
Means of transportation to work:
- Drove a car alone: 1,573 (74.3%)
- Carpooled: 355 (16.8%)
- Bus or trolley bus: 18 (0.9%)
- Bicycle: 9 (0.4%)
- Walked: 91 (4.3%)
- Other means: 37 (1.7%)
- Worked at home: 34 (1.6%)
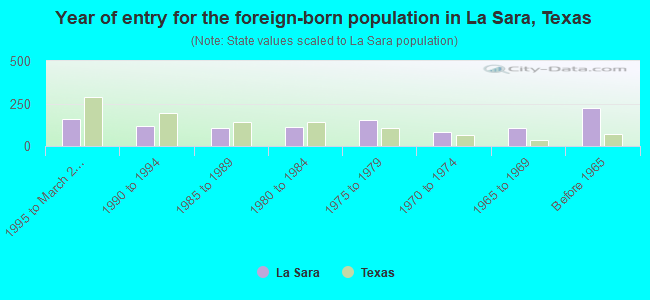
- Year of entry for the foreign-born population in La Sara, Texas
- 1561995 to March 2000
- 1171990 to 1994
- 1031985 to 1989
- 1101980 to 1984
- 1521975 to 1979
- 831970 to 1974
- 1051965 to 1969
- 224Before 1965
Most common places of birth for foreign-born residents (%):
| La Sara: | 96.8% (1,016) |
| Texas: | 64.8% (1,879,369) |
Place of birth for U.S.-born residents:
- This state: 5,542
- Other state: 402
- Northeast: 6
- Midwest: 123
- South: 154
- West: 119
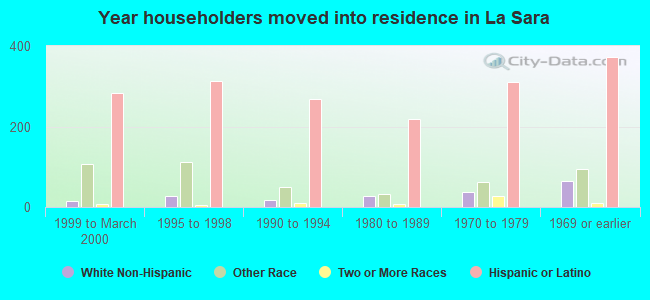
70% of La Sara residents lived in the same house 5 years ago.
Out of people who lived in different houses, 71% lived in this county.
Out of people who lived in different counties, 62% lived in Texas.
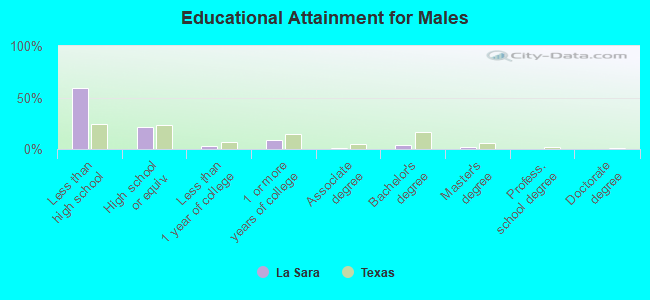
Education attainment for males 25 years and older:
- No schooling: 205
- Nursery to 4th grade: 148
- 5th and 6th grade: 245
- 7th and 8th grade: 170
- 9th grade: 85
- 10th grade: 89
- 11th grade: 84
- 12th grade, no diploma: 53
- High school graduate (or equivalency): 385
- Less than 1 year of college: 51
- Some college more than 1 year, no degree: 151
- Associate degree: 26
- Bachelor's degree: 72
- Master's degree: 39
- Professional school degree: 3
- Doctorate degree: 2
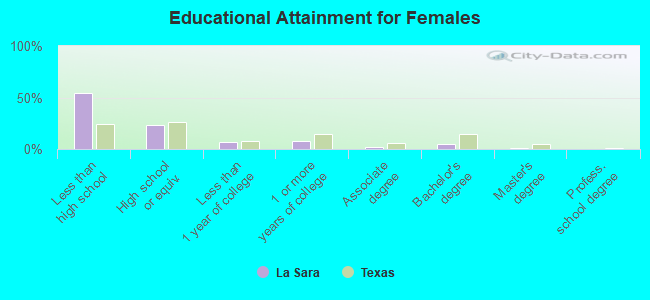
Education attainment for females 25 years and older:
- No schooling: 299
- Nursery to 4th grade: 175
- 5th and 6th grade: 224
- 7th and 8th grade: 128
- 9th grade: 92
- 10th grade: 67
- 11th grade: 48
- 12th grade, no diploma: 56
- High school graduate (or equivalency): 462
- Less than 1 year of college: 135
- Some college more than 1 year, no degree: 146
- Associate degree: 45
- Bachelor's degree: 87
- Master's degree: 23
- Professional school degree: 2
- Doctorate degree: 0
Housing units in structures:
- One, detached: 1,842
- One, attached: 23
- Two: 103
- 3 or 4: 31
- 5 to 9: 18
- 20 to 49: 2
- Mobile homes: 212
- Boats, RVs, vans, etc.: 6
Median worth of mobile homes: $36,284
Housing units lacking complete kitchen facilities: 5.8%
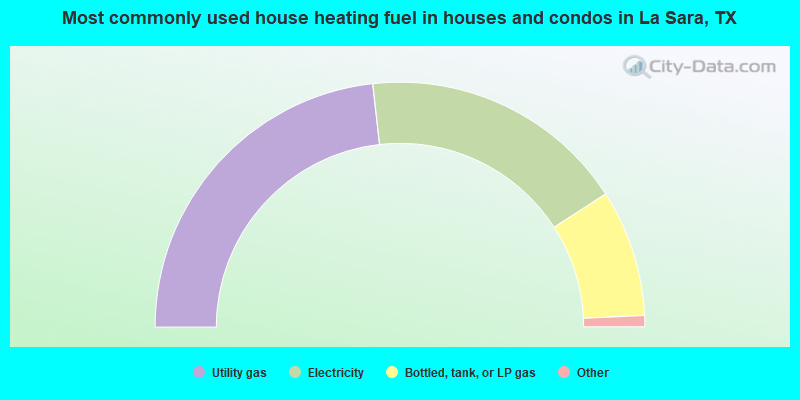
- 46.5%Utility gas
- 35.3%Electricity
- 16.8%Bottled, tank, or LP gas
- 0.9%Other fuel
- 0.3%No fuel used
- 0.1%Fuel oil, kerosene, etc.
- 0.1%Wood
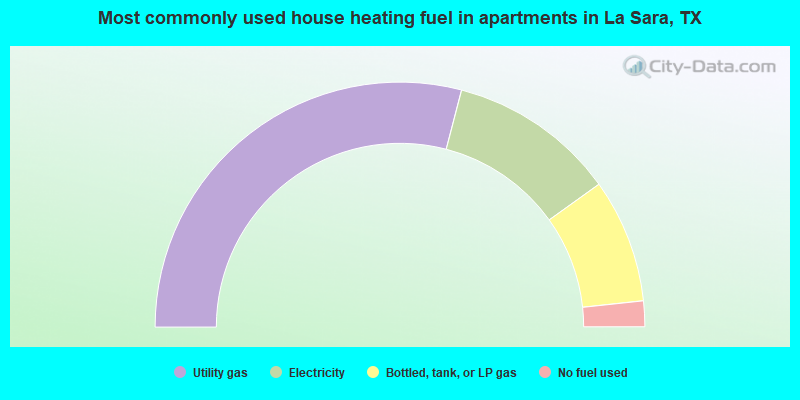
- 58.1%Utility gas
- 22.1%Electricity
- 16.4%Bottled, tank, or LP gas
- 3.4%No fuel used
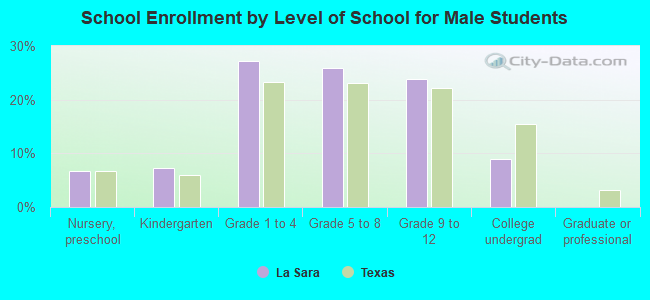
Private vs. public school enrollment:
| Here: | 0.4% |
| Texas: | 6.8% |
| Here: | 0.0% |
| Texas: | 6.2% |
| Here: | 6.0% |
| Texas: | 15.4% |