Lacey, WA (Washington) Houses and Residents
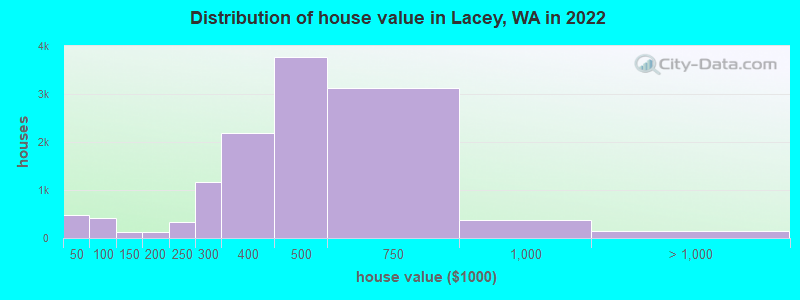
Estimated median house or condo value in 2022: $448,976 (it was $127,700 in 2000 )
Lacey:
$448,976Washington:
$569,500
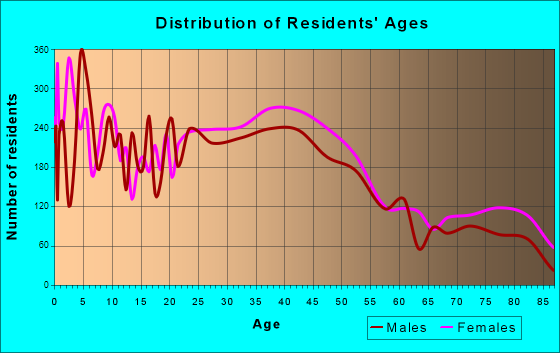
Lower value quartile - upper value quartile: $362,655 - $563,841Total population: 45,446 (Urban population: 30,758, Rural population: 349 (all nonfarm) )
Houses: 23,908 (22,891 occupied: 13,201 owner occupied, 9,608 renter occupied )
% of renters here:
42%State:
36%
Housing density: 1,499 houses/condos per square mile
Median price asked for vacant for-sale houses and condos in 2022: $802,999.
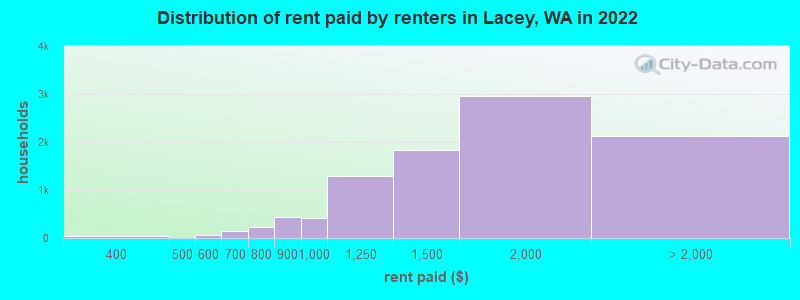
Median contract rent in 2022: $1,566 (lower quartile is $1,193, upper quartile is over $2,000)
Median rent asked for vacant for-rent units in 2022: $1,448
Median gross rent in Lacey, WA in 2022: $1,733
Housing units in Lacey with a mortgage: 8,815 (850 second mortgage, 9 home equity loan, 628 both second mortgage and home equity loan )Houses without a mortgage: 18
Median household income for houses/condos with a mortgage: $102,605
Median household income for apartments without a mortgage: $81,191
Median monthly housing costs: $1,665
Data:
Median house or condo value ($)
Median house or condo value ($ change since 2000)
Median house or condo value ($) - White
Median house or condo value ($) - Black or African American
Median house or condo value ($) - Asian
Median house or condo value ($) - Hispanic or Latino
Median house or condo value ($) - American Indian and Alaska Native
Median house or condo value ($) - Multirace
Median house or condo value ($) - Other Race
Median price asked for mobile homes ($)
Household density (households per square mile)
Mean house or condo value by units in structure - 1, detached ($)
Mean house or condo value by units in structure - 1, attached ($)
Mean house or condo value by units in structure - 2 ($)
Mean house or condo value by units in structure by units in structure - 3 or 4 ($)
Mean house or condo value by units in structure - 5 or more ($)
Mean house or condo value by units in structure - Boat, RV, van, etc. ($)
Mean house or condo value by units in structure - Mobile home ($)
Median contract rent ($)
Median contract rent - Lower quartile ($)
Median contract rent - Upper quartile ($)
Median gross rent ($)
Urban houses (%)
Rural houses (%)
Houses occupied (%)
Houses occupied (% change since 2000)
Houses owner occupied (%)
Houses owner occupied (% change since 2000)
Houses renter occupied (%)
Houses renter occupied (% change since 2000)
Vacant housing units - For rent (%)
Vacant housing units - For rent (% change since 2000)
Vacant housing units - For sale only (%)
Vacant housing units - For sale only (% change since 2000)
Vacant housing units - Rented or sold, not occupied (%)
Vacant housing units - Rented or sold, not occupied (% change since 2000)
Vacant housing units - For seasonal, recreational, or occasional use (%)
Vacant housing units - For seasonal, recreational, or occasional use (% change since 2000)
Vacant housing units - For migrant workers (%)
Vacant housing units - For migrant workers (% change since 2000)
Vacant housing units - Other vacant (%)
Vacant housing units - Other vacant (% change since 2000)
Median monthly housing costs ($)
Median household income for houses/condos with a mortgage ($)
Median household income for houses/condos without a mortgage ($)
Median household income ($)
Median household income ($) - White
Median household income ($) - Black or African American
Median household income ($) - Asian
Median household income ($) - Hispanic or Latino
Median household income ($) - American Indian and Alaska Native
Median household income ($) - Multirace
Median household income ($) - Other Race
Mortgage status - with mortgage (%)
Mortgage status - with second mortgage (%)
Mortgage status - with home equity loan (%)
Mortgage status - with both second mortgage and home equity loan (%)
Mortgage status - without a mortgage (%)
Median year house/condo built
Median year apartment built
Household type by relationship - Male householder living alone (%)
Household type by relationship - Male householder not living alone (%)
Household type by relationship - Female householder living alone (%)
Household type by relationship - Female householder not living alone (%)
Household type by relationship - Opposite-Sex spouse (%)
Household type by relationship - Same-Sex spouse (%)
Household type by relationship - Opposite-Sex unmarried partner (%)
Household type by relationship - Same-Sex unmarried partner (%)
Household type by relationship - In group quarters (%)
Size of family households - 2-person household (%)
Size of family households - 3-person household (%)
Size of family households - 4-person household (%)
Size of family households - 5-person household (%)
Size of family households - 6-person household (%)
Size of family households - 7-or-more-person household (%)
Size of nonfamily households - 1-person household (%)
Size of nonfamily households - 2-person household (%)
Size of nonfamily households - 3-person household (%)
Size of nonfamily households - 4-person household (%)
Size of nonfamily households - 5-person household (%)
Size of nonfamily households - 6-person household (%)
Size of nonfamily households - 7-or-moreperson household (%)
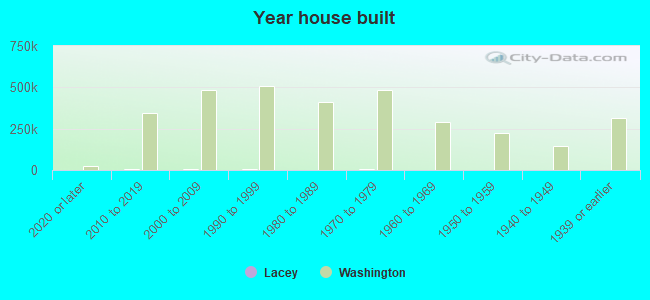
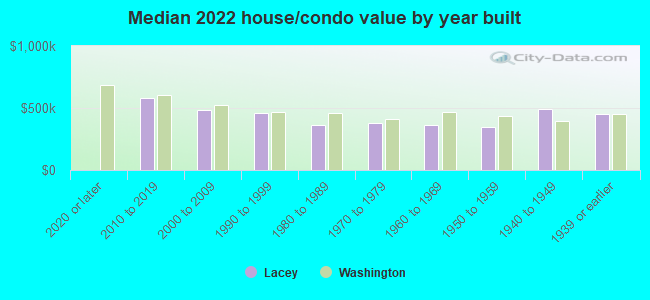
Year house built - Built 2010 or later (%)
Year house built - Built 2000 to 2009 (%)
Year house built - Built 1990 to 1999 (%)
Year house built - Built 1980 to 1989 (%)
Year house built - Built 1970 to 1979 (%)
Year house built - Built 1960 to 1969 (%)
Year house built - Built 1950 to 1959 (%)
Year house built - Built 1940 to 1949 (%)
Year house built - Built 1939 or earlier (%)
Median number of rooms in houses and condos
Median number of rooms in apartments
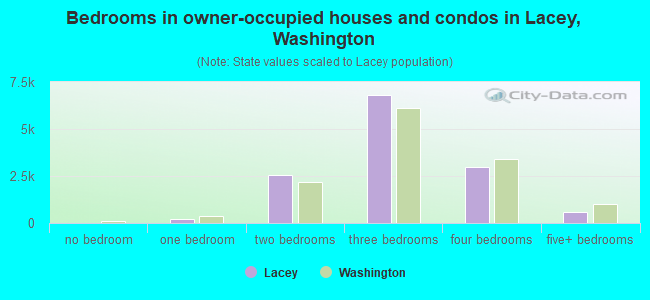
Median number of bedrooms in owner occupied houses
Mean number of bedrooms in owner occupied houses
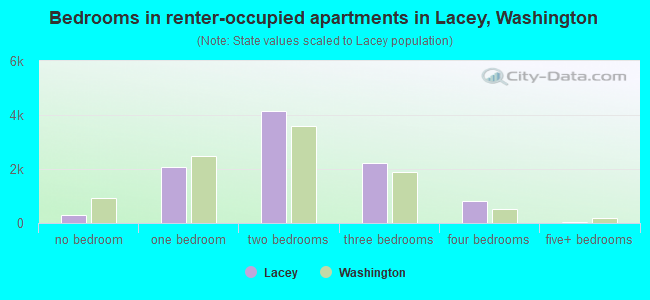
Median number of bedrooms in renter occupied houses
Mean number of bedrooms in renter occupied houses
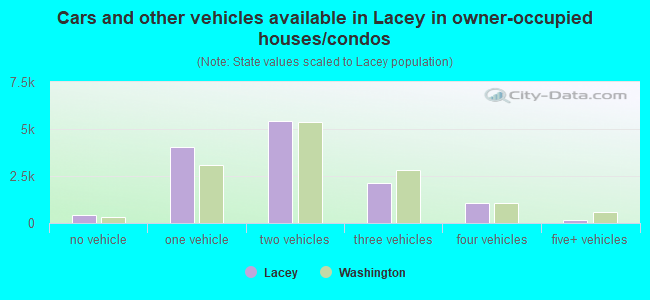
Median number of vehichles in owner occupied houses
Mean number of vehichles in owner occupied houses
Median number of vehichles in renter occupied houses
Mean number of vehichles in renter occupied houses
Rooms in owner-occupied houses - 1 room (%)
Rooms in owner-occupied houses - 2 rooms (%)
Rooms in owner-occupied houses - 3 rooms (%)
Rooms in owner-occupied houses - 4 rooms (%)
Rooms in owner-occupied houses - 5 rooms (%)
Rooms in owner-occupied houses - 6 rooms (%)
Rooms in owner-occupied houses - 7 rooms (%)
Rooms in owner-occupied houses - 8 rooms (%)
Rooms in owner-occupied houses - 9+ rooms (%)
Rooms in renter-occupied houses - 1 room (%)
Rooms in renter-occupied houses - 2 rooms (%)
Rooms in renter-occupied houses - 3 rooms (%)
Rooms in renter-occupied houses - 4 rooms (%)
Rooms in renter-occupied houses - 5 rooms (%)
Rooms in renter-occupied houses - 6 rooms (%)
Rooms in renter-occupied houses - 7 rooms (%)
Rooms in renter-occupied houses - 8 rooms (%)
Rooms in renter-occupied houses - 9+ rooms (%)
Bedrooms in owner-occupied houses - no bedrooms (%)
Bedrooms in owner-occupied houses - 1 bedroom (%)
Bedrooms in owner-occupied houses - 2 bedrooms (%)
Bedrooms in owner-occupied houses - 3 bedrooms (%)
Bedrooms in owner-occupied houses - 4 bedrooms (%)
Bedrooms in owner-occupied houses - 5+ bedrooms (%)
Bedrooms in renter-occupied houses - no bedrooms (%)
Bedrooms in renter-occupied houses - 1 bedroom (%)
Bedrooms in renter-occupied houses - 2 bedrooms (%)
Bedrooms in renter-occupied houses - 3 bedrooms (%)
Bedrooms in renter-occupied houses - 4 bedrooms (%)
Bedrooms in renter-occupied houses - 5+ bedrooms (%)
Vehicles available in owner-occupied houses - no vehicle available (%)
Vehicles available in owner-occupied houses - 1 vehicle available(%)
Vehicles available in owner-occupied houses - 2 Vehicles available (%)
Vehicles available in owner-occupied houses - 3 Vehicles available (%)
Vehicles available in owner-occupied houses - 4 Vehicles available (%)
Vehicles available in owner-occupied houses - 5+ Vehicles available (%)
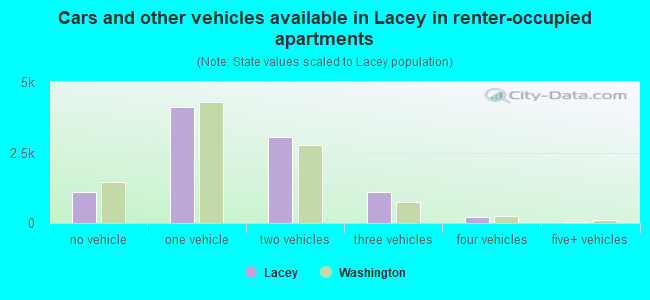
Vehicles available in renter-occupied houses - no vehicle available (%)
Vehicles available in renter-occupied houses - 1 vehicle available (%)
Vehicles available in renter-occupied houses - 2 Vehicles available (%)
Vehicles available in renter-occupied houses - 3 Vehicles available (%)
Vehicles available in renter-occupied houses - 4 Vehicles available (%)
Vehicles available in renter-occupied houses - 5+ Vehicles available (%)
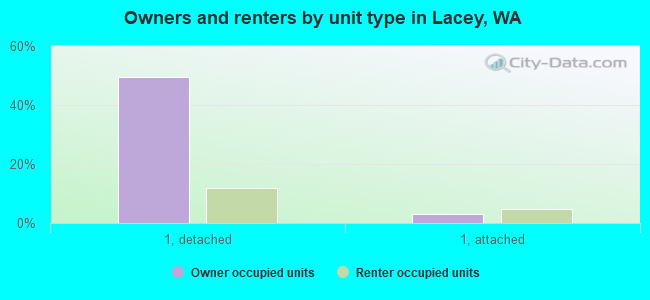
Housing units in structures - 1, detached (%)
Housing units in structures - 1, attached (%)
Housing units in structures - 2 (%)
Housing units in structures - 3 or 4 (%)
Housing units in structures - 5 to 9 (%)
Housing units in structures - 10 to 19 (%)
Housing units in structures - 20 to 49 (%)
Housing units in structures - 50 or more (%)
Housing units in structures - Mobile home (%)
Housing units in structures - Boat, RV, van, etc. (%)
Housing units in structures - Owners - 1, detached (%)
Housing units in structures - Owners - 1, attached (%)
Housing units in structures - Owners - 2 (%)
Housing units in structures - Owners - 3 or 4 (%)
Housing units in structures - Owners - 5 to 9 (%)
Housing units in structures - Owners - 10 to 19 (%)
Housing units in structures - Owners - 20 to 49 (%)
Housing units in structures - Owners - 50 or more (%)
Housing units in structures - Owners - Mobile home (%)
Housing units in structures - Owners - Boat, RV, van, etc. (%)
Housing units in structures - Renters - 1, detached (%)
Housing units in structures - Renters - 1, attached (%)
Housing units in structures - Renters - 2 (%)
Housing units in structures - Renters - 3 or 4 (%)
Housing units in structures - Renters - 5 to 9 (%)
Housing units in structures - Renters - 10 to 19 (%)
Housing units in structures - Renters - 20 to 49 (%)
Housing units in structures - Renters - 50 or more (%)
Housing units in structures - Renters - Mobile home (%)
Housing units in structures - Renters - Boat, RV, van, etc. (%)
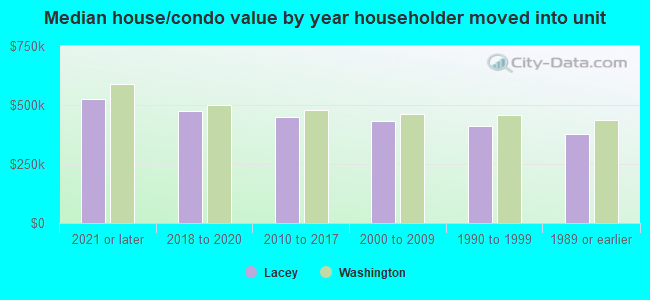
House/condo owner moved in on average (years ago)
Renter moved in on average (years ago)
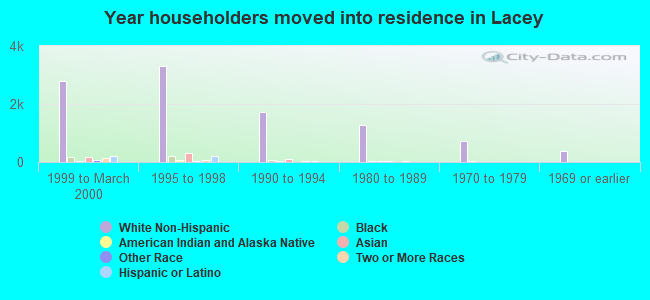
Year householder moved into unit - Moved in 1999 to March 2000 (%)
Year householder moved into unit - Moved in 1999 to March 2000 (%) - White
Year householder moved into unit - Moved in 1999 to March 2000 (%) - Black or African American
Year householder moved into unit - Moved in 1999 to March 2000 (%) - Asian
Year householder moved into unit - Moved in 1999 to March 2000 (%) - Hispanic or Latino
Year householder moved into unit - Moved in 1999 to March 2000 (%) - American Indian and Alaska Native
Year householder moved into unit - Moved in 1999 to March 2000 (%) - Multirace
Year householder moved into unit - Moved in 1999 to March 2000 (%) - Other Race
Year householder moved into unit - Moved in 1995 to 1998 (%)
Year householder moved into unit - Moved in 1995 to 1998 (%) - White
Year householder moved into unit - Moved in 1995 to 1998 (%) - Black or African American
Year householder moved into unit - Moved in 1995 to 1998 (%) - Asian
Year householder moved into unit - Moved in 1995 to 1998 (%) - Hispanic or Latino
Year householder moved into unit - Moved in 1995 to 1998 (%) - American Indian and Alaska Native
Year householder moved into unit - Moved in 1995 to 1998 (%) - Multirace
Year householder moved into unit - Moved in 1995 to 1998 (%) - Other Race
Year householder moved into unit - Moved in 1990 to 1994 (%)
Year householder moved into unit - Moved in 1990 to 1994 (%) - White
Year householder moved into unit - Moved in 1990 to 1994 (%) - Black or African American
Year householder moved into unit - Moved in 1990 to 1994 (%) - Asian
Year householder moved into unit - Moved in 1990 to 1994 (%) - Hispanic or Latino
Year householder moved into unit - Moved in 1990 to 1994 (%) - American Indian and Alaska Native
Year householder moved into unit - Moved in 1990 to 1994 (%) - Multirace
Year householder moved into unit - Moved in 1990 to 1994 (%) - Other Race
Year householder moved into unit - Moved in 1980 to 1989 (%)
Year householder moved into unit - Moved in 1980 to 1989 (%) - White
Year householder moved into unit - Moved in 1980 to 1989 (%) - Black or African American
Year householder moved into unit - Moved in 1980 to 1989 (%) - Asian
Year householder moved into unit - Moved in 1980 to 1989 (%) - Hispanic or Latino
Year householder moved into unit - Moved in 1980 to 1989 (%) - American Indian and Alaska Native
Year householder moved into unit - Moved in 1980 to 1989 (%) - Multirace
Year householder moved into unit - Moved in 1980 to 1989 (%) - Other Race
Year householder moved into unit - Moved in 1970 to 1979 (%)
Year householder moved into unit - Moved in 1970 to 1979 (%) - White
Year householder moved into unit - Moved in 1970 to 1979 (%) - Black or African American
Year householder moved into unit - Moved in 1970 to 1979 (%) - Asian
Year householder moved into unit - Moved in 1970 to 1979 (%) - Hispanic or Latino
Year householder moved into unit - Moved in 1970 to 1979 (%) - American Indian and Alaska Native
Year householder moved into unit - Moved in 1970 to 1979 (%) - Multirace
Year householder moved into unit - Moved in 1970 to 1979 (%) - Other Race
Year householder moved into unit - Moved in 1969 or earlier (%)
Year householder moved into unit - Moved in 1969 or earlier (%) - White
Year householder moved into unit - Moved in 1969 or earlier (%) - Black or African American
Year householder moved into unit - Moved in 1969 or earlier (%) - Asian
Year householder moved into unit - Moved in 1969 or earlier (%) - Hispanic or Latino
Year householder moved into unit - Moved in 1969 or earlier (%) - American Indian and Alaska Native
Year householder moved into unit - Moved in 1969 or earlier (%) - Multirace
Year householder moved into unit - Moved in 1969 or earlier (%) - Other Race
Housing units lacking complete plumbing facilities (%)
Housing units lacking complete kitchen facilities (%)
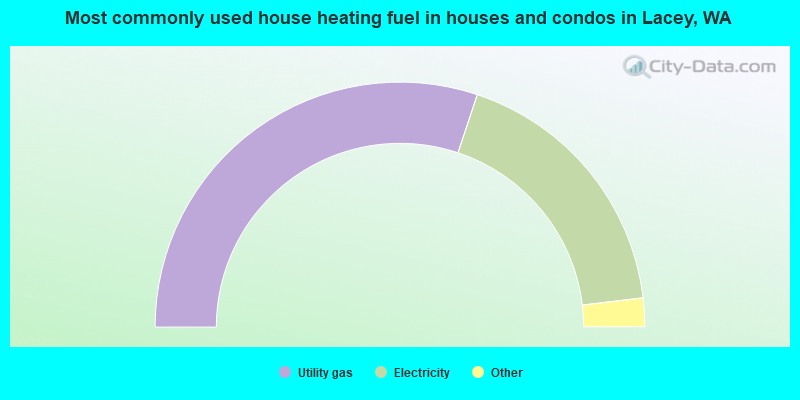
House heating fuel used in houses and condos - Utility gas (%)
House heating fuel used in houses and condos - Bottled, tank, or LP gas (%)
House heating fuel used in houses and condos - Electricity (%)
House heating fuel used in houses and condos - Fuel oil, kerosene, etc. (%)
House heating fuel used in houses and condos - Coal or coke (%)
House heating fuel used in houses and condos - Wood (%)
House heating fuel used in houses and condos - Solar energy (%)
House heating fuel used in houses and condos - Other fuel (%)
House heating fuel used in houses and condos - No fuel used (%)
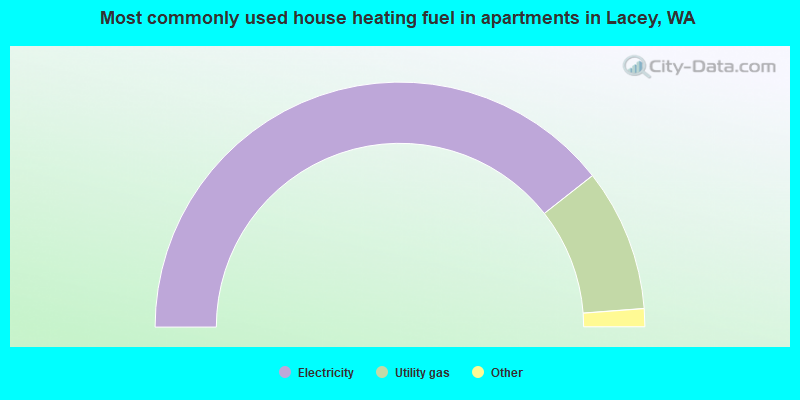
House heating fuel used in apartments - Utility gas (%)
House heating fuel used in apartments - Bottled, tank, or LP gas (%)
House heating fuel used in apartments - Electricity (%)
House heating fuel used in apartments - Fuel oil, kerosene, etc. (%)
House heating fuel used in apartments - Coal or coke (%)
House heating fuel used in apartments - Wood (%)
House heating fuel used in apartments - Solar energy (%)
House heating fuel used in apartments - Other fuel (%)
House heating fuel used in apartments - No fuel used (%)
Latest news about housing in Lacey, WA collected exclusively by city-data.com from local newspapers, TV, and radio stations
Median year house/condo built: 1997Median year apartment built: 1997Household type by relationship:
Households: 57,120
Male householders: 10,860 (2,189 living alone ), Female householders: 11,735 (4,150 living alone )10,777 spouses (10,672 opposite-sex spouses ), 1,825 unmarried partners , (1,660 opposite-sex unmarried partners ), 15,220 children (14,274 natural , 221 adopted , 724 stepchildren ), 960 grandchildren , 692 brothers or sisters , 737 parents , 12 foster children , 888 other relatives , 2,320 non-relatives In group quarters: 1,090
Size of family households: 6,838 2-persons , 3,411 3-persons , 2,376 4-persons , 787 5-persons , 496 6-persons , 416 7-or-more-persons .
Size of nonfamily households: 6,977 1-person , 1,301 2-persons , 204 3-persons , 67 4-persons , 100 5-persons .
6,676 married couples with children. single-parent households (1,220 men , 2,410 women ).
81.0% of residents of Lacey speak English at home. of residents speak Spanish at home (63% speak English very well , 19% speak English well , 14% speak English not well , 4% don't speak English at all ).of residents speak other Indo-European language at home (75% speak English very well , 22% speak English well , 2% speak English not well , 1% don't speak English at all ).of residents speak Asian or Pacific Island language at home (58% speak English very well , 24% speak English well , 14% speak English not well , 3% don't speak English at all ).of residents speak other language at home (67% speak English very well , 33% speak English well ).
Foreign born population: 7,053 (12.3%)of them are naturalized citizens )
Median number of rooms in houses and condos:
Median number of rooms in apartments
Owner-occupied Renter-occupied
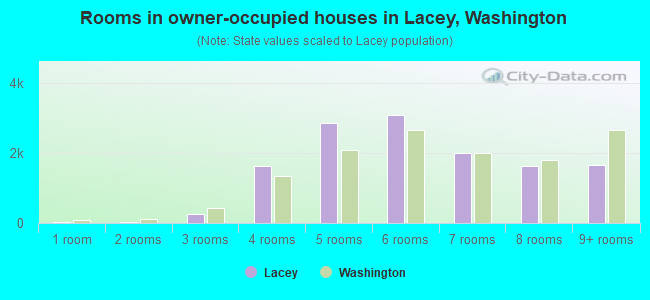
Rooms in owner-occupied houses in Lacey, Washington
16 1 room 24 2 rooms 264 3 rooms 1,633 4 rooms 2,857 5 rooms 3,095 6 rooms 2,016 7 rooms 1,644 8 rooms 1,652 9+ rooms
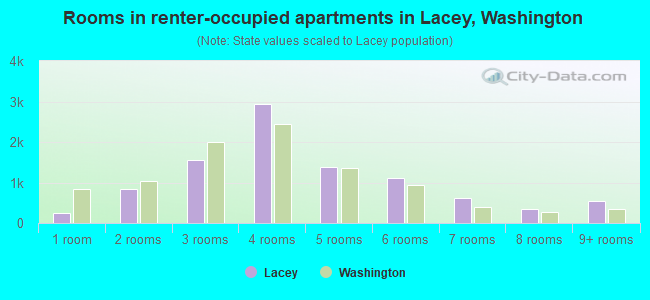
Rooms in renter-occupied apartments in Lacey, Washington
239 1 room 846 2 rooms 1,552 3 rooms 2,940 4 rooms 1,393 5 rooms 1,122 6 rooms 629 7 rooms 345 8 rooms 542 9+ rooms
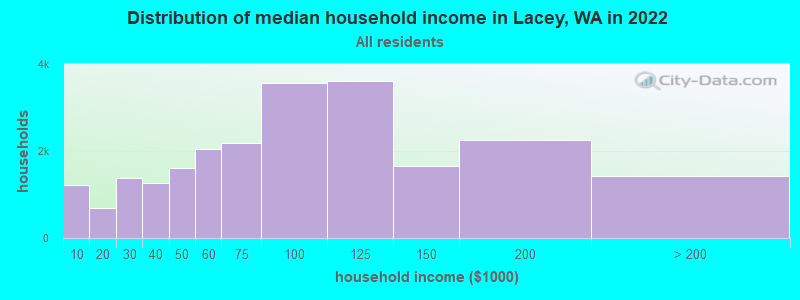
Lacey, WA household income distribution 1,210 Less than $10,000693 $10,000 to $19,9991,384 $20,000 to $29,9991,264 $30,000 to $39,9991,599 $40,000 to $49,9992,040 $50,000 to $59,9992,194 $60,000 to $74,9993,558 $75,000 to $99,9993,598 $100,000 to $124,9991,650 $125,000 to $149,9992,256 $150,000 to $199,9991,431 $200,000 or more
Home value of owner - occupied houses in 2022 in Lacey, WA 62 Less than $10,0009 $10,000 to $14,99964 $15,000 to $19,99930 $20,000 to $24,99923 $25,000 to $29,999116 $30,000 to $34,99927 $35,000 to $39,999153 $40,000 to $49,99966 $50,000 to $59,99930 $60,000 to $69,999131 $70,000 to $79,99944 $80,000 to $89,99933 $100,000 to $124,99991 $125,000 to $149,99944 $150,000 to $174,99983 $175,000 to $199,999332 $200,000 to $249,9991,174 $250,000 to $299,9992,180 $300,000 to $399,9993,767 $400,000 to $499,9993,118 $500,000 to $749,999367 $750,000 to $999,99963 $1,000,000 to $1,499,99926 $1,500,000 to $1,999,99959 $2,000,000 or moreRent paid by renters in 2022 in Lacey, WA 15 $100 to $14911 $200 to $24935 $300 to $34915 $350 to $39911 $500 to $54958 $550 to $599104 $600 to $64939 $650 to $699146 $700 to $74983 $750 to $799440 $800 to $899419 $900 to $9991,293 $1,000 to $1,2491,836 $1,250 to $1,4992,965 $1,500 to $1,9991,502 $2,000 to $2,499179 $2,500 to $2,999174 $3,000 to $3,499138 $3,500 or more138 No cash rent
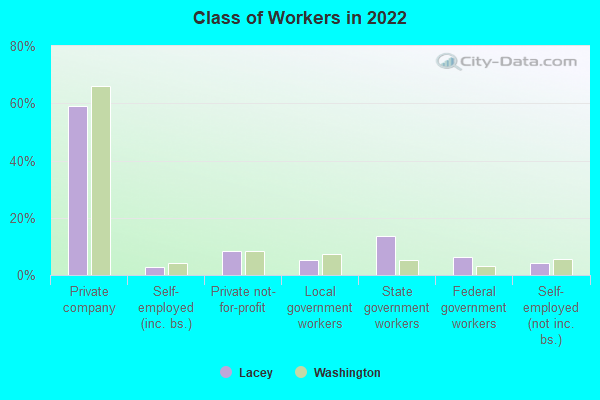
Percentage of workers working in this county: 73.1%Number of people working at home: 4,489 (16.5% of all workers )
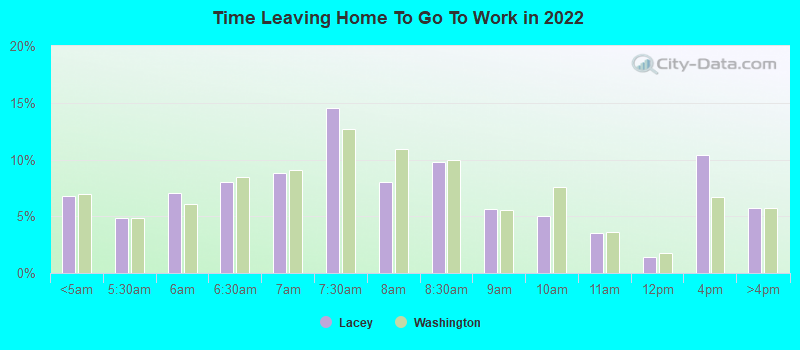
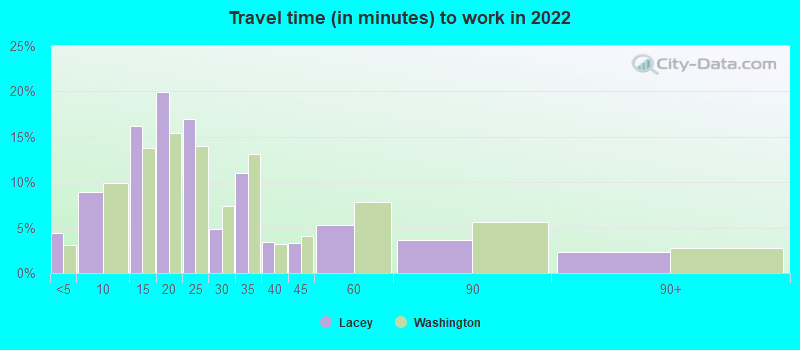
Travel time to work (commute)
Less than 5 minutes: 1,0395 to 9 minutes: 1,71310 to 14 minutes: 2,48415 to 19 minutes: 3,91020 to 24 minutes: 4,91825 to 29 minutes: 1,68330 to 34 minutes: 2,23335 to 39 minutes: 69940 to 44 minutes: 77745 to 59 minutes: 1,92660 to 89 minutes: 79190 or more minutes: 332
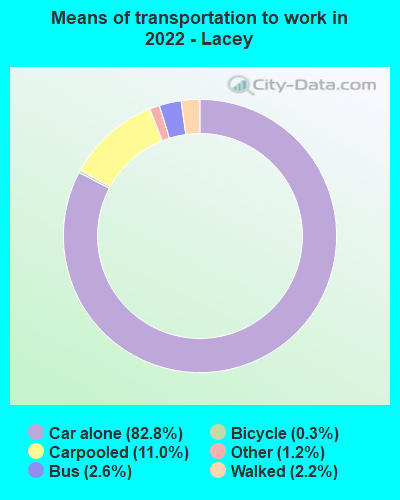
Means of transportation to work:
Drove a car alone: 18,425 (66.9%)Carpooled: 2,334 (8.5%)Bus : 529 (1.9%)Light rail, streetcar or trolley : 19 (0.1%)Taxi: 221 (0.8%)Bicycle: 53 (0.2%)Walked: 896 (3.3%)Worked at home: 4,489 (16.3%)
Unemployment by race in 2022
Unemployment rate for White non-Hispanic residents 4.5% Males3.3% FemalesUnemployment rate for Black residents 3.1% Males3.3% FemalesUnemployment rate for American Indian and Alaska Native residents 6.4% FemalesUnemployment rate for Asian residents 0.4% Males3.7% FemalesUnemployment rate for other race residents 7.6% FemalesUnemployment rate for two or more race residents 2.9% Males3.1% FemalesUnemployment rate for Hispanic or Latino residents 2.2% Males15.5% Females
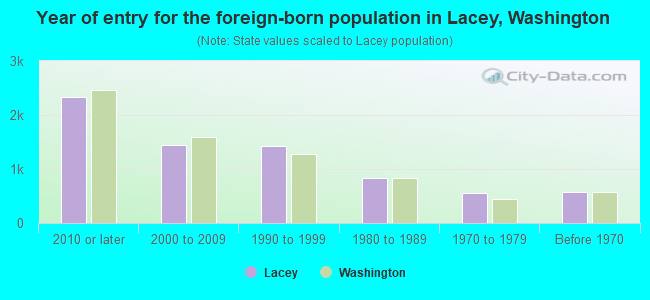
Year of entry for the foreign-born population in Lacey, Washington
2,341 2010 or later 1,445 2000 to 2009 1,425 1990 to 1999 833 1980 to 1989 559 1970 to 1979 577 Before 1970
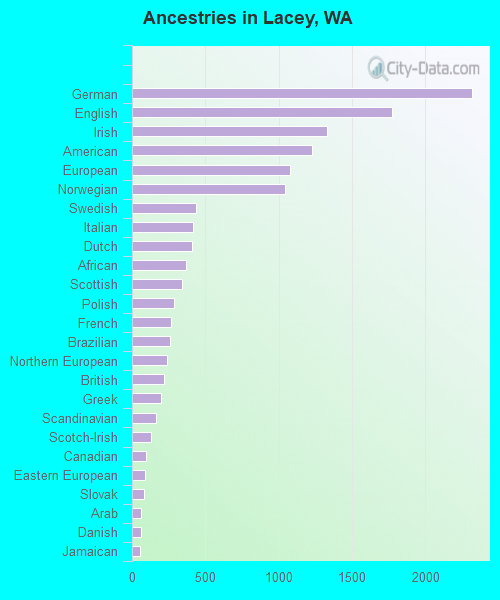
First ancestries reported:
German: 2,320 (8.7%)
English: 1,775 (6.6%)
Irish: 1,329 (5.0%)
American: 1,227 (4.6%)
European: 1,078 (4.0%)
Norwegian: 1,041 (3.9%)
Swedish: 439 (1.6%)
Italian: 417 (1.6%)
Dutch: 411 (1.5%)
African: 366 (1.4%)
Scottish: 343 (1.3%)
Polish: 288 (1.1%)
French: 269 (1.0%)
Brazilian: 260 (1.0%)
Northern European: 236 (0.9%)
British: 215 (0.8%)
Greek: 196 (0.7%)
Scandinavian: 167 (0.6%)
Scotch-Irish: 128 (0.5%)
Canadian: 93 (0.3%)
Eastern European: 87 (0.3%)
Slovak: 79 (0.3%)
Arab: 63 (0.2%)
Danish: 63 (0.2%)
Jamaican: 54 (0.2%)
French Canadian: 52 (0.2%)
Finnish: 47 (0.2%)
Hungarian: 46 (0.2%)
Afghan: 38 (0.1%)
Ukrainian: 38 (0.1%)
Welsh: 35 (0.1%)
Lithuanian: 32 (0.1%)
Russian: 28 (0.1%)
Austrian: 27 (0.1%)
West Indian: 22 (0.08%)
Romanian: 21 (0.08%)
Kenyan: 19 (0.07%)
Pennsylvania German: 18 (0.07%)
German Russian: 17 (0.06%)
Portuguese: 17 (0.06%)
Lebanese: 16 (0.06%)
Icelander: 12 (0.04%)
Czechoslovakian: 11 (0.04%)
Swiss: 10 (0.04%)
Basque: 8 (0.03%)
Celtic: 8 (0.03%)
Assyrian: 3 (0.01%)
Most common places of birth for foreign-born residents (%): Mexico Lacey:
20.6% (1,489)Washington:
21.1% (241,655)
Philippines Lacey:
13.9% (1,001)Washington:
6.3% (71,661)
Vietnam Lacey:
13.1% (947)Washington:
5.4% (62,003)
Korea Lacey:
9.3% (671)Washington:
4.3% (48,886)
Germany Lacey:
5.1% (367)Washington:
1.6% (17,761)
China, excluding Hong Kong and Taiwan Lacey:
3.9% (282)Washington:
7.4% (84,470)
Ghana Lacey:
3.6% (263)Washington:
0.1% (1,702)
Thailand Lacey:
3.5% (251)Washington:
0.9% (9,937)
Canada Lacey:
3.2% (231)Washington:
4.1% (47,238)
Brazil Lacey:
3.1% (221)Washington:
0.8% (9,359)
Poland Lacey:
1.5% (109)Washington:
0.4% (4,963)
Place of birth for U.S.-born residents:
This state: 22,133Other state: 24,712Northeast: 2,569Midwest: 4,992South: 6,352West: 10,844 81.9% of Lacey residents lived in the same house 1 years ago.
Out of people who lived in different houses, 30.7% lived in this county.
Out of people who lived in different counties, 35.8% lived in Washington.
Lacey:
81.9%State average:
85.2%
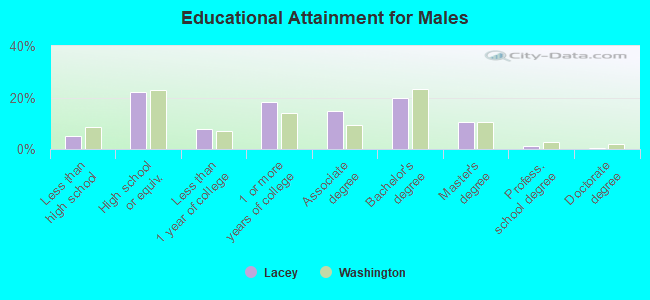
Education attainment for males 25 years and older:
No schooling: 168Nursery to 4th grade: 05th and 6th grade: 677th and 8th grade: 779th grade: 6010th grade: 27411th grade: 19212th grade, no diploma: 148High school graduate (or equivalency): 4,148Less than 1 year of college: 1,478Some college more than 1 year, no degree: 3,443Associate degree: 2,821Bachelor's degree: 3,728Master's degree: 1,957Professional school degree: 234Doctorate degree: 101
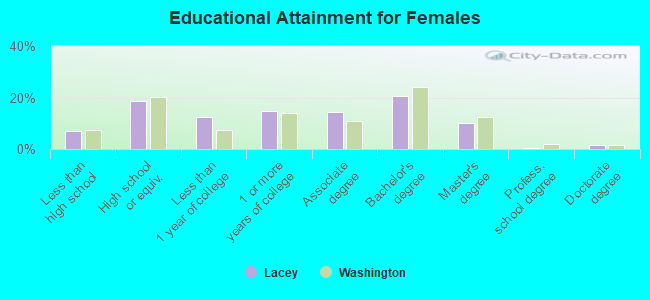
Education attainment for females 25 years and older:
No schooling: 313Nursery to 4th grade: 535th and 6th grade: 2597th and 8th grade: 669th grade: 33110th grade: 9511th grade: 18312th grade, no diploma: 211High school graduate (or equivalency): 3,988Less than 1 year of college: 2,609Some college more than 1 year, no degree: 3,118Associate degree: 3,019Bachelor's degree: 4,348Master's degree: 2,124Professional school degree: 104Doctorate degree: 353
Housing units in structures:
One, detached: 14,593One, attached: 1,829Two: 8853 or 4: 1,4495 to 9: 80910 to 19: 1,02520 to 49: 91650 or more: 1,346Mobile homes: 1,010Boats, RVs, vans, etc.: 43Median worth of mobile homes: $72,430
Housing units lacking complete plumbing facilities in 2022: 0.2%Housing units lacking complete kitchen facilities in 2022: 1.1%House/condo owner moved in on average 8 years ago
Renter moved in on average 3 years ago
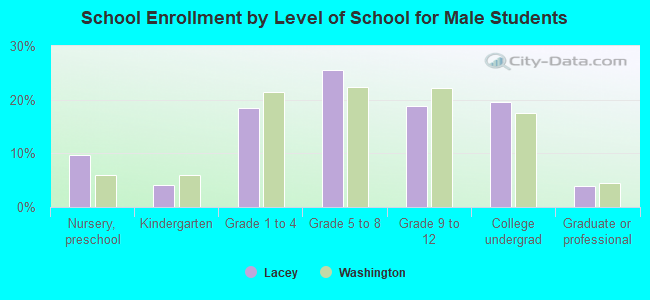
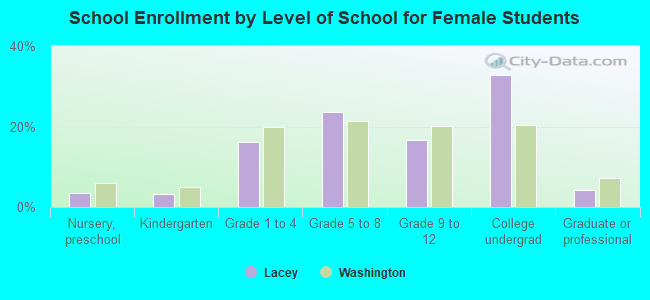
Private vs. public school enrollment:
Students in private schools in grades 1 to 8 (elementary and middle school): 331 Here:
6.3%Washington:
12.4%
Students in private schools in grades 9 to 12 (high school): 151 Students in private undergraduate colleges: 819 Here:
26.3%Washington:
16.5%