Lake Belvedere Estates, FL (Florida) Houses and Residents
| Lake Belvedere Estates: | $376,407 |
| Florida: | $354,100 |
Mean price in 2022:
Detached houses: $306,586
Here: $306,586 State: $500,941 Townhouses or other attached units: $219,980
Here: $219,980 State: $370,869 In 5-or-more-unit structures: $248,623
Here: $248,623 State: $447,145
Total population: 3,334 (Urban population: 1,494, Rural population: 0)
Houses: 729 (673 occupied: 637 owner occupied, 44 renter occupied)
| % of renters here: | 6% |
| State: | 33% |
Housing density: 1,260 houses/condos per square mile
Median price asked for vacant for-sale houses and condos in 2022 in this county: $690,805.
Median contract rent in 2022: $1,390 (lower quartile is $1,177, upper quartile is $1,604)
Median gross rent in Lake Belvedere Estates, FL in 2022: $1,632
Housing units in Lake Belvedere Estates with a mortgage: 549 (61 second mortgage, 0 home equity loan, 57 both second mortgage and home equity loan)
Houses without a mortgage: 35
Median household income for houses/condos with a mortgage: $72,266
Median monthly housing costs: $1,573
Compare current foreclosures near Lake Belvedere Estates, FL:
| Photo | Address | Area | Beds / Baths | Price | Details |
|---|---|---|---|---|---|

|
#1
Briarwood Cir Apt 4
Boynton Beach, FL 33437
|
2,227 sq. feet
|
2 baths 2 beds |
$321,100
|
show details |

|
#2
Northgreen Dr
Lake Worth, FL 33449
|
2,929 sq. feet
|
3 baths 3 beds |
$695,000
|
show details |

|
#3
Westgate Ln Apt D
Boynton Beach, FL 33436
|
1,808 sq. feet
|
2 baths 2 beds |
$130,000
|
show details |

|
#4
Poppy Pl 52-B
Delray Beach, FL 33484
|
1,220 sq. feet
|
2 baths 2 beds |
$193,800
|
show details |

|
#5
Lantern Key Dr
Lake Worth, FL 33463
|
2,242 sq. feet
|
2 baths 4 beds |
show details | |

|
#6
NW 7th St
Boynton Beach, FL 33426
|
1,678 sq. feet
|
2 baths 3 beds |
show details | |

|
#7
Presidential Way Apt 202
West Palm Beach, FL 33401
|
898 sq. feet
|
1 baths 1 beds |
show details | |

|
#8
Strawberry Lakes Cir
Lake Worth, FL 33463
|
1,477 sq. feet
|
2 baths 3 beds |
show details | |

|
#9
Pinehurst Rd
Lake Worth, FL 33461
|
1,494 sq. feet
|
2 baths 3 beds |
show details | |

|
#10
Gazetta Way
West Palm Beach, FL 33413
|
2,308 sq. feet
|
3 baths 4 beds |
show details |
| Photo | Address | Area | Beds / Baths | Price | Details |
|---|---|---|---|---|---|

|
#11
Venessa St
Lake Worth, FL 33461
|
1,203 sq. feet
|
2 baths 3 beds |
show details | |

|
#12
Ocean Pkwy
Boynton Beach, FL 33435
|
1,128 sq. feet
|
1 baths 3 beds |
show details | |

|
#13
36th St
West Palm Beach, FL 33407
|
1,174 sq. feet
|
1 baths 2 beds |
show details | |

|
#14
Felter St
Jupiter, FL 33458
|
1,352 sq. feet
|
2 baths 3 beds |
show details | |

|
#15
47th Ct N
Loxahatchee, FL 33470
|
1,058 sq. feet
|
2 baths 3 beds |
show details | |

|
#16
2nd Ct
Palm Beach Gardens, FL 33410
|
1,236 sq. feet
|
2 baths 2 beds |
show details | |

|
#17
Hillcrest Dr
Lake Worth, FL 33461
|
2,229 sq. feet
|
3 baths 5 beds |
show details | |

|
#18
Venessa St
Lake Worth, FL 33461
|
1,203 sq. feet
|
2 baths 3 beds |
show details | |

|
#19
Sussex H
West Palm Beach, FL 33417
|
615 sq. feet
|
1 baths 1 beds |
show details | |

|
#20
47th Ct N
Loxahatchee, FL 33470
|
2,044 sq. feet
|
3 baths 2 beds |
show details |
| Photo | Address | Area | Beds / Baths | Price | Details |
|---|---|---|---|---|---|

|
#21
Monmouth Rd
West Palm Beach, FL 33413
|
2,283 sq. feet
|
2 baths 4 beds |
show details | |

|
#22
W Prestwich Dr
Loxahatchee, FL 33470
|
1,964 sq. feet
|
2 baths 3 beds |
show details | |

|
#23
Foss Rd
Lake Worth, FL 33461
|
1,721 sq. feet
|
3 baths 2 beds |
show details | |

|
#24
Palm Rd
West Palm Beach, FL 33406
|
- sq. feet
|
2 baths 3 beds |
show details | |

|
#25
Burgundy O
Delray Beach, FL 33484
|
907 sq. feet
|
2 baths 2 beds |
show details | |

|
#26
Alto Rd
Lake Worth, FL 33462
|
982 sq. feet
|
2 baths 3 beds |
show details | |

|
#27
Woodcrest Rd N
West Palm Beach, FL 33417
|
1,542 sq. feet
|
2 baths 3 beds |
show details | |

|
#28
72nd Rd N
Loxahatchee, FL 33470
|
2,024 sq. feet
|
2 baths 3 beds |
show details | |

|
#29
Wilma Cir
West Palm Beach, FL 33404
|
1,380 sq. feet
|
2 baths 2 beds |
show details | |

|
#30
Sapphire Rd
Lake Worth, FL 33462
|
1,872 sq. feet
|
2 baths 4 beds |
show details |
| Photo | Address | Area | Beds / Baths | Price | Details |
|---|---|---|---|---|---|

|
#31
Columbine Ave
West Palm Beach, FL 33414
|
2,306 sq. feet
|
2 baths 3 beds |
show details | |

|
#32
Hypoluxo Rd
Lake Worth, FL 33462
|
1,580 sq. feet
|
2 baths 3 beds |
show details | |

|
#33
Exotica Ln
West Palm Beach, FL 33414
|
2,006 sq. feet
|
2 baths 4 beds |
show details | |

|
#34
Red Reef St
Lake Worth, FL 33467
|
1,760 sq. feet
|
2 baths 3 beds |
show details | |

|
#35
Lake Shore Dr Apt 804
West Palm Beach, FL 33404
|
1,440 sq. feet
|
2 baths 2 beds |
show details | |

|
#36
Spring Isles Blvd
Lake Worth, FL 33463
|
1,768 sq. feet
|
2 baths 3 beds |
show details | |

|
#37
Edisto Dr
Lake Worth, FL 33467
|
1,375 sq. feet
|
2 baths 3 beds |
show details | |

|
#38
Burgess Dr
Lake Worth, FL 33467
|
1,416 sq. feet
|
2 baths 3 beds |
show details | |

|
#39
Crescent Lake Way
Lake Worth, FL 33463
|
1,105 sq. feet
|
2 baths 2 beds |
show details | |

|
#40
Primrose Ln
West Palm Beach, FL 33414
|
1,621 sq. feet
|
2 baths 3 beds |
show details |
| Photo | Address | Area | Beds / Baths | Price | Details |
|---|---|---|---|---|---|

|
#41
Ashley Shores Cir
Lake Worth, FL 33467
|
2,053 sq. feet
|
3 baths 4 beds |
show details | |

|
#42
Crescent Lake Way
Lake Worth, FL 33463
|
1,295 sq. feet
|
2 baths 3 beds |
show details | |

|
#43
Gypsum Pl
West Palm Beach, FL 33413
|
3,250 sq. feet
|
3 baths 5 beds |
show details | |

|
#44
Smithbrooke Dr
Lake Worth, FL 33467
|
1,275 sq. feet
|
2 baths 3 beds |
show details | |

|
#45
Sandtree Dr
West Palm Beach, FL 33403
|
1,430 sq. feet
|
2 baths 3 beds |
show details | |

|
#46
S M St
Lake Worth, FL 33460
|
1,676 sq. feet
|
2 baths 4 beds |
show details | |

|
#47
14th Ave S
Lake Worth, FL 33460
|
1,050 sq. feet
|
1 baths 3 beds |
show details | |

|
#48
Avenue H W
West Palm Beach, FL 33404
|
1,298 sq. feet
|
2 baths 3 beds |
show details | |

|
#49
Brickyard Cir
Lake Worth, FL 33467
|
2,236 sq. feet
|
2 baths 3 beds |
show details | |

|
Check over 1 million property listings on Foreclosure.com!
|
browse all offers | |||


 | Places that don't feel like Florida? (65 replies) |

Median year apartment built: 1968
Household type by relationship:
Households: 2,912- Male householders: 375 (21 living alone), Female householders: 296 (82 living alone)
411 spouses (411 opposite-sex spouses), 26 unmarried partners, (26 opposite-sex unmarried partners), 1,532 children (1,420 natural, 0 adopted, 112 stepchildren), 74 grandchildren, 19 brothers or sisters, 127 parents, 0 foster children, 41 other relatives, 0 non-relatives
- In group quarters: 6
Size of family households: 109 2-persons, 157 3-persons, 97 4-persons, 83 5-persons, 29 6-persons, 106 7-or-more-persons.
Size of nonfamily households: 106 1-person.
611 married couples with children.
238 single-parent households (12 men, 226 women).
47.3% of residents of Lake Belvedere Estates speak English at home.
15.1% of residents speak Spanish at home (65% speak English very well, 23% speak English well, 12% speak English not well).
34.8% of residents speak other Indo-European language at home (53% speak English very well, 33% speak English well, 3% speak English not well, 10% don't speak English at all).
Foreign born population: 1,297 (44.5%)
(45.1% of them are naturalized citizens)
| Here: | 6.7 |
| State: | 5.9 |
| Here: | 4.6 |
| State: | 4.2 |

- Bedrooms in owner-occupied houses and condos in Lake Belvedere Estates, Florida
- 0no bedroom
- 01 bedroom
- 92 bedrooms
- 3713 bedrooms
- 2144 bedrooms
- 435+ bedrooms

- Bedrooms in renter-occupied apartments in Lake Belvedere Estates, Florida
- 0no bedroom
- 01 bedroom
- 02 bedrooms
- 263 bedrooms
- 194 bedrooms
- 05+ bedrooms

- Cars and other vehicles available in Lake Belvedere Estates in owner-occupied houses/condos
- 8no vehicle
- 2441 vehicle
- 1462 vehicles
- 1353 vehicles
- 894 vehicles
- 155+ vehicles

- Cars and other vehicles available in Lake Belvedere Estates in renter-occupied apartments
- 0no vehicle
- 181 vehicle
- 272 vehicles
- 03 vehicles
- 04 vehicles
- 05+ vehicles

- Rooms in owner-occupied houses in Lake Belvedere Estates, Florida
- 01 room
- 02 rooms
- 93 rooms
- 534 rooms
- 1015 rooms
- 1336 rooms
- 2017 rooms
- 728 rooms
- 699+ rooms

- Rooms in renter-occupied apartments in Lake Belvedere Estates, Florida
- 01 room
- 02 rooms
- 03 rooms
- 184 rooms
- 275 rooms
- 06 rooms
- 07 rooms
- 08 rooms
- 09+ rooms


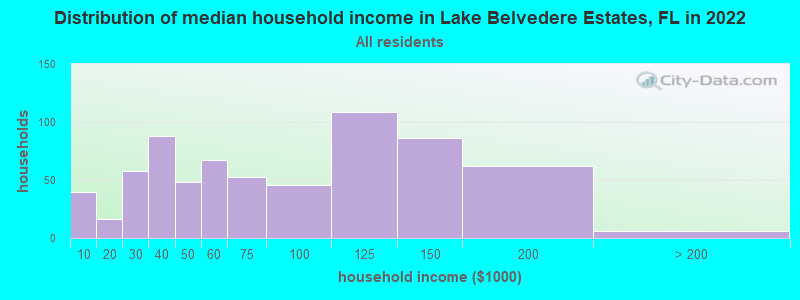
Lake Belvedere Estates, FL household income distribution

- 40Less than $10,000
- 16$10,000 to $19,999
- 58$20,000 to $29,999
- 88$30,000 to $39,999
- 48$40,000 to $49,999
- 67$50,000 to $59,999
- 53$60,000 to $74,999
- 46$75,000 to $99,999
- 109$100,000 to $124,999
- 86$125,000 to $149,999
- 62$150,000 to $199,999
- 6$200,000 or more
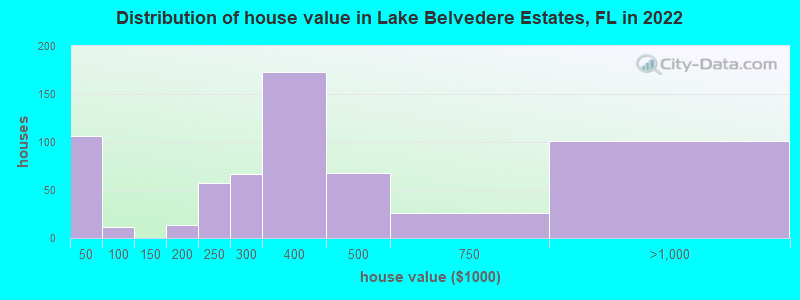
Home value of owner - occupied houses in 2022 in Lake Belvedere Estates, FL
-
- 106$25,000 to $29,999
- 4$80,000 to $89,999
- 6$90,000 to $99,999
- 13$150,000 to $174,999
- 57$200,000 to $249,999
- 66$250,000 to $299,999
- 173$300,000 to $399,999
- 67$400,000 to $499,999
- 25$500,000 to $749,999
- 101$750,000 to $999,999
Rent paid by renters in 2022 in Lake Belvedere Estates, FL
-
- 15$1,000 to $1,249
- 14$1,250 to $1,499
- 7$1,500 to $1,999


Percentage of workers working in this county: 98.8%
Number of people working at home: 172 (13.1% of all workers)
Travel time to work (commute)
- Less than 5 minutes: 0
- 5 to 9 minutes: 49
- 10 to 14 minutes: 117
- 15 to 19 minutes: 149
- 20 to 24 minutes: 205
- 25 to 29 minutes: 66
- 30 to 34 minutes: 429
- 35 to 39 minutes: 24
- 40 to 44 minutes: 70
- 45 to 59 minutes: 0
- 60 to 89 minutes: 0
- 90 or more minutes: 17
Means of transportation to work:
- Drove a car alone: 703 (86.9%)
- Carpooled: 66 (8.2%)
- Taxi: 9 (1.1%)
- Walked: 6 (0.7%)
- Worked at home: 25 (3.1%)

- Unemployment by race in 2022
- Unemployment rate for Black residents
- 11.8%Males

- Year of entry for the foreign-born population in Lake Belvedere Estates, Florida
- 5672010 or later
- 2732000 to 2009
- 2501990 to 1999
- 831980 to 1989
- 301970 to 1979
- 55Before 1970

First ancestries reported:
- Haitian: 984 (54.0%)
- Jamaican: 224 (12.3%)
- German: 87 (4.8%)
- Irish: 39 (2.1%)
- American: 18 (1.0%)
- Italian: 18 (1.0%)
- Polish: 17 (0.9%)
- French: 15 (0.8%)
- English: 14 (0.8%)
- Scottish: 8 (0.4%)
- African: 7 (0.4%)
Most common places of birth for foreign-born residents (%):
| Lake Belvedere Estates: | 68.9% (894) |
| Florida: | 7.5% (342,375) |
| Lake Belvedere Estates: | 19.0% (247) |
| Florida: | 5.0% (227,319) |
| Lake Belvedere Estates: | 4.2% (55) |
| Florida: | 0.0% (420) |
| Lake Belvedere Estates: | 3.6% (47) |
| Florida: | 2.1% (97,632) |
| Lake Belvedere Estates: | 3.5% (45) |
| Florida: | 1.1% (49,838) |
| Lake Belvedere Estates: | 3.2% (41) |
| Florida: | 1.0% (43,642) |
| Lake Belvedere Estates: | 2.6% (34) |
| Florida: | 22.0% (1,006,576) |
Place of birth for U.S.-born residents:
- This state: 1,191
- Other state: 371
- Northeast: 231
- Midwest: 39
- South: 99
- West: 0
93.4% of Lake Belvedere Estates residents lived in the same house 1 years ago.
Out of people who lived in different houses, 45.4% lived in this county.
Out of people who lived in different counties, 0.0% lived in Florida.
| Lake Belvedere Estates: | 93.4% |
| State average: | 86.3% |
Education attainment for males 25 years and older:
- No schooling: 30
- Nursery to 4th grade: 0
- 5th and 6th grade: 0
- 7th and 8th grade: 0
- 9th grade: 27
- 10th grade: 11
- 11th grade: 37
- 12th grade, no diploma: 23
- High school graduate (or equivalency): 273
- Less than 1 year of college: 0
- Some college more than 1 year, no degree: 25
- Associate degree: 25
- Bachelor's degree: 57
- Master's degree: 75
- Professional school degree: 0
- Doctorate degree: 0

Education attainment for females 25 years and older:
- No schooling: 0
- Nursery to 4th grade: 0
- 5th and 6th grade: 134
- 7th and 8th grade: 0
- 9th grade: 30
- 10th grade: 7
- 11th grade: 0
- 12th grade, no diploma: 11
- High school graduate (or equivalency): 304
- Less than 1 year of college: 8
- Some college more than 1 year, no degree: 113
- Associate degree: 100
- Bachelor's degree: 105
- Master's degree: 78
- Professional school degree: 12
- Doctorate degree: 0


Housing units in structures:
- One, detached: 689
- One, attached: 20
- 3 or 4: 19
House/condo owner moved in on average 8 years ago
Renter moved in on average 5 years ago

Private vs. public school enrollment:
| Here: | 26.6% |
| Florida: | 15.8% |
| Here: | 11.1% |
| Florida: | 12.9% |
| Here: | 0.0% |
| Florida: | 23.6% |


