Lake City, SC (South Carolina) Houses and Residents
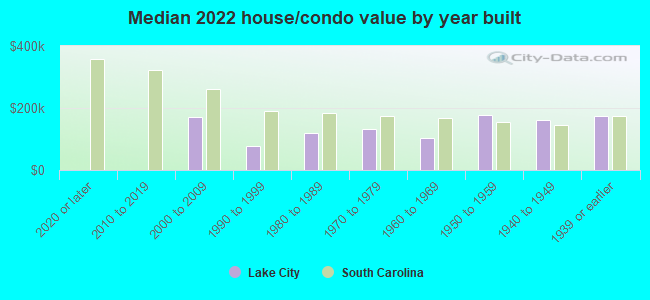
| Lake City: | $132,232 |
| South Carolina: | $254,600 |
Mean price in 2022:
Detached houses: $138,856
Here: $138,856 State: $368,255 Mobile homes: $164,206
Here: $164,206 State: $102,531
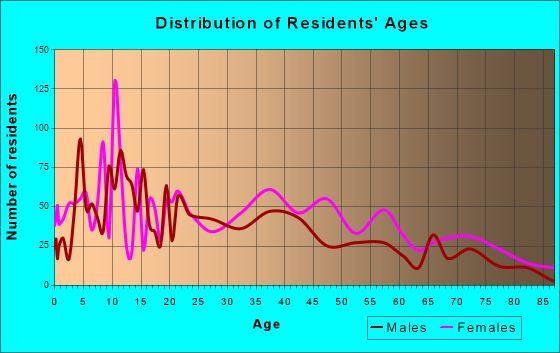
Total population: 6,732 (Urban population: 6,428 (all inside urban clusters), Rural population: 0)
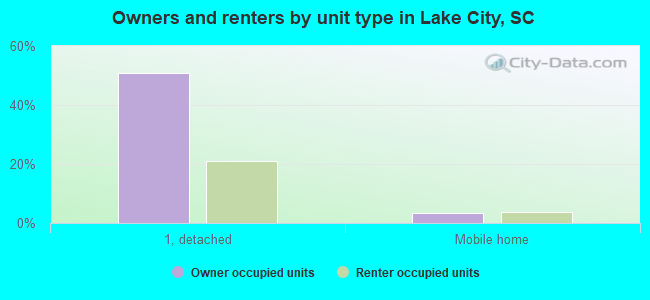
Houses: 2,931 (2,474 occupied: 1,095 owner occupied, 1,374 renter occupied)
| % of renters here: | 56% |
| State: | 28% |
Housing density: 618 houses/condos per square mile
Median price asked for vacant for-sale houses and condos in 2022: $400,393.
Median contract rent in 2022: $476 (lower quartile is $347, upper quartile is $615)
Median rent asked for vacant for-rent units in 2022: $701
Median gross rent in Lake City, SC in 2022: $621
Housing units in Lake City with a mortgage: 505 (7 second mortgage, 0 home equity loan, 0 both second mortgage and home equity loan)
Houses without a mortgage: 0
Median household income for houses/condos with a mortgage: $61,766
Median household income for apartments without a mortgage: $59,912
Median monthly housing costs: $602
Compare current foreclosures near Lake City, SC:
| Photo | Address | Area | Beds / Baths | Price | Details |
|---|---|---|---|---|---|

|
#1
Moore Rd
Lake City, SC 29560
|
3,149 sq. feet
|
3 baths 6 beds |
$74,900
|
show details |

|
#2
Williamsburg Ave
Lake City, SC 29560
|
1,728 sq. feet
|
1 baths 2 beds |
show details | |

|
#3
S Morris St
Lake City, SC 29560
|
1,229 sq. feet
|
1 baths 3 beds |
show details | |

|
#4
John St
Lake City, SC 29560
|
960 sq. feet
|
1 baths 2 beds |
show details | |

|
#5
Azalea Dr
Lake City, SC 29560
|
1,704 sq. feet
|
1 baths 3 beds |
show details | |

|
#6
Huntley St
Lake City, SC 29560
|
1,606 sq. feet
|
2 baths 4 beds |
show details | |

|
#7
Robin St
Lake City, SC 29560
|
1,856 sq. feet
|
2 baths 3 beds |
show details | |

|
#8
Forrest St
Lake City, SC 29560
|
3,136 sq. feet
|
2 baths 4 beds |
show details | |

|
#9
Deerfoot Rd
Lake City, SC 29560
|
1,493 sq. feet
|
2 baths 3 beds |
show details | |

|
#10
Wilmont St
Lake City, SC 29560
|
792 sq. feet
|
1 baths 2 beds |
show details |
| Photo | Address | Area | Beds / Baths | Price | Details |
|---|---|---|---|---|---|

|
#11
Cedar St
Lake City, SC 29560
|
840 sq. feet
|
1 baths 3 beds |
show details | |

|
#12
White Oak Rd
Lake City, SC 29560
|
- sq. feet
|
- baths - beds |
show details | |

|
#13
Twin Oaks Cir
Lake City, SC 29560
|
- sq. feet
|
- baths - beds |
show details | |

|
#14
1/2 Rodman Rd
Lake City, SC 29560
|
- sq. feet
|
- baths - beds |
show details | |

|
#15
Rae St Lot 136
Lake City, SC 29560
|
- sq. feet
|
- baths - beds |
show details | |

|
#16
Cow Pasture Rd
Lake City, SC 29560
|
- sq. feet
|
- baths - beds |
show details | |

|
#17
Hendricks St
Lake City, SC 29560
|
- sq. feet
|
- baths - beds |
show details | |

|
#18
S Scurry Rd
Lake City, SC 29560
|
- sq. feet
|
- baths - beds |
show details | |

|
#19
Fairview St # A
Lake City, SC 29560
|
- sq. feet
|
- baths - beds |
show details | |

|
#20
E Smallwood Rd
Effingham, SC 29541
|
2,466 sq. feet
|
3 baths 4 beds |
$156,560
|
show details |
| Photo | Address | Area | Beds / Baths | Price | Details |
|---|---|---|---|---|---|

|
#21
N Matthews Rd
Lake City, SC 29560
|
- sq. feet
|
- baths - beds |
show details | |

|
#22
Barrineau Rd
Lake City, SC 29560
|
- sq. feet
|
- baths - beds |
show details | |

|
#23
Juniper Ln
Lake City, SC 29560
|
- sq. feet
|
- baths - beds |
show details | |

|
#24
Sherwood St
Kingstree, SC 29556
|
1,458 sq. feet
|
- baths - beds |
$39,900
|
show details |

|
#25
Pamplico Hwy
Florence, SC 29505
|
2,096 sq. feet
|
2 baths 4 beds |
show details | |

|
#26
S Cartersville Hwy
Timmonsville, SC 29161
|
1,827 sq. feet
|
2 baths 3 beds |
show details | |

|
#27
Moore Rd
Effingham, SC 29541
|
1,440 sq. feet
|
2 baths 4 beds |
show details | |

|
#28
Bingham Ave
Olanta, SC 29114
|
3,056 sq. feet
|
3 baths 4 beds |
show details | |

|
#29
Franklin Dr
Pamplico, SC 29583
|
962 sq. feet
|
1 baths 3 beds |
show details | |

|
#30
Clarkes Ln
Pamplico, SC 29583
|
832 sq. feet
|
1 baths 2 beds |
show details |
| Photo | Address | Area | Beds / Baths | Price | Details |
|---|---|---|---|---|---|

|
#31
Green Rd
Cades, SC 29518
|
1,782 sq. feet
|
2 baths 4 beds |
show details | |

|
#32
Legion Rd
Olanta, SC 29114
|
2,432 sq. feet
|
- baths - beds |
show details | |

|
#33
Armfield Rd
Effingham, SC 29541
|
1,016 sq. feet
|
2 baths - beds |
show details | |

|
#34
Manning Hwy
Greeleyville, SC 29056
|
2,142 sq. feet
|
2 baths - beds |
show details | |

|
#35
W Old Number 4 Hwy
Scranton, SC 29591
|
- sq. feet
|
- baths - beds |
show details | |

|
#36
Lexington Ave
Kingstree, SC 29556
|
- sq. feet
|
- baths - beds |
show details | |

|
#37
Lexington Ave
Kingstree, SC 29556
|
- sq. feet
|
- baths - beds |
show details | |

|
#38
N Brooks St Apt 4g
Kingstree, SC 29556
|
- sq. feet
|
- baths - beds |
show details | |

|
#39
Martin Luther King Ave # 133
Kingstree, SC 29556
|
- sq. feet
|
- baths - beds |
show details | |

|
#40
Country Ln
Timmonsville, SC 29161
|
- sq. feet
|
- baths - beds |
show details |
| Photo | Address | Area | Beds / Baths | Price | Details |
|---|---|---|---|---|---|

|
#41
Indiantown Swamp Rd
Hemingway, SC 29554
|
- sq. feet
|
- baths - beds |
show details | |

|
#42
Tyler Rd
Scranton, SC 29591
|
- sq. feet
|
- baths - beds |
show details | |

|
#43
Angel Rd
Hemingway, SC 29554
|
1,025 sq. feet
|
- baths - beds |
show details | |

|
#44
Sandy Pine Loop
Nesmith, SC 29580
|
1,025 sq. feet
|
- baths - beds |
show details | |

|
#45
Mill St
Scranton, SC 29591
|
- sq. feet
|
- baths - beds |
show details | |

|
#46
Rolling Hills Dr
Johnsonville, SC 29555
|
- sq. feet
|
- baths - beds |
show details | |

|
#47
E Saint Luke Church Rd
Johnsonville, SC 29555
|
- sq. feet
|
- baths - beds |
show details | |

|
#48
Knowlton Road
New Zion, SC 29111
|
- sq. feet
|
- baths - beds |
show details | |

|
#49
Old Manning Rd
New Zion, SC 29111
|
- sq. feet
|
- baths - beds |
show details | |

|
Check over 1 million property listings on Foreclosure.com!
|
browse all offers | |||


 | What's New/Closing/Coming to Florence (436 replies) |
| Which town or area is the best kept secret in SC? (51 replies) |
| NJ to SC (yes I’m Republican lol) (334 replies) |
| GSP Airport is depressing. (132 replies) |
| Rural Towns near Shoreline (75 replies) |
| What is life like in Marion? (6 replies) |
Median year apartment built: 1980
Household type by relationship:
Households: 6,066- Male householders: 884 (422 living alone), Female householders: 1,536 (675 living alone)
439 spouses (439 opposite-sex spouses), 105 unmarried partners, (61 opposite-sex unmarried partners), 1,744 children (1,612 natural, 0 adopted, 131 stepchildren), 411 grandchildren, 202 brothers or sisters, 296 parents, 7 foster children, 162 other relatives, 252 non-relatives
- In group quarters: 23
Size of family households: 382 2-persons, 523 3-persons, 199 4-persons, 106 5-persons, 90 6-persons, 13 7-or-more-persons.
Size of nonfamily households: 1,088 1-person, 88 2-persons.
230 married couples with children.
501 single-parent households (168 men, 333 women).
99.6% of residents of Lake City speak English at home.
Foreign born population: 29 (0.5%)
(24.1% of them are naturalized citizens)
| Here: | 6.4 |
| State: | 6.4 |
| Here: | 4.1 |
| State: | 4.5 |
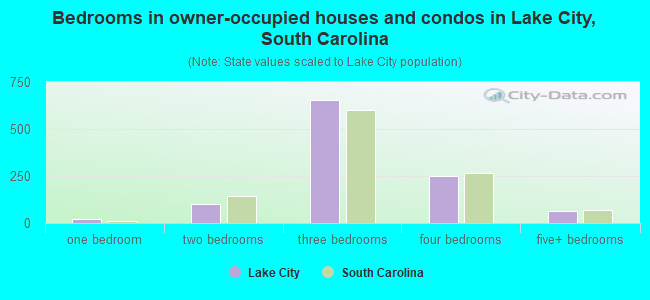
- Bedrooms in owner-occupied houses and condos in Lake City, South Carolina
- 0no bedroom
- 221 bedroom
- 1032 bedrooms
- 6543 bedrooms
- 2504 bedrooms
- 665+ bedrooms
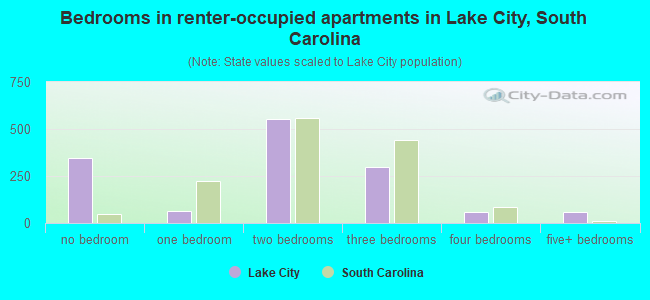
- Bedrooms in renter-occupied apartments in Lake City, South Carolina
- 347no bedroom
- 621 bedroom
- 5512 bedrooms
- 2983 bedrooms
- 564 bedrooms
- 605+ bedrooms
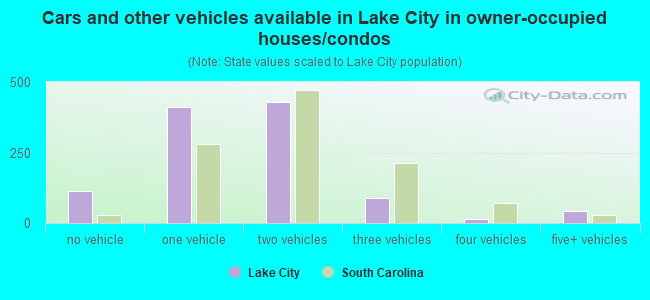
- Cars and other vehicles available in Lake City in owner-occupied houses/condos
- 115no vehicle
- 4101 vehicle
- 4292 vehicles
- 873 vehicles
- 134 vehicles
- 425+ vehicles
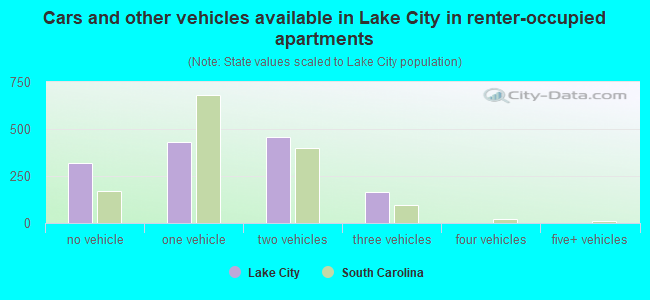
- Cars and other vehicles available in Lake City in renter-occupied apartments
- 317no vehicle
- 4311 vehicle
- 4602 vehicles
- 1673 vehicles
- 04 vehicles
- 05+ vehicles
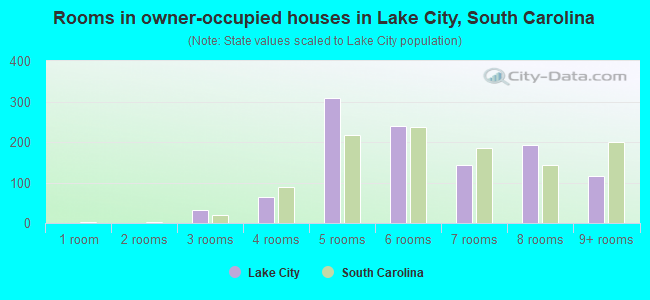
- Rooms in owner-occupied houses in Lake City, South Carolina
- 01 room
- 02 rooms
- 333 rooms
- 634 rooms
- 3095 rooms
- 2406 rooms
- 1427 rooms
- 1928 rooms
- 1169+ rooms
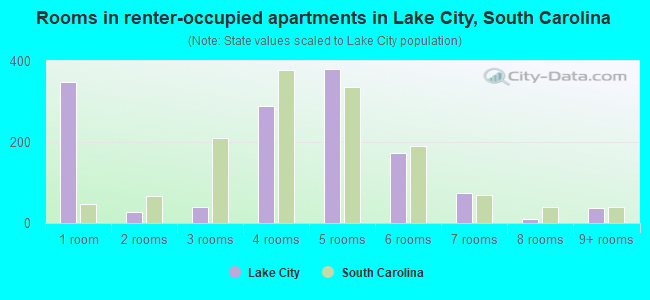
- Rooms in renter-occupied apartments in Lake City, South Carolina
- 3471 room
- 262 rooms
- 403 rooms
- 2884 rooms
- 3805 rooms
- 1736 rooms
- 747 rooms
- 108 rooms
- 369+ rooms
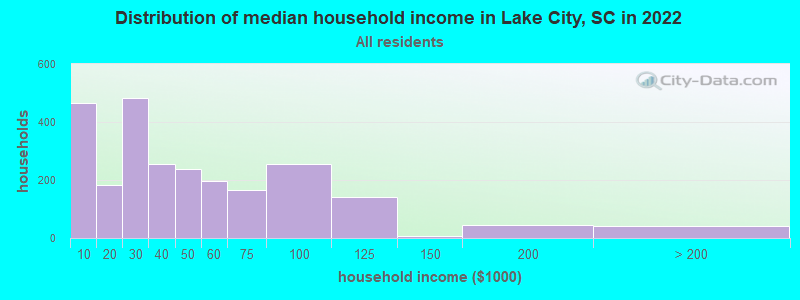
Lake City, SC household income distribution

- 467Less than $10,000
- 184$10,000 to $19,999
- 484$20,000 to $29,999
- 256$30,000 to $39,999
- 239$40,000 to $49,999
- 198$50,000 to $59,999
- 166$60,000 to $74,999
- 254$75,000 to $99,999
- 143$100,000 to $124,999
- 6$125,000 to $149,999
- 46$150,000 to $199,999
- 43$200,000 or more
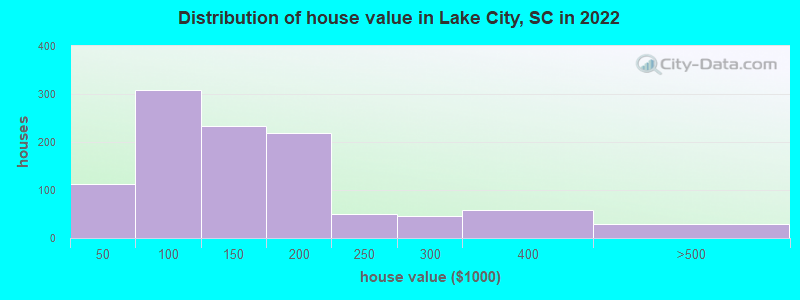
Home value of owner - occupied houses in 2022 in Lake City, SC
-
- 18Less than $10,000
- 93$40,000 to $49,999
- 3$50,000 to $59,999
- 13$60,000 to $69,999
- 59$70,000 to $79,999
- 17$80,000 to $89,999
- 121$90,000 to $99,999
- 111$100,000 to $124,999
- 121$125,000 to $149,999
- 144$150,000 to $174,999
- 74$175,000 to $199,999
- 51$200,000 to $249,999
- 45$250,000 to $299,999
- 58$300,000 to $399,999
- 26$400,000 to $499,999
- 1$500,000 to $749,999
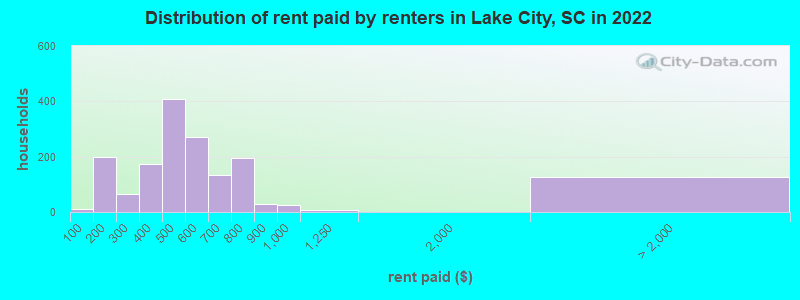
Rent paid by renters in 2022 in Lake City, SC
-
- 11Less than $100
- 197$150 to $199
- 64$250 to $299
- 174$350 to $399
- 211$400 to $449
- 199$450 to $499
- 131$500 to $549
- 139$550 to $599
- 120$600 to $649
- 13$650 to $699
- 87$700 to $749
- 106$750 to $799
- 28$800 to $899
- 23$900 to $999
- 8$1,000 to $1,249
- 126No cash rent
Percentage of workers working in this county: 69.9%
Number of people working at home: 56 (2.0% of all workers)
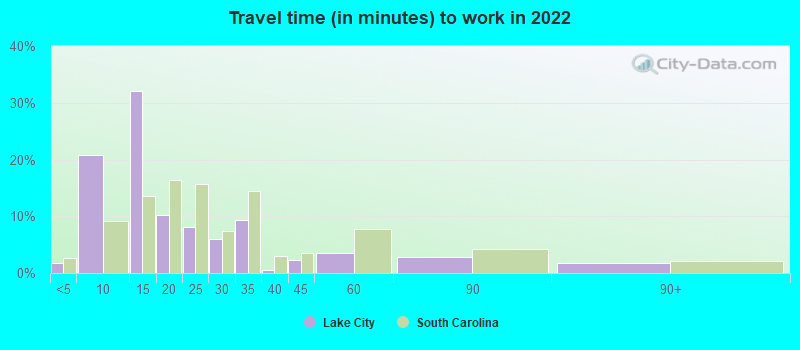
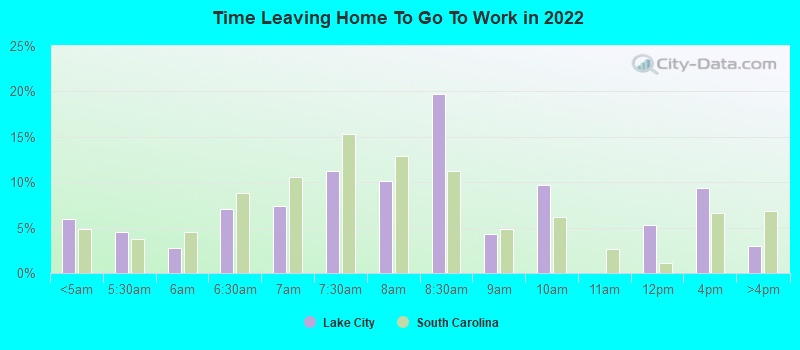
Travel time to work (commute)
- Less than 5 minutes: 66
- 5 to 9 minutes: 476
- 10 to 14 minutes: 648
- 15 to 19 minutes: 167
- 20 to 24 minutes: 106
- 25 to 29 minutes: 82
- 30 to 34 minutes: 294
- 35 to 39 minutes: 92
- 40 to 44 minutes: 46
- 45 to 59 minutes: 69
- 60 to 89 minutes: 134
- 90 or more minutes: 127
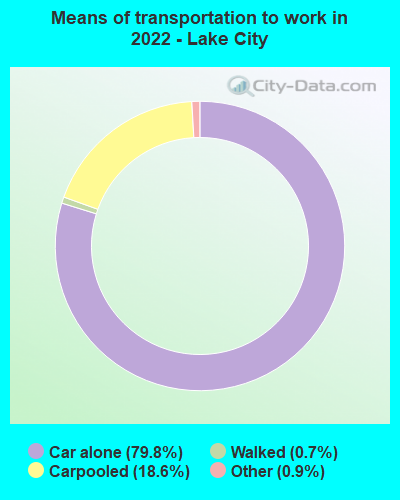
Means of transportation to work:
- Drove a car alone: 2,307 (75.7%)
- Carpooled: 565 (18.5%)
- Taxi: 29 (1.0%)
- Walked: 18 (0.6%)
- Worked at home: 56 (1.8%)
- Unemployment by race in 2022
- Unemployment rate for Black residents
- 15.8%Males
- 11.5%Females
- Unemployment rate for Hispanic or Latino residents
- 100.0%Males
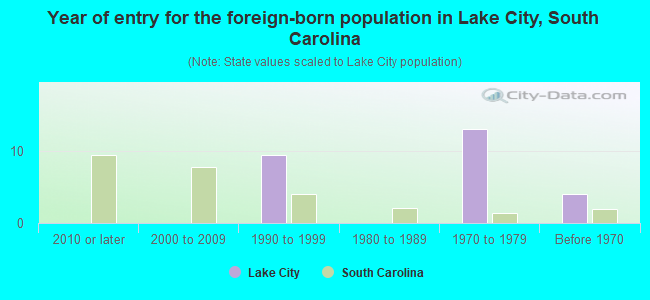
- Year of entry for the foreign-born population in Lake City, South Carolina
- 02010 or later
- 02000 to 2009
- 91990 to 1999
- 01980 to 1989
- 131970 to 1979
- 4Before 1970
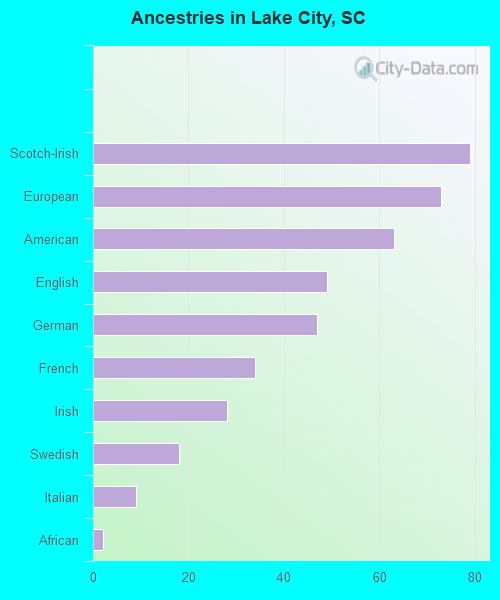
First ancestries reported:
- Scotch-Irish: 79 (1.8%)
- European: 73 (1.7%)
- American: 63 (1.4%)
- English: 49 (1.1%)
- German: 47 (1.1%)
- French: 34 (0.8%)
- Irish: 28 (0.6%)
- Swedish: 18 (0.4%)
- Italian: 9 (0.2%)
- African: 2 (0.05%)
Most common places of birth for foreign-born residents (%):
| Lake City: | 59.4% (19) |
| South Carolina: | 22.5% (60,774) |
| Lake City: | 43.8% (14) |
| South Carolina: | 0.5% (1,444) |
Place of birth for U.S.-born residents:
- This state: 4,948
- Other state: 1,039
- Northeast: 640
- Midwest: 43
- South: 253
- West: 49
90.7% of Lake City residents lived in the same house 1 years ago.
Out of people who lived in different houses, 22.3% lived in this county.
Out of people who lived in different counties, 41.9% lived in South Carolina.
| Lake City: | 90.7% |
| State average: | 86.5% |
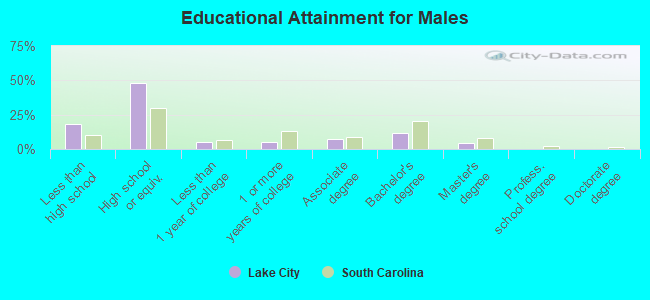
Education attainment for males 25 years and older:
- No schooling: 128
- Nursery to 4th grade: 0
- 5th and 6th grade: 0
- 7th and 8th grade: 2
- 9th grade: 0
- 10th grade: 103
- 11th grade: 53
- 12th grade, no diploma: 0
- High school graduate (or equivalency): 770
- Less than 1 year of college: 85
- Some college more than 1 year, no degree: 80
- Associate degree: 114
- Bachelor's degree: 188
- Master's degree: 72
- Professional school degree: 0
- Doctorate degree: 0
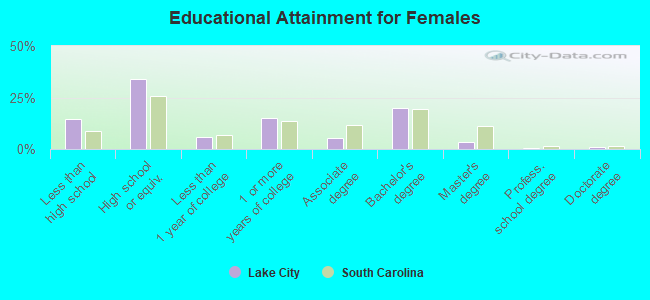
Education attainment for females 25 years and older:
- No schooling: 2
- Nursery to 4th grade: 0
- 5th and 6th grade: 0
- 7th and 8th grade: 34
- 9th grade: 124
- 10th grade: 38
- 11th grade: 169
- 12th grade, no diploma: 26
- High school graduate (or equivalency): 905
- Less than 1 year of college: 156
- Some college more than 1 year, no degree: 402
- Associate degree: 143
- Bachelor's degree: 524
- Master's degree: 94
- Professional school degree: 11
- Doctorate degree: 32
Housing units in structures:
- One, detached: 1,931
- One, attached: 30
- Two: 270
- 3 or 4: 170
- 5 to 9: 313
- 10 to 19: 34
- 20 to 49: 2
- Mobile homes: 179
Housing units lacking complete kitchen facilities in 2022: 3.0%
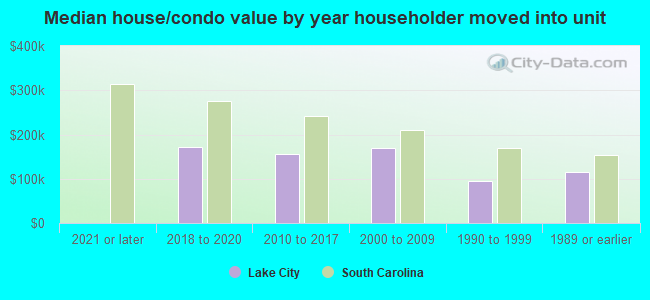
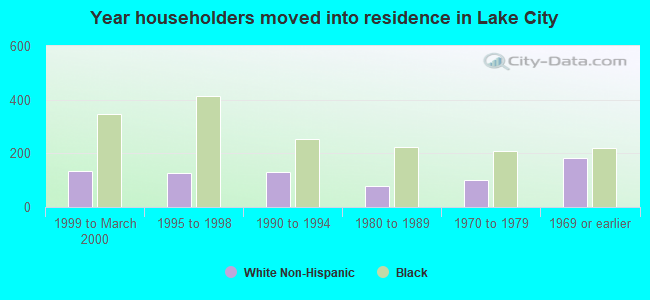
House/condo owner moved in on average 23 years ago
Renter moved in on average 5 years ago
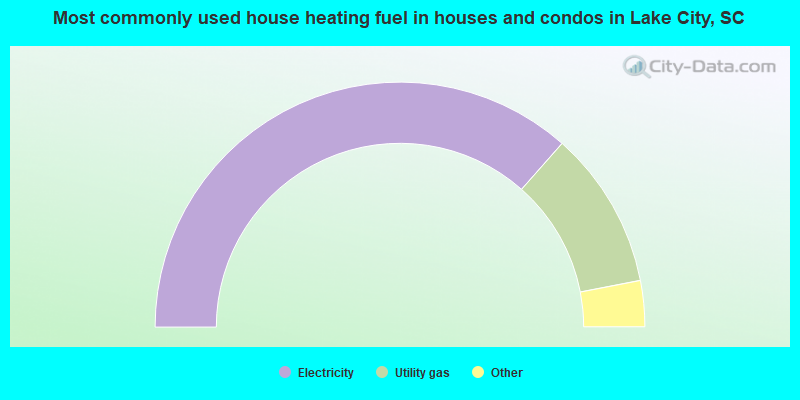
- 73.1%Electricity
- 20.9%Utility gas
- 3.6%Bottled, tank, or LP gas
- 2.3%Fuel oil, kerosene, etc.
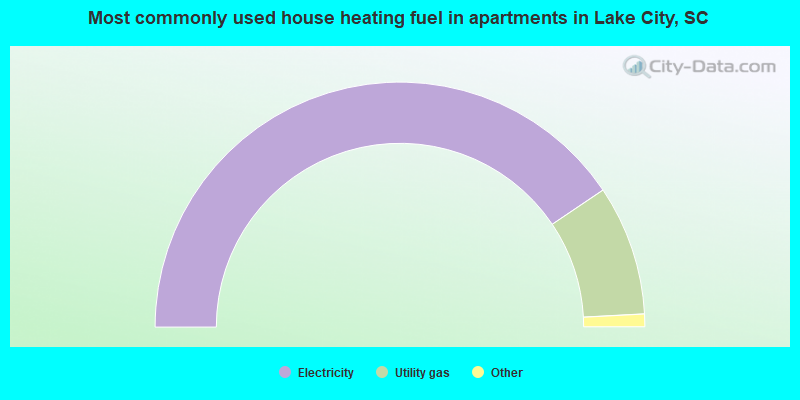
- 81.3%Electricity
- 17.2%Utility gas
- 1.0%Bottled, tank, or LP gas
- 0.6%No fuel used
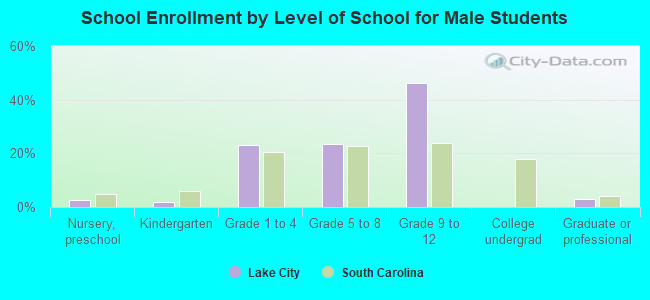
Private vs. public school enrollment:
| Here: | 5.1% |
| South Carolina: | 14.4% |
| Here: | 3.2% |
| South Carolina: | 11.1% |
| Here: | 0.0% |
| South Carolina: | 21.9% |