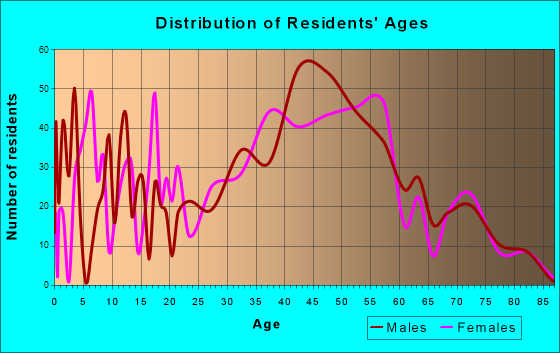
Lake Norman of Catawba, NC (North Carolina) Houses and Residents
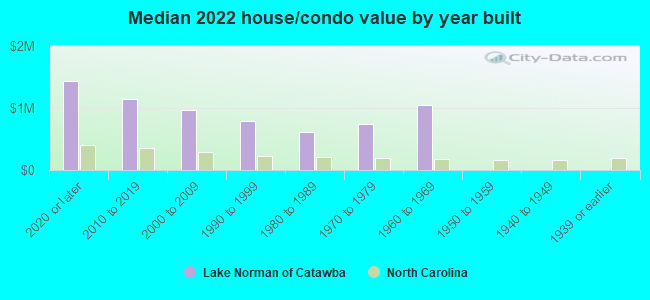
| Lake Norman of Catawba: | $946,823 |
| North Carolina: | $280,600 |
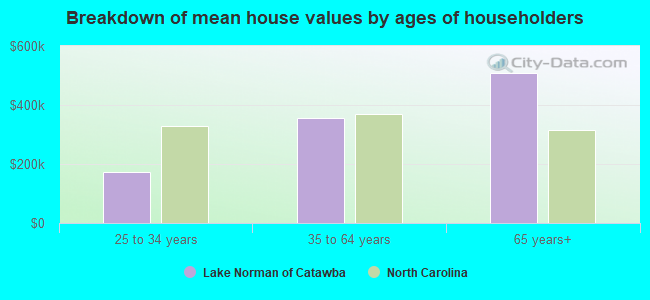
Mean price in 2022:
Detached houses: $1,061,379
Here: $1,061,379 State: $375,326 Townhouses or other attached units: $693,691
Here: $693,691 State: $317,935 Mobile homes: $318,519
Here: $318,519 State: $124,933
Total population: 7,411 (Urban population: 0, Rural population: 4,688 (all nonfarm))
Houses: 5,157 (4,471 occupied: 4,335 owner occupied, 217 renter occupied)
| % of renters here: | 5% |
| State: | 33% |
Housing density: 270 houses/condos per square mile
Median price asked for vacant for-sale houses and condos in 2022: $653,847.
Median contract rent in 2022: $1,226 (lower quartile is $1,067, upper quartile is $1,819)
Median rent asked for vacant for-rent units in 2022: $1,444
Median gross rent in Lake Norman of Catawba, NC in 2022: $1,195
Housing units in Lake Norman of Catawba with a mortgage: 3,427 (542 second mortgage, 24 home equity loan, 582 both second mortgage and home equity loan)
Houses without a mortgage: 49
Median household income for houses/condos with a mortgage: $186,365
Median household income for apartments without a mortgage: $106,128
Median monthly housing costs: $2,496
Compare current foreclosures near Lake Norman of Catawba, NC:
| Photo | Address | Area | Beds / Baths | Price | Details |
|---|---|---|---|---|---|

|
#1
Vance Rd N
Huntersville, NC 28078
|
1,696 sq. feet
|
2 baths 3 beds |
show details | |

|
#2
Big Forest Dr
Statesville, NC 28677
|
1,428 sq. feet
|
2 baths 3 beds |
show details | |

|
#3
Damson Dr
Huntersville, NC 28078
|
2,526 sq. feet
|
2 baths 4 beds |
show details | |

|
#4
N Carolina Ave
Maiden, NC 28650
|
1,883 sq. feet
|
3 baths 4 beds |
show details | |

|
#5
Eufola Rd
Statesville, NC 28677
|
792 sq. feet
|
1 baths 2 beds |
show details | |

|
#6
Wood St
Statesville, NC 28677
|
1,304 sq. feet
|
1 baths 3 beds |
show details | |

|
#7
Old Post Rd
Denver, NC 28037
|
2,336 sq. feet
|
3 baths 3 beds |
show details | |

|
#8
Quail Hill Dr
Mooresville, NC 28115
|
1,472 sq. feet
|
2 baths 3 beds |
show details | |

|
#9
Queens Ct
Statesville, NC 28677
|
1,570 sq. feet
|
2 baths 3 beds |
show details | |

|
#10
Henderson Rd Unit L
Cornelius, NC 28031
|
- sq. feet
|
2 baths 2 beds |
show details |
| Photo | Address | Area | Beds / Baths | Price | Details |
|---|---|---|---|---|---|

|
#11
Field Brook Ct
Newton, NC 28658
|
1,639 sq. feet
|
2 baths 3 beds |
show details | |

|
#12
Pebble Ln
Denver, NC 28037
|
2,038 sq. feet
|
2 baths 4 beds |
show details | |

|
#13
Wooten St
Catawba, NC 28609
|
912 sq. feet
|
1 baths 3 beds |
show details | |

|
#14
Kanawha Dr
Cornelius, NC 28031
|
2,552 sq. feet
|
2 baths 3 beds |
show details | |

|
#15
Dunnell Rd
Mooresville, NC 28115
|
2,566 sq. feet
|
2 baths 4 beds |
show details | |

|
#16
Rock Barn Rd NE
Conover, NC 28613
|
2,141 sq. feet
|
2 baths 3 beds |
show details | |

|
#17
Devon Forest Dr
Mooresville, NC 28115
|
1,679 sq. feet
|
2 baths 3 beds |
show details | |

|
#18
Verdie Dr
Claremont, NC 28610
|
1,008 sq. feet
|
1 baths 2 beds |
show details | |

|
#19
Chatham St
Newton, NC 28658
|
1,032 sq. feet
|
1 baths 3 beds |
show details | |

|
#20
Hope St
Statesville, NC 28677
|
832 sq. feet
|
1 baths 2 beds |
show details |
| Photo | Address | Area | Beds / Baths | Price | Details |
|---|---|---|---|---|---|

|
#21
Whispering Pnes
Lincolnton, NC 28092
|
2,207 sq. feet
|
2 baths 4 beds |
show details | |

|
#22
Dairy Farm Rd
Mooresville, NC 28115
|
3,590 sq. feet
|
2 baths 4 beds |
show details | |

|
#23
Skyuka Rd
Statesville, NC 28677
|
1,624 sq. feet
|
2 baths 3 beds |
show details | |

|
#24
N Oak St
Statesville, NC 28677
|
2,241 sq. feet
|
2 baths 3 beds |
show details | |

|
#25
Deal Rd
Claremont, NC 28610
|
1,504 sq. feet
|
2 baths 3 beds |
show details | |

|
#26
Bluff Meadow Trl
Huntersville, NC 28078
|
1,737 sq. feet
|
2 baths 3 beds |
show details | |

|
#27
Wall St
Statesville, NC 28677
|
1,203 sq. feet
|
1 baths 3 beds |
show details | |

|
#28
S 4th Ave
Maiden, NC 28650
|
1,094 sq. feet
|
2 baths 3 beds |
show details | |

|
#29
Brady Circle Rd
Statesville, NC 28625
|
1,408 sq. feet
|
2 baths 3 beds |
show details | |

|
#30
Kristens Court Dr
Mooresville, NC 28115
|
1,790 sq. feet
|
2 baths 3 beds |
show details |
| Photo | Address | Area | Beds / Baths | Price | Details |
|---|---|---|---|---|---|

|
#31
Island Ford Rd
Statesville, NC 28625
|
1,562 sq. feet
|
2 baths 2 beds |
show details | |

|
#32
Summerlin Pl
Newton, NC 28658
|
3,358 sq. feet
|
3 baths 3 beds |
show details | |

|
#33
N Sycamore St
Mooresville, NC 28115
|
1,504 sq. feet
|
1 baths 3 beds |
show details | |

|
#34
Brook Glen Dr
Mooresville, NC 28115
|
1,236 sq. feet
|
2 baths 3 beds |
show details | |

|
#35
Perry Rd
Troutman, NC 28166
|
1,168 sq. feet
|
2 baths 3 beds |
show details | |

|
#36
Glenwood Dr
Mooresville, NC 28115
|
744 sq. feet
|
1 baths 2 beds |
show details | |

|
#37
Farmfield Dr
Claremont, NC 28610
|
1,200 sq. feet
|
2 baths 3 beds |
show details | |

|
#38
Singletree Ln
Davidson, NC 28036
|
1,944 sq. feet
|
2 baths 3 beds |
show details | |

|
#39
Links Dr NE
Conover, NC 28613
|
4,540 sq. feet
|
4 baths 4 beds |
show details | |

|
#40
Tryon St
Cornelius, NC 28031
|
840 sq. feet
|
1 baths 2 beds |
show details |
| Photo | Address | Area | Beds / Baths | Price | Details |
|---|---|---|---|---|---|

|
#41
Manor Cir
Mooresville, NC 28115
|
1,361 sq. feet
|
2 baths 3 beds |
show details | |

|
#42
E Mcneely Ave
Mooresville, NC 28115
|
998 sq. feet
|
1 baths 2 beds |
show details | |

|
#43
Bost Nursery Rd
Maiden, NC 28650
|
2,036 sq. feet
|
2 baths 3 beds |
show details | |

|
#44
Rumple Hill Dr
Statesville, NC 28677
|
1,795 sq. feet
|
2 baths 3 beds |
show details | |

|
#45
Crestview Dr
Newton, NC 28658
|
1,380 sq. feet
|
1 baths 3 beds |
show details | |

|
#46
Clearbrook Ln
Iron Station, NC 28080
|
1,782 sq. feet
|
2 baths 3 beds |
show details | |

|
#47
Earnhardt Lake Rd
Davidson, NC 28036
|
1,056 sq. feet
|
1 baths 2 beds |
show details | |

|
#48
Clear Water Ln
Newton, NC 28658
|
1,248 sq. feet
|
2 baths 3 beds |
show details | |

|
#49
Clarendon Point Ct
Huntersville, NC 28078
|
4,369 sq. feet
|
3 baths 5 beds |
show details | |

|
Check over 1 million property listings on Foreclosure.com!
|
browse all offers | |||


 | Higher end areas in NC with Land? (13 replies) |
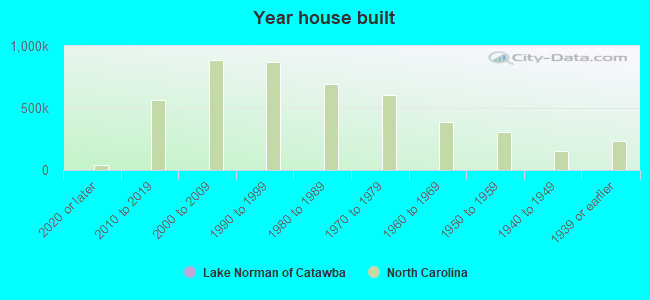
Median year apartment built: 1996
Household type by relationship:
Households: 12,716- Male householders: 2,695 (300 living alone), Female householders: 1,734 (231 living alone)
3,582 spouses (3,571 opposite-sex spouses), 110 unmarried partners, (110 opposite-sex unmarried partners), 3,828 children (3,605 natural, 20 adopted, 203 stepchildren), 53 grandchildren, 103 brothers or sisters, 415 parents, 0 foster children, 41 other relatives, 151 non-relatives
Size of family households: 1,720 2-persons, 738 3-persons, 778 4-persons, 569 5-persons, 89 6-persons, 23 7-or-more-persons.
Size of nonfamily households: 533 1-person, 130 2-persons.
3,131 married couples with children.
56 single-parent households (0 men, 56 women).
91.8% of residents of Lake Norman of Catawba speak English at home.
3.8% of residents speak Spanish at home (78% speak English very well, 22% speak English well).
1.9% of residents speak other Indo-European language at home (81% speak English very well, 19% speak English well).
2.0% of residents speak Asian or Pacific Island language at home (59% speak English very well, 26% speak English well, 8% speak English not well, 8% don't speak English at all).
0.4% of residents speak other language at home (100% speak English very well).
Foreign born population: 935 (7.4%)
(85.5% of them are naturalized citizens)
| Here: | 10.0 |
| State: | 6.4 |
| Here: | 5.3 |
| State: | 4.4 |
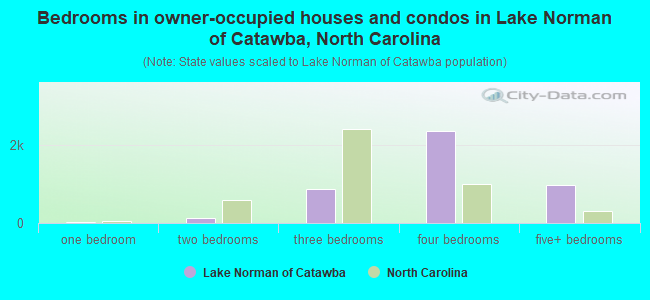
- Bedrooms in owner-occupied houses and condos in Lake Norman of Catawba, North Carolina
- 9no bedroom
- 341 bedroom
- 1352 bedrooms
- 8603 bedrooms
- 2,3354 bedrooms
- 9625+ bedrooms
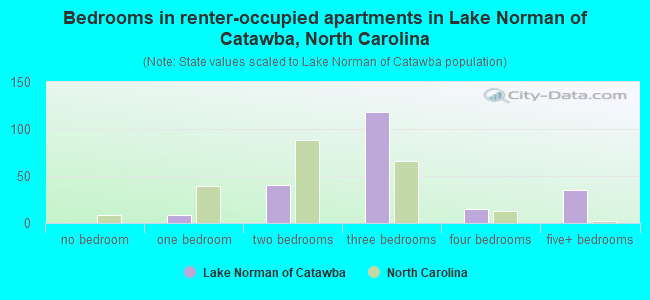
- Bedrooms in renter-occupied apartments in Lake Norman of Catawba, North Carolina
- 0no bedroom
- 91 bedroom
- 402 bedrooms
- 1183 bedrooms
- 154 bedrooms
- 355+ bedrooms
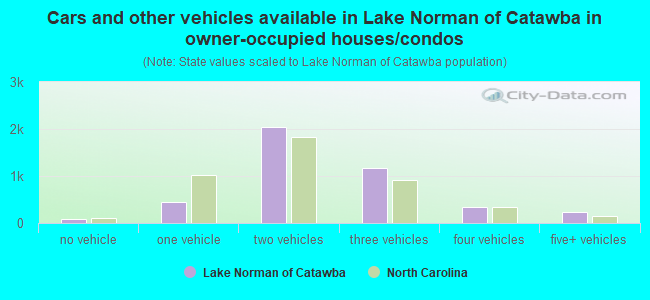
- Cars and other vehicles available in Lake Norman of Catawba in owner-occupied houses/condos
- 85no vehicle
- 4571 vehicle
- 2,0412 vehicles
- 1,1783 vehicles
- 3464 vehicles
- 2285+ vehicles
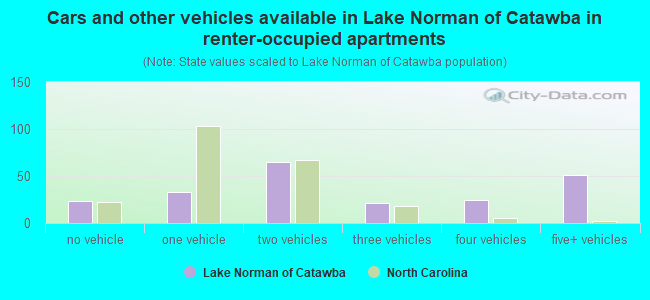
- Cars and other vehicles available in Lake Norman of Catawba in renter-occupied apartments
- 23no vehicle
- 331 vehicle
- 652 vehicles
- 213 vehicles
- 244 vehicles
- 515+ vehicles
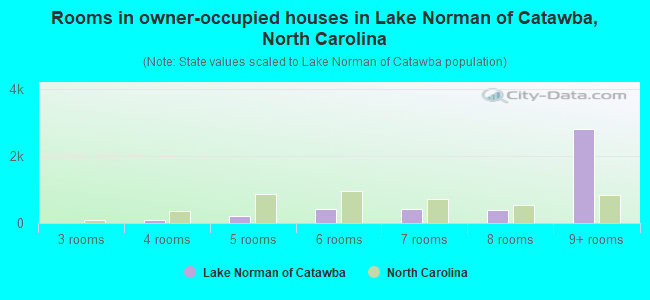
- Rooms in owner-occupied houses in Lake Norman of Catawba, North Carolina
- 91 room
- 02 rooms
- 93 rooms
- 774 rooms
- 2165 rooms
- 4256 rooms
- 4037 rooms
- 4008 rooms
- 2,7969+ rooms
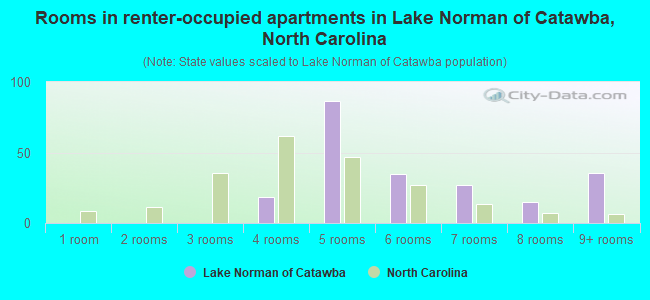
- Rooms in renter-occupied apartments in Lake Norman of Catawba, North Carolina
- 01 room
- 02 rooms
- 03 rooms
- 194 rooms
- 875 rooms
- 346 rooms
- 277 rooms
- 158 rooms
- 359+ rooms
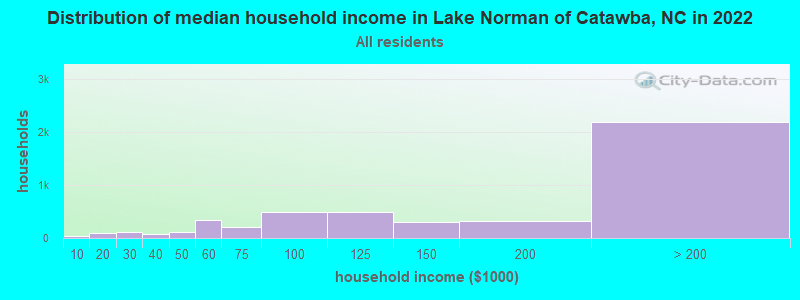
Lake Norman of Catawba, NC household income distribution

- 44Less than $10,000
- 85$10,000 to $19,999
- 108$20,000 to $29,999
- 72$30,000 to $39,999
- 105$40,000 to $49,999
- 334$50,000 to $59,999
- 203$60,000 to $74,999
- 484$75,000 to $99,999
- 481$100,000 to $124,999
- 296$125,000 to $149,999
- 318$150,000 to $199,999
- 2,187$200,000 or more
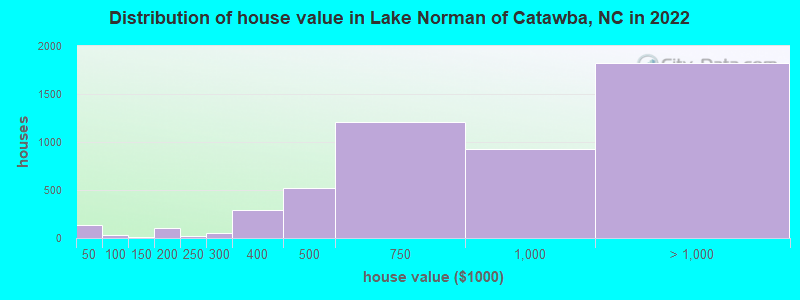
Home value of owner - occupied houses in 2022 in Lake Norman of Catawba, NC
-
- 127Less than $10,000
- 6$40,000 to $49,999
- 12$80,000 to $89,999
- 8$90,000 to $99,999
- 12$100,000 to $124,999
- 72$150,000 to $174,999
- 28$175,000 to $199,999
- 21$200,000 to $249,999
- 49$250,000 to $299,999
- 296$300,000 to $399,999
- 515$400,000 to $499,999
- 1,211$500,000 to $749,999
- 930$750,000 to $999,999
- 827$1,000,000 to $1,499,999
- 372$1,500,000 to $1,999,999
- 622$2,000,000 or more
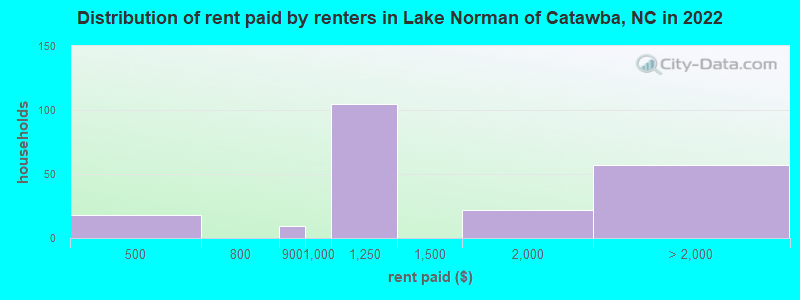
Rent paid by renters in 2022 in Lake Norman of Catawba, NC
-
- 13$400 to $449
- 4$450 to $499
- 8$800 to $899
- 105$1,000 to $1,249
- 21$1,500 to $1,999
- 14$2,000 to $2,499
- 19$2,500 to $2,999
- 14$3,000 to $3,499
- 8$3,500 or more
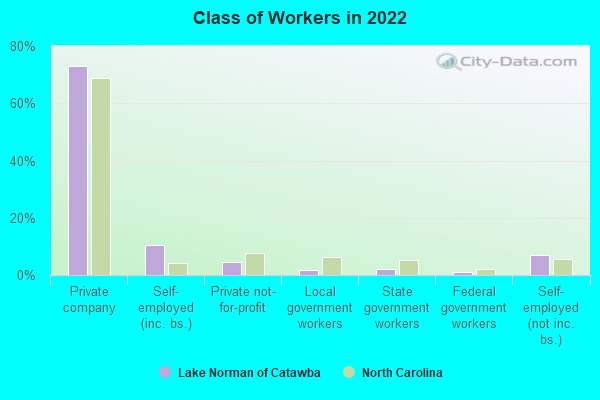
Percentage of workers working in this county: 60.3%
Number of people working at home: 2,247 (36.9% of all workers)
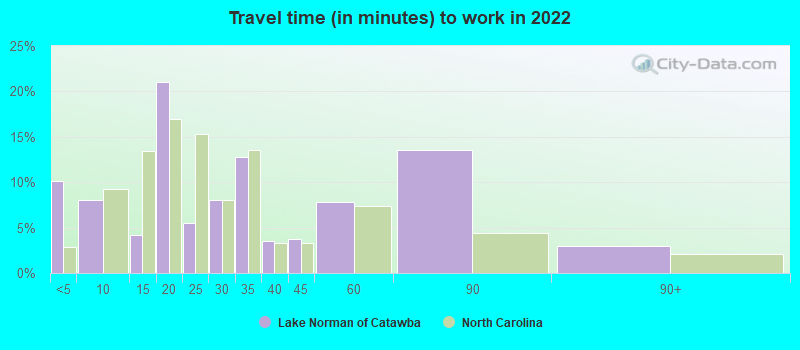
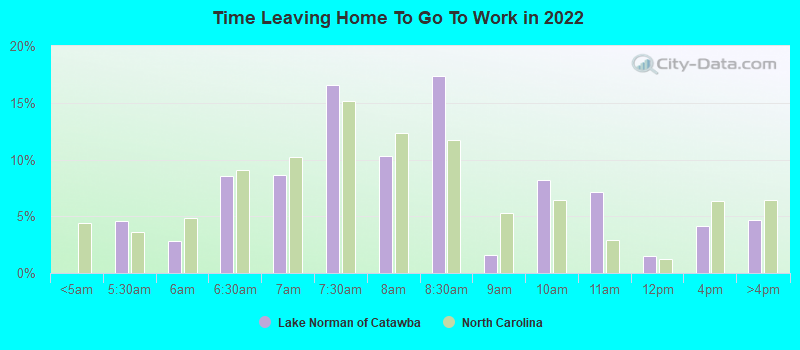
Travel time to work (commute)
- Less than 5 minutes: 103
- 5 to 9 minutes: 238
- 10 to 14 minutes: 428
- 15 to 19 minutes: 720
- 20 to 24 minutes: 511
- 25 to 29 minutes: 188
- 30 to 34 minutes: 464
- 35 to 39 minutes: 299
- 40 to 44 minutes: 212
- 45 to 59 minutes: 657
- 60 to 89 minutes: 339
- 90 or more minutes: 176
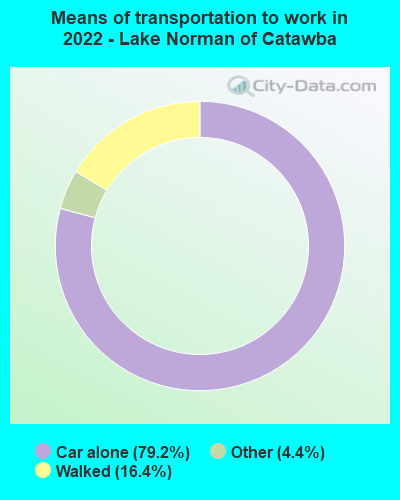
Means of transportation to work:
- Drove a car alone: 442 (19.7%)
- Taxi: 25 (1.1%)
- Walked: 98 (4.4%)
- Worked at home: 2,247 (100.0%)
- Unemployment by race in 2022
- Unemployment rate for White non-Hispanic residents
- 1.6%Males
- 0.9%Females
- Unemployment rate for two or more race residents
- 6.8%Males
- 14.1%Females
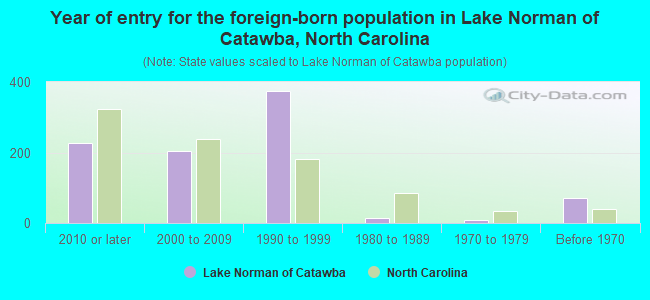
- Year of entry for the foreign-born population in Lake Norman of Catawba, North Carolina
- 2282010 or later
- 2042000 to 2009
- 3751990 to 1999
- 151980 to 1989
- 81970 to 1979
- 71Before 1970
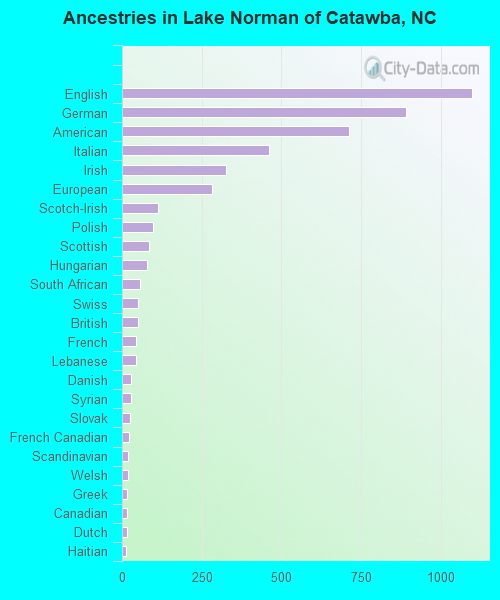
First ancestries reported:
- English: 1,096 (19.3%)
- German: 891 (15.7%)
- American: 712 (12.6%)
- Italian: 462 (8.2%)
- Irish: 327 (5.8%)
- European: 283 (5.0%)
- Scotch-Irish: 112 (2.0%)
- Polish: 97 (1.7%)
- Scottish: 85 (1.5%)
- Hungarian: 79 (1.4%)
- South African: 57 (1.0%)
- Swiss: 51 (0.9%)
- British: 49 (0.9%)
- French: 44 (0.8%)
- Lebanese: 43 (0.8%)
- Danish: 29 (0.5%)
- Syrian: 28 (0.5%)
- Slovak: 25 (0.4%)
- French Canadian: 22 (0.4%)
- Scandinavian: 20 (0.4%)
- Welsh: 18 (0.3%)
- Greek: 17 (0.3%)
- Canadian: 16 (0.3%)
- Dutch: 15 (0.3%)
- Haitian: 14 (0.2%)
- Swedish: 11 (0.2%)
- Brazilian: 10 (0.2%)
- Russian: 10 (0.2%)
- Austrian: 7 (0.1%)
- Portuguese: 6 (0.1%)
Most common places of birth for foreign-born residents (%):
| Lake Norman of Catawba: | 13.0% (122) |
| North Carolina: | 0.5% (4,673) |
| Lake Norman of Catawba: | 12.8% (121) |
| North Carolina: | 4.7% (40,707) |
| Lake Norman of Catawba: | 9.3% (88) |
| North Carolina: | 1.0% (8,426) |
| Lake Norman of Catawba: | 8.5% (80) |
| North Carolina: | 3.2% (27,477) |
| Lake Norman of Catawba: | 6.9% (65) |
| North Carolina: | 2.1% (18,275) |
| Lake Norman of Catawba: | 5.2% (49) |
| North Carolina: | 2.1% (18,105) |
| Lake Norman of Catawba: | 5.0% (47) |
| North Carolina: | 1.1% (9,831) |
| Lake Norman of Catawba: | 4.9% (46) |
| North Carolina: | 24.7% (214,776) |
| Lake Norman of Catawba: | 3.8% (36) |
| North Carolina: | 1.8% (15,988) |
| Lake Norman of Catawba: | 3.6% (34) |
| North Carolina: | 1.8% (15,534) |
| Lake Norman of Catawba: | 3.6% (34) |
| North Carolina: | 0.1% (922) |
| Lake Norman of Catawba: | 3.5% (33) |
| North Carolina: | 0.7% (6,091) |
| Lake Norman of Catawba: | 2.9% (27) |
| North Carolina: | 0.2% (1,332) |
| Lake Norman of Catawba: | 1.6% (15) |
| North Carolina: | 0.3% (2,183) |
Place of birth for U.S.-born residents:
- This state: 3,041
- Other state: 8,988
- Northeast: 4,096
- Midwest: 2,957
- South: 1,414
- West: 715
86.6% of Lake Norman of Catawba residents lived in the same house 1 years ago.
Out of people who lived in different houses, 15.9% lived in this county.
Out of people who lived in different counties, 19.4% lived in North Carolina.
| Lake Norman of Catawba: | 86.6% |
| State average: | 87.3% |
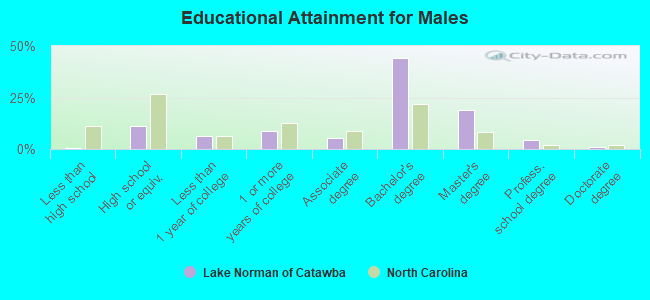
Education attainment for males 25 years and older:
- No schooling: 0
- Nursery to 4th grade: 0
- 5th and 6th grade: 0
- 7th and 8th grade: 0
- 9th grade: 0
- 10th grade: 0
- 11th grade: 8
- 12th grade, no diploma: 6
- High school graduate (or equivalency): 521
- Less than 1 year of college: 287
- Some college more than 1 year, no degree: 399
- Associate degree: 255
- Bachelor's degree: 2,068
- Master's degree: 875
- Professional school degree: 196
- Doctorate degree: 55
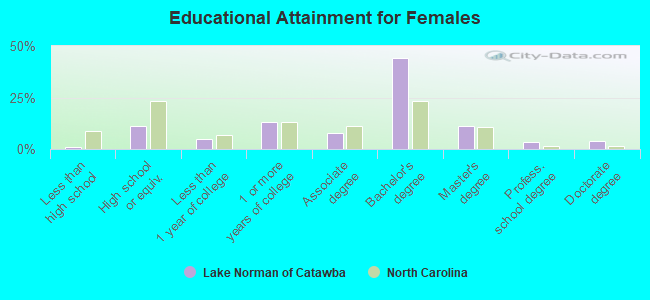
Education attainment for females 25 years and older:
- No schooling: 0
- Nursery to 4th grade: 0
- 5th and 6th grade: 9
- 7th and 8th grade: 0
- 9th grade: 14
- 10th grade: 7
- 11th grade: 0
- 12th grade, no diploma: 11
- High school graduate (or equivalency): 502
- Less than 1 year of college: 216
- Some college more than 1 year, no degree: 599
- Associate degree: 352
- Bachelor's degree: 2,028
- Master's degree: 517
- Professional school degree: 147
- Doctorate degree: 178
Housing units in structures:
- One, detached: 4,915
- One, attached: 50
- Two: 26
- 3 or 4: 21
- Mobile homes: 143
Median worth of mobile homes: $204,375
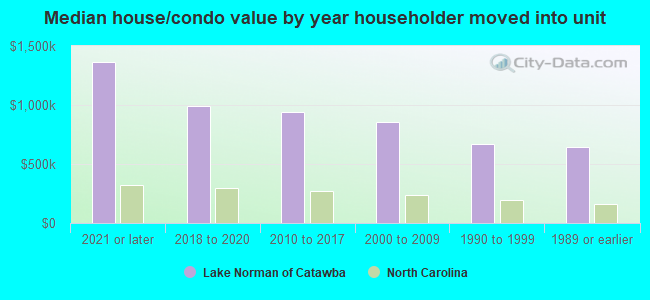
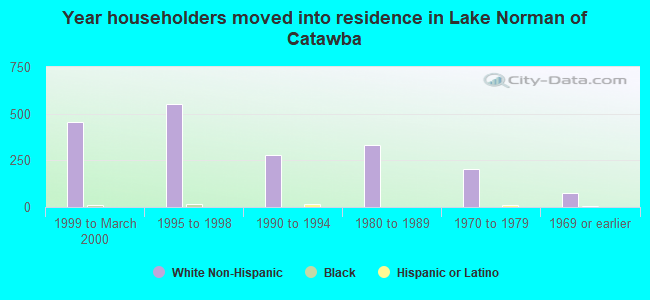
House/condo owner moved in on average 6 years ago
Renter moved in on average 7 years ago
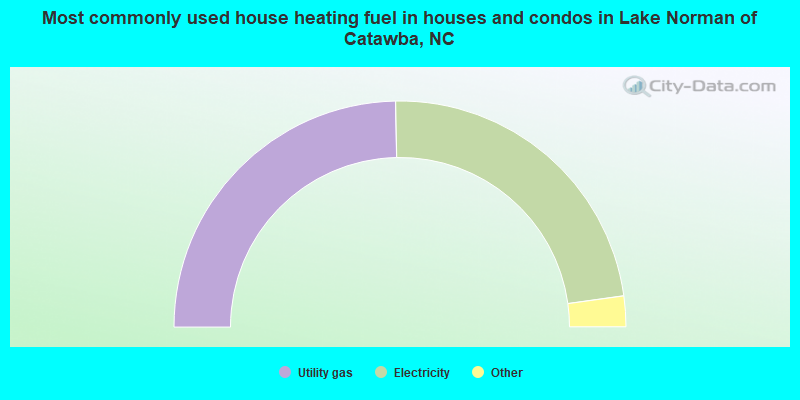
- 49.4%Utility gas
- 46.2%Electricity
- 3.6%Bottled, tank, or LP gas
- 0.7%Other fuel
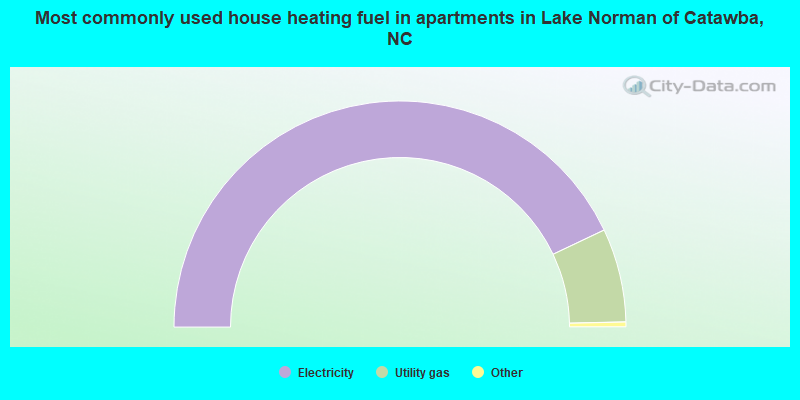
- 86.5%Electricity
- 13.5%Utility gas
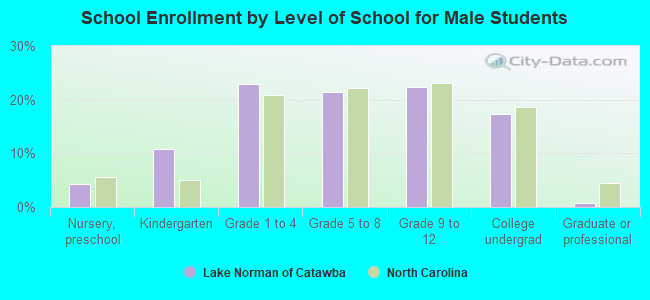
Private vs. public school enrollment:
| Here: | 11.9% |
| North Carolina: | 13.8% |
| Here: | 18.8% |
| North Carolina: | 11.9% |
| Here: | 11.3% |
| North Carolina: | 19.3% |