Lakeland South, WA (Washington) Houses and Residents
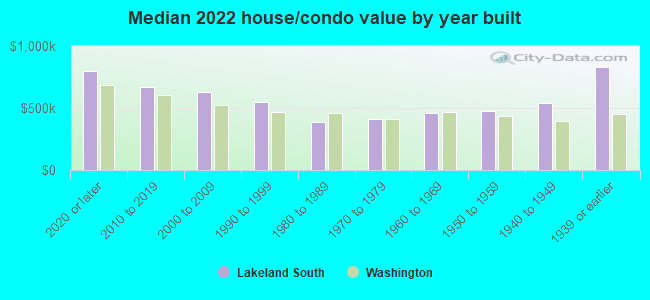
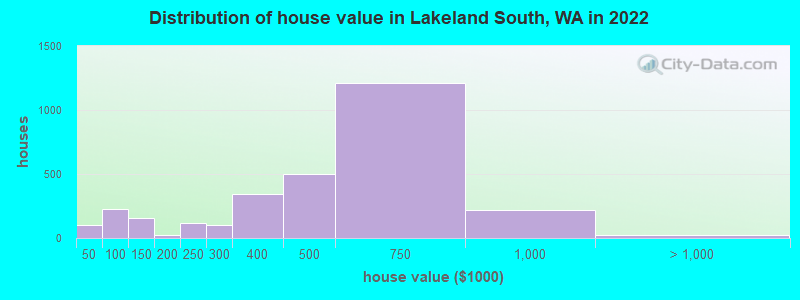
Estimated median house or condo value in 2022: $520,830 (it was $164,500 in 2000 )
Lakeland South:
$520,830Washington:
$569,500
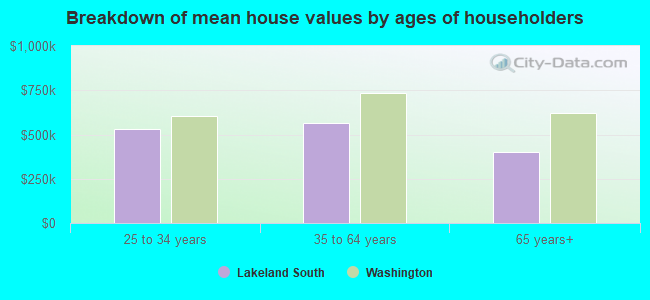
Lower value quartile - upper value quartile: $374,585 - $707,729Mean price in 2022: Detached houses: $564,900 Here:
$564,900State:
$734,307
Mobile homes: $186,010 Here:
$186,010State:
$218,362
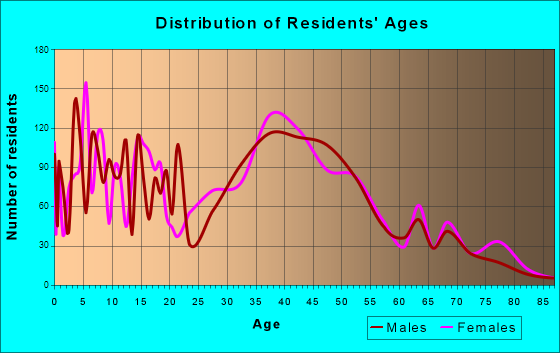
Total population: 11,574 (Urban population: 11,499, Rural population: 0)
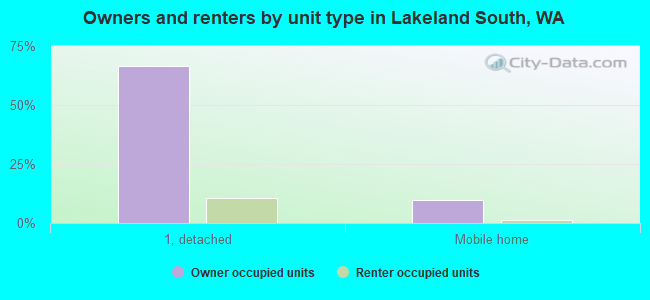
Houses: 4,687 (4,578 occupied: 3,660 owner occupied, 911 renter occupied )
% of renters here:
20%State:
36%
Housing density: 866 houses/condos per square mile
Median price asked for vacant for-sale houses and condos in 2022: $1,776,268.
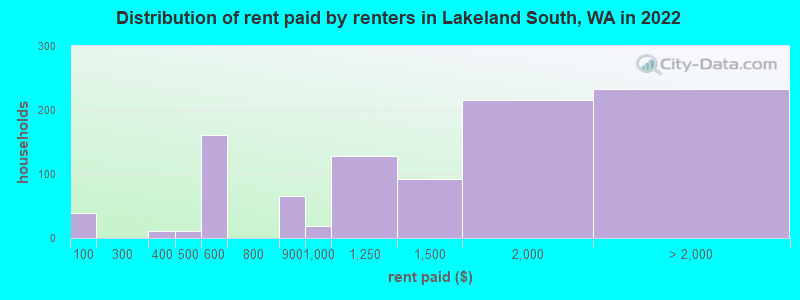
Median contract rent in 2022: $1,392 (lower quartile is $848, upper quartile is $1,932)
Median rent asked for vacant for-rent units in 2022: $1,645
Median gross rent in Lakeland South, WA in 2022: $1,595
Housing units in Lakeland South with a mortgage: 2,449 (240 second mortgage, 77 home equity loan, 161 both second mortgage and home equity loan )Houses without a mortgage: 13
Median household income for houses/condos with a mortgage: $136,219
Median household income for apartments without a mortgage: $85,671
Median monthly housing costs: $1,801
Data:
Median house or condo value ($)
Median house or condo value ($ change since 2000)
Median house or condo value ($) - White
Median house or condo value ($) - Black or African American
Median house or condo value ($) - Asian
Median house or condo value ($) - Hispanic or Latino
Median house or condo value ($) - American Indian and Alaska Native
Median house or condo value ($) - Multirace
Median house or condo value ($) - Other Race
Median price asked for mobile homes ($)
Household density (households per square mile)
Mean house or condo value by units in structure - 1, detached ($)
Mean house or condo value by units in structure - 1, attached ($)
Mean house or condo value by units in structure - 2 ($)
Mean house or condo value by units in structure by units in structure - 3 or 4 ($)
Mean house or condo value by units in structure - 5 or more ($)
Mean house or condo value by units in structure - Boat, RV, van, etc. ($)
Mean house or condo value by units in structure - Mobile home ($)
Median contract rent ($)
Median contract rent - Lower quartile ($)
Median contract rent - Upper quartile ($)
Median gross rent ($)
Urban houses (%)
Rural houses (%)
Houses occupied (%)
Houses occupied (% change since 2000)
Houses owner occupied (%)
Houses owner occupied (% change since 2000)
Houses renter occupied (%)
Houses renter occupied (% change since 2000)
Vacant housing units - For rent (%)
Vacant housing units - For rent (% change since 2000)
Vacant housing units - For sale only (%)
Vacant housing units - For sale only (% change since 2000)
Vacant housing units - Rented or sold, not occupied (%)
Vacant housing units - Rented or sold, not occupied (% change since 2000)
Vacant housing units - For seasonal, recreational, or occasional use (%)
Vacant housing units - For seasonal, recreational, or occasional use (% change since 2000)
Vacant housing units - For migrant workers (%)
Vacant housing units - For migrant workers (% change since 2000)
Vacant housing units - Other vacant (%)
Vacant housing units - Other vacant (% change since 2000)
Median monthly housing costs ($)
Median household income for houses/condos with a mortgage ($)
Median household income for houses/condos without a mortgage ($)
Median household income ($)
Median household income ($) - White
Median household income ($) - Black or African American
Median household income ($) - Asian
Median household income ($) - Hispanic or Latino
Median household income ($) - American Indian and Alaska Native
Median household income ($) - Multirace
Median household income ($) - Other Race
Mortgage status - with mortgage (%)
Mortgage status - with second mortgage (%)
Mortgage status - with home equity loan (%)
Mortgage status - with both second mortgage and home equity loan (%)
Mortgage status - without a mortgage (%)
Median year house/condo built
Median year apartment built
Household type by relationship - Male householder living alone (%)
Household type by relationship - Male householder not living alone (%)
Household type by relationship - Female householder living alone (%)
Household type by relationship - Female householder not living alone (%)
Household type by relationship - Opposite-Sex spouse (%)
Household type by relationship - Same-Sex spouse (%)
Household type by relationship - Opposite-Sex unmarried partner (%)
Household type by relationship - Same-Sex unmarried partner (%)
Household type by relationship - In group quarters (%)
Size of family households - 2-person household (%)
Size of family households - 3-person household (%)
Size of family households - 4-person household (%)
Size of family households - 5-person household (%)
Size of family households - 6-person household (%)
Size of family households - 7-or-more-person household (%)
Size of nonfamily households - 1-person household (%)
Size of nonfamily households - 2-person household (%)
Size of nonfamily households - 3-person household (%)
Size of nonfamily households - 4-person household (%)
Size of nonfamily households - 5-person household (%)
Size of nonfamily households - 6-person household (%)
Size of nonfamily households - 7-or-moreperson household (%)
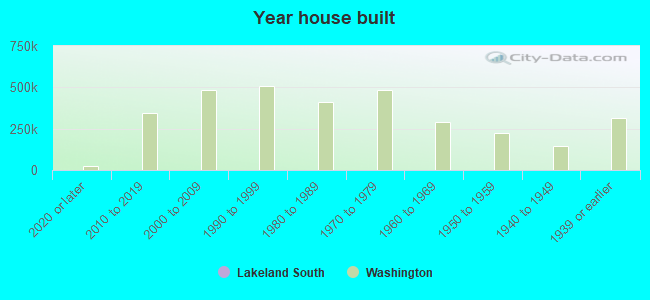
Year house built - Built 2010 or later (%)
Year house built - Built 2000 to 2009 (%)
Year house built - Built 1990 to 1999 (%)
Year house built - Built 1980 to 1989 (%)
Year house built - Built 1970 to 1979 (%)
Year house built - Built 1960 to 1969 (%)
Year house built - Built 1950 to 1959 (%)
Year house built - Built 1940 to 1949 (%)
Year house built - Built 1939 or earlier (%)
Median number of rooms in houses and condos
Median number of rooms in apartments
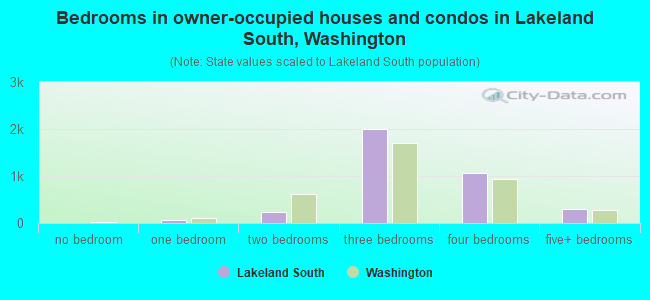
Median number of bedrooms in owner occupied houses
Mean number of bedrooms in owner occupied houses
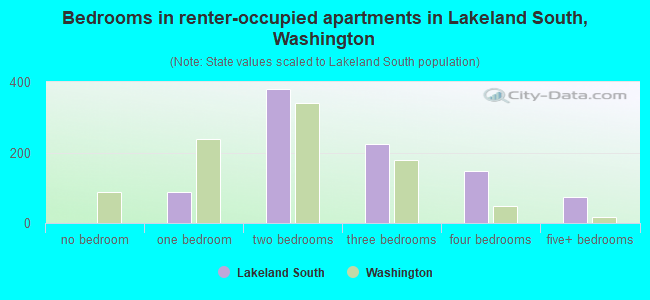
Median number of bedrooms in renter occupied houses
Mean number of bedrooms in renter occupied houses
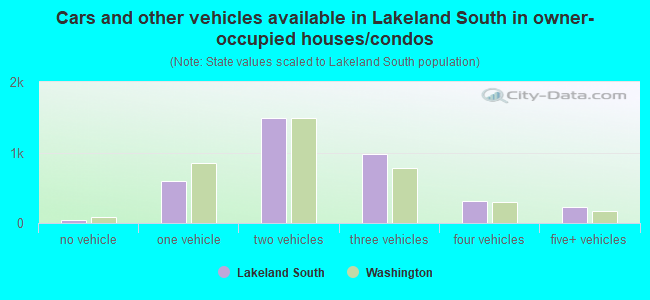
Median number of vehichles in owner occupied houses
Mean number of vehichles in owner occupied houses
Median number of vehichles in renter occupied houses
Mean number of vehichles in renter occupied houses
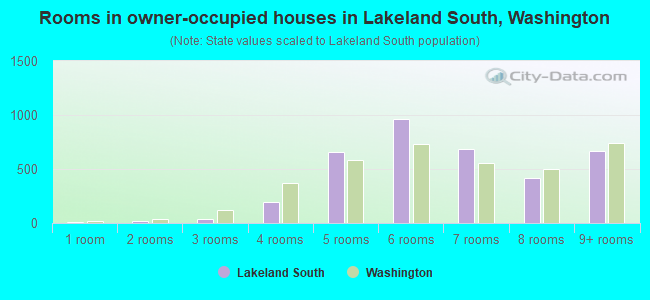
Rooms in owner-occupied houses - 1 room (%)
Rooms in owner-occupied houses - 2 rooms (%)
Rooms in owner-occupied houses - 3 rooms (%)
Rooms in owner-occupied houses - 4 rooms (%)
Rooms in owner-occupied houses - 5 rooms (%)
Rooms in owner-occupied houses - 6 rooms (%)
Rooms in owner-occupied houses - 7 rooms (%)
Rooms in owner-occupied houses - 8 rooms (%)
Rooms in owner-occupied houses - 9+ rooms (%)
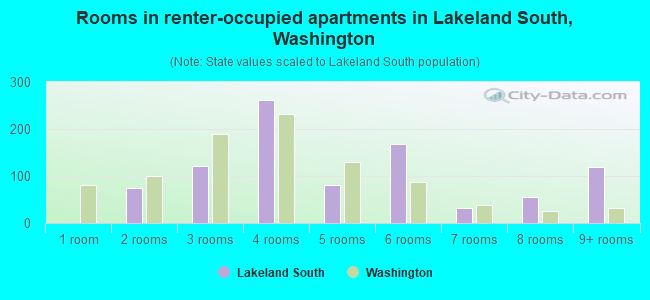
Rooms in renter-occupied houses - 1 room (%)
Rooms in renter-occupied houses - 2 rooms (%)
Rooms in renter-occupied houses - 3 rooms (%)
Rooms in renter-occupied houses - 4 rooms (%)
Rooms in renter-occupied houses - 5 rooms (%)
Rooms in renter-occupied houses - 6 rooms (%)
Rooms in renter-occupied houses - 7 rooms (%)
Rooms in renter-occupied houses - 8 rooms (%)
Rooms in renter-occupied houses - 9+ rooms (%)
Bedrooms in owner-occupied houses - no bedrooms (%)
Bedrooms in owner-occupied houses - 1 bedroom (%)
Bedrooms in owner-occupied houses - 2 bedrooms (%)
Bedrooms in owner-occupied houses - 3 bedrooms (%)
Bedrooms in owner-occupied houses - 4 bedrooms (%)
Bedrooms in owner-occupied houses - 5+ bedrooms (%)
Bedrooms in renter-occupied houses - no bedrooms (%)
Bedrooms in renter-occupied houses - 1 bedroom (%)
Bedrooms in renter-occupied houses - 2 bedrooms (%)
Bedrooms in renter-occupied houses - 3 bedrooms (%)
Bedrooms in renter-occupied houses - 4 bedrooms (%)
Bedrooms in renter-occupied houses - 5+ bedrooms (%)
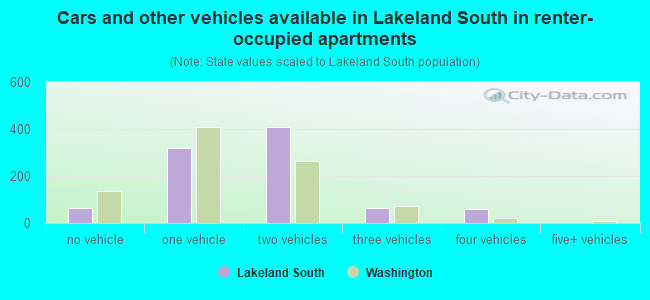
Vehicles available in owner-occupied houses - no vehicle available (%)
Vehicles available in owner-occupied houses - 1 vehicle available(%)
Vehicles available in owner-occupied houses - 2 Vehicles available (%)
Vehicles available in owner-occupied houses - 3 Vehicles available (%)
Vehicles available in owner-occupied houses - 4 Vehicles available (%)
Vehicles available in owner-occupied houses - 5+ Vehicles available (%)
Vehicles available in renter-occupied houses - no vehicle available (%)
Vehicles available in renter-occupied houses - 1 vehicle available (%)
Vehicles available in renter-occupied houses - 2 Vehicles available (%)
Vehicles available in renter-occupied houses - 3 Vehicles available (%)
Vehicles available in renter-occupied houses - 4 Vehicles available (%)
Vehicles available in renter-occupied houses - 5+ Vehicles available (%)
Housing units in structures - 1, detached (%)
Housing units in structures - 1, attached (%)
Housing units in structures - 2 (%)
Housing units in structures - 3 or 4 (%)
Housing units in structures - 5 to 9 (%)
Housing units in structures - 10 to 19 (%)
Housing units in structures - 20 to 49 (%)
Housing units in structures - 50 or more (%)
Housing units in structures - Mobile home (%)
Housing units in structures - Boat, RV, van, etc. (%)
Housing units in structures - Owners - 1, detached (%)
Housing units in structures - Owners - 1, attached (%)
Housing units in structures - Owners - 2 (%)
Housing units in structures - Owners - 3 or 4 (%)
Housing units in structures - Owners - 5 to 9 (%)
Housing units in structures - Owners - 10 to 19 (%)
Housing units in structures - Owners - 20 to 49 (%)
Housing units in structures - Owners - 50 or more (%)
Housing units in structures - Owners - Mobile home (%)
Housing units in structures - Owners - Boat, RV, van, etc. (%)
Housing units in structures - Renters - 1, detached (%)
Housing units in structures - Renters - 1, attached (%)
Housing units in structures - Renters - 2 (%)
Housing units in structures - Renters - 3 or 4 (%)
Housing units in structures - Renters - 5 to 9 (%)
Housing units in structures - Renters - 10 to 19 (%)
Housing units in structures - Renters - 20 to 49 (%)
Housing units in structures - Renters - 50 or more (%)
Housing units in structures - Renters - Mobile home (%)
Housing units in structures - Renters - Boat, RV, van, etc. (%)
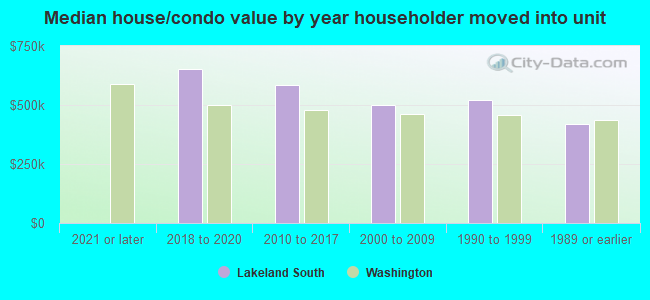
House/condo owner moved in on average (years ago)
Renter moved in on average (years ago)
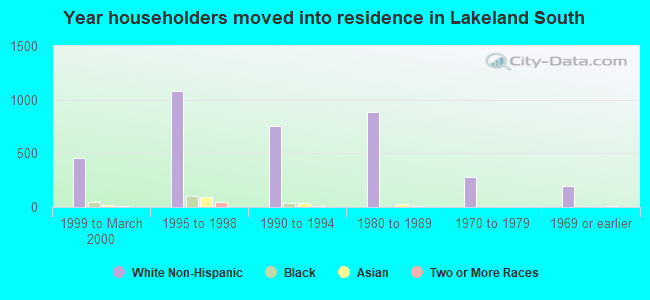
Year householder moved into unit - Moved in 1999 to March 2000 (%)
Year householder moved into unit - Moved in 1999 to March 2000 (%) - White
Year householder moved into unit - Moved in 1999 to March 2000 (%) - Black or African American
Year householder moved into unit - Moved in 1999 to March 2000 (%) - Asian
Year householder moved into unit - Moved in 1999 to March 2000 (%) - Hispanic or Latino
Year householder moved into unit - Moved in 1999 to March 2000 (%) - American Indian and Alaska Native
Year householder moved into unit - Moved in 1999 to March 2000 (%) - Multirace
Year householder moved into unit - Moved in 1999 to March 2000 (%) - Other Race
Year householder moved into unit - Moved in 1995 to 1998 (%)
Year householder moved into unit - Moved in 1995 to 1998 (%) - White
Year householder moved into unit - Moved in 1995 to 1998 (%) - Black or African American
Year householder moved into unit - Moved in 1995 to 1998 (%) - Asian
Year householder moved into unit - Moved in 1995 to 1998 (%) - Hispanic or Latino
Year householder moved into unit - Moved in 1995 to 1998 (%) - American Indian and Alaska Native
Year householder moved into unit - Moved in 1995 to 1998 (%) - Multirace
Year householder moved into unit - Moved in 1995 to 1998 (%) - Other Race
Year householder moved into unit - Moved in 1990 to 1994 (%)
Year householder moved into unit - Moved in 1990 to 1994 (%) - White
Year householder moved into unit - Moved in 1990 to 1994 (%) - Black or African American
Year householder moved into unit - Moved in 1990 to 1994 (%) - Asian
Year householder moved into unit - Moved in 1990 to 1994 (%) - Hispanic or Latino
Year householder moved into unit - Moved in 1990 to 1994 (%) - American Indian and Alaska Native
Year householder moved into unit - Moved in 1990 to 1994 (%) - Multirace
Year householder moved into unit - Moved in 1990 to 1994 (%) - Other Race
Year householder moved into unit - Moved in 1980 to 1989 (%)
Year householder moved into unit - Moved in 1980 to 1989 (%) - White
Year householder moved into unit - Moved in 1980 to 1989 (%) - Black or African American
Year householder moved into unit - Moved in 1980 to 1989 (%) - Asian
Year householder moved into unit - Moved in 1980 to 1989 (%) - Hispanic or Latino
Year householder moved into unit - Moved in 1980 to 1989 (%) - American Indian and Alaska Native
Year householder moved into unit - Moved in 1980 to 1989 (%) - Multirace
Year householder moved into unit - Moved in 1980 to 1989 (%) - Other Race
Year householder moved into unit - Moved in 1970 to 1979 (%)
Year householder moved into unit - Moved in 1970 to 1979 (%) - White
Year householder moved into unit - Moved in 1970 to 1979 (%) - Black or African American
Year householder moved into unit - Moved in 1970 to 1979 (%) - Asian
Year householder moved into unit - Moved in 1970 to 1979 (%) - Hispanic or Latino
Year householder moved into unit - Moved in 1970 to 1979 (%) - American Indian and Alaska Native
Year householder moved into unit - Moved in 1970 to 1979 (%) - Multirace
Year householder moved into unit - Moved in 1970 to 1979 (%) - Other Race
Year householder moved into unit - Moved in 1969 or earlier (%)
Year householder moved into unit - Moved in 1969 or earlier (%) - White
Year householder moved into unit - Moved in 1969 or earlier (%) - Black or African American
Year householder moved into unit - Moved in 1969 or earlier (%) - Asian
Year householder moved into unit - Moved in 1969 or earlier (%) - Hispanic or Latino
Year householder moved into unit - Moved in 1969 or earlier (%) - American Indian and Alaska Native
Year householder moved into unit - Moved in 1969 or earlier (%) - Multirace
Year householder moved into unit - Moved in 1969 or earlier (%) - Other Race
Housing units lacking complete plumbing facilities (%)
Housing units lacking complete kitchen facilities (%)
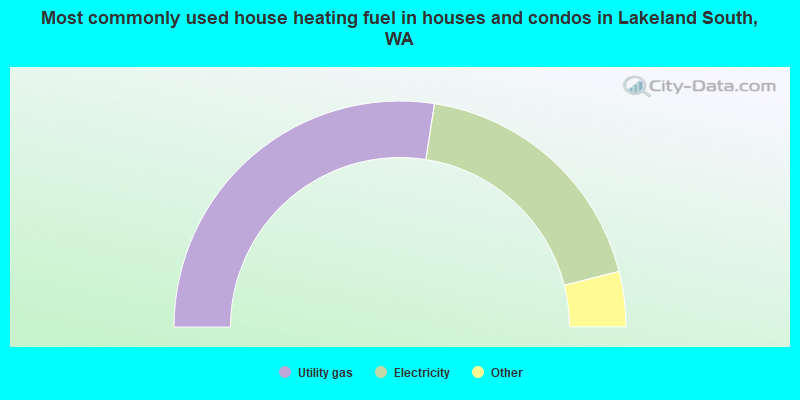
House heating fuel used in houses and condos - Utility gas (%)
House heating fuel used in houses and condos - Bottled, tank, or LP gas (%)
House heating fuel used in houses and condos - Electricity (%)
House heating fuel used in houses and condos - Fuel oil, kerosene, etc. (%)
House heating fuel used in houses and condos - Coal or coke (%)
House heating fuel used in houses and condos - Wood (%)
House heating fuel used in houses and condos - Solar energy (%)
House heating fuel used in houses and condos - Other fuel (%)
House heating fuel used in houses and condos - No fuel used (%)
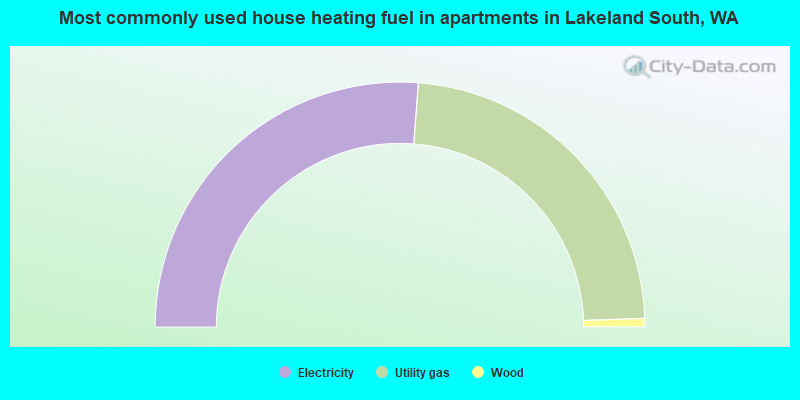
House heating fuel used in apartments - Utility gas (%)
House heating fuel used in apartments - Bottled, tank, or LP gas (%)
House heating fuel used in apartments - Electricity (%)
House heating fuel used in apartments - Fuel oil, kerosene, etc. (%)
House heating fuel used in apartments - Coal or coke (%)
House heating fuel used in apartments - Wood (%)
House heating fuel used in apartments - Solar energy (%)
House heating fuel used in apartments - Other fuel (%)
House heating fuel used in apartments - No fuel used (%)
Median year house/condo built: 1985Median year apartment built: 1995Household type by relationship:
Households: 12,675
Male householders: 2,579 (538 living alone ), Female householders: 1,878 (308 living alone )2,706 spouses (2,658 opposite-sex spouses ), 484 unmarried partners , (472 opposite-sex unmarried partners ), 3,842 children (3,310 natural , 334 adopted , 197 stepchildren ), 403 grandchildren , 44 brothers or sisters , 224 parents , 0 foster children , 174 other relatives , 310 non-relatives In group quarters: 27
Size of family households: 1,330 2-persons , 693 3-persons , 694 4-persons , 250 5-persons , 36 6-persons , 164 7-or-more-persons .
Size of nonfamily households: 911 1-person , 439 2-persons .
1,656 married couples with children. single-parent households (136 men , 406 women ).
74.1% of residents of Lakeland South speak English at home. of residents speak Spanish at home (72% speak English very well , 11% speak English well , 9% speak English not well , 8% don't speak English at all ).of residents speak other Indo-European language at home (61% speak English very well , 33% speak English well , 5% speak English not well , 1% don't speak English at all ).of residents speak Asian or Pacific Island language at home (58% speak English very well , 32% speak English well , 9% speak English not well ).of residents speak other language at home (60% speak English very well , 40% speak English well ).
Foreign born population: 2,474 (19.5%)of them are naturalized citizens )
Median number of rooms in houses and condos:
Median number of rooms in apartments
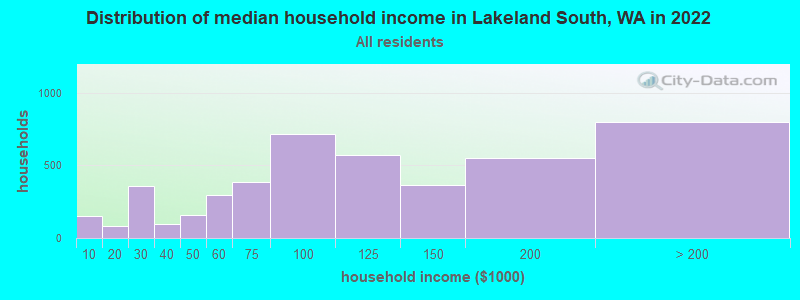
Lakeland South, WA household income distribution 154 Less than $10,00084 $10,000 to $19,999356 $20,000 to $29,99995 $30,000 to $39,999159 $40,000 to $49,999295 $50,000 to $59,999387 $60,000 to $74,999717 $75,000 to $99,999573 $100,000 to $124,999364 $125,000 to $149,999551 $150,000 to $199,999799 $200,000 or more
Home value of owner - occupied houses in 2022 in Lakeland South, WA 43 Less than $10,0005 $10,000 to $14,99911 $15,000 to $19,9993 $20,000 to $24,9994 $25,000 to $29,99919 $30,000 to $34,9995 $35,000 to $39,9996 $40,000 to $49,99974 $60,000 to $69,99935 $70,000 to $79,99979 $80,000 to $89,99927 $90,000 to $99,99996 $100,000 to $124,99956 $125,000 to $149,9998 $150,000 to $174,99919 $175,000 to $199,999119 $200,000 to $249,99998 $250,000 to $299,999345 $300,000 to $399,999500 $400,000 to $499,9991,209 $500,000 to $749,999214 $750,000 to $999,99922 $1,000,000 to $1,499,999Rent paid by renters in 2022 in Lakeland South, WA 39 Less than $10010 $300 to $34911 $450 to $499160 $500 to $54964 $800 to $89917 $900 to $999128 $1,000 to $1,24992 $1,250 to $1,499214 $1,500 to $1,999119 $2,000 to $2,49928 $2,500 to $2,99916 $3,500 or more68 No cash rent
Percentage of workers working in this county: 82.5%Number of people working at home: 660 (10.3% of all workers )
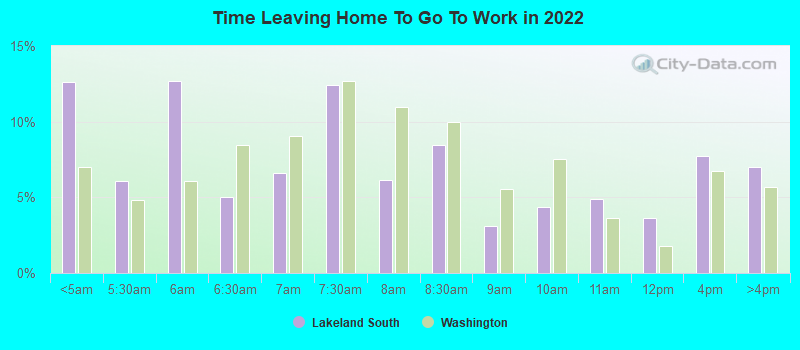
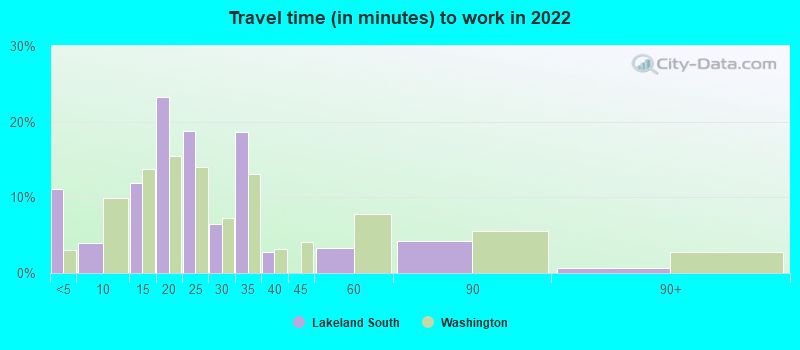
Travel time to work (commute)
Less than 5 minutes: 915 to 9 minutes: 29210 to 14 minutes: 54915 to 19 minutes: 63020 to 24 minutes: 78925 to 29 minutes: 35930 to 34 minutes: 92935 to 39 minutes: 23940 to 44 minutes: 30845 to 59 minutes: 48760 to 89 minutes: 45790 or more minutes: 112
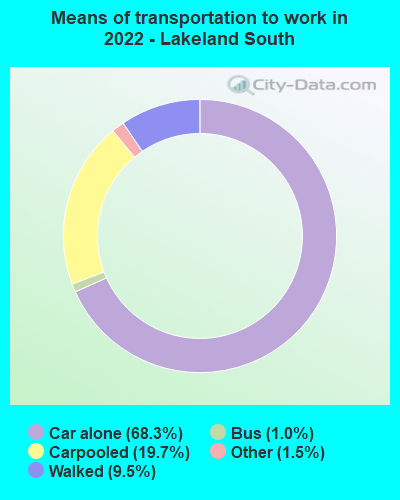
Means of transportation to work:
Drove a car alone: 620 (43.4%)Carpooled: 172 (12.0%)Bus : 5 (0.3%)Taxi: 12 (0.8%)Walked: 76 (5.3%)Worked at home: 660 (46.2%)
Unemployment by race in 2022
Unemployment rate for White non-Hispanic residents 4.4% Males6.2% FemalesUnemployment rate for Asian residents 7.6% MalesUnemployment rate for other race residents 4.1% MalesUnemployment rate for two or more race residents 13.8% MalesUnemployment rate for Hispanic or Latino residents 5.1% Males
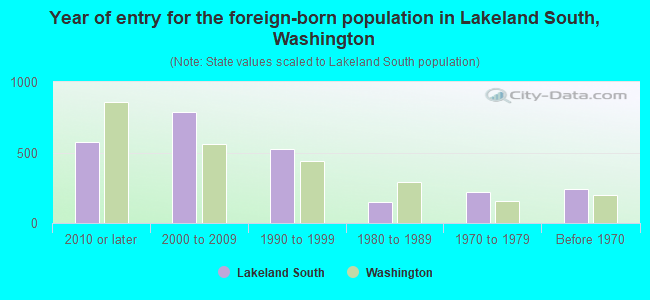
Year of entry for the foreign-born population in Lakeland South, Washington
571 2010 or later 790 2000 to 2009 526 1990 to 1999 150 1980 to 1989 220 1970 to 1979 240 Before 1970
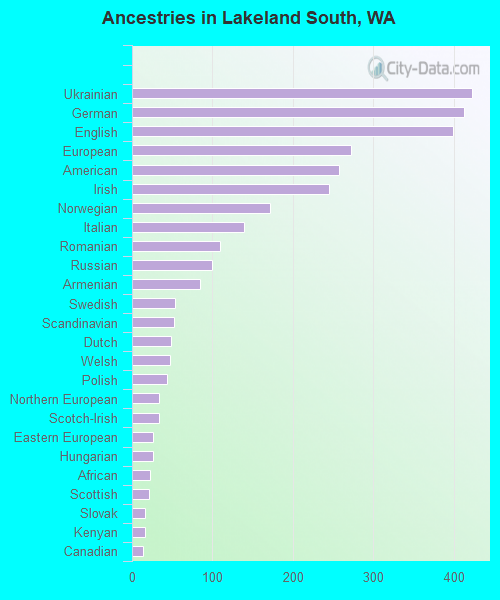
First ancestries reported:
Ukrainian: 423 (6.8%)
German: 413 (6.7%)
English: 399 (6.4%)
European: 272 (4.4%)
American: 258 (4.2%)
Irish: 245 (4.0%)
Norwegian: 172 (2.8%)
Italian: 139 (2.2%)
Romanian: 110 (1.8%)
Russian: 100 (1.6%)
Armenian: 84 (1.4%)
Swedish: 54 (0.9%)
Scandinavian: 52 (0.8%)
Dutch: 49 (0.8%)
Welsh: 47 (0.8%)
Polish: 44 (0.7%)
Northern European: 34 (0.5%)
Scotch-Irish: 34 (0.5%)
Eastern European: 26 (0.4%)
Hungarian: 26 (0.4%)
African: 23 (0.4%)
Scottish: 21 (0.3%)
Slovak: 16 (0.3%)
Kenyan: 16 (0.3%)
Canadian: 14 (0.2%)
British: 12 (0.2%)
Czech: 9 (0.1%)
Greek: 9 (0.1%)
Finnish: 7 (0.1%)
Pennsylvania German: 7 (0.1%)
Swiss: 7 (0.1%) Most common places of birth for foreign-born residents (%): Ukraine Lakeland South:
18.8% (465)Washington:
3.1% (35,872)
Korea Lakeland South:
13.0% (322)Washington:
4.3% (48,886)
Mexico Lakeland South:
12.0% (296)Washington:
21.1% (241,655)
Philippines Lakeland South:
5.2% (129)Washington:
6.3% (71,661)
Russia Lakeland South:
5.2% (128)Washington:
1.9% (21,540)
Honduras Lakeland South:
5.0% (124)Washington:
0.6% (6,500)
Moldova Lakeland South:
4.6% (114)Washington:
0.4% (4,536)
India Lakeland South:
4.4% (110)Washington:
8.9% (101,353)
Vietnam Lakeland South:
2.7% (66)Washington:
5.4% (62,003)
Oceania, n.e.c. Lakeland South:
2.5% (62)Washington:
0.7% (8,049)
Brazil Lakeland South:
2.2% (55)Washington:
0.8% (9,359)
Hungary Lakeland South:
1.8% (44)Washington:
0.1% (1,673)
Canada Lakeland South:
1.8% (44)Washington:
4.1% (47,238)
Kazakhstan Lakeland South:
1.6% (40)Washington:
0.2% (2,424)
Cambodia Lakeland South:
1.6% (39)Washington:
1.0% (10,993)
Place of birth for U.S.-born residents:
This state: 5,895Other state: 4,038Northeast: 266Midwest: 790South: 939West: 2,024 85.2% of Lakeland South residents lived in the same house 1 years ago.
Out of people who lived in different houses, 33.8% lived in this county.
Out of people who lived in different counties, 49.6% lived in Washington.
Lakeland South:
85.2%State average:
85.2%
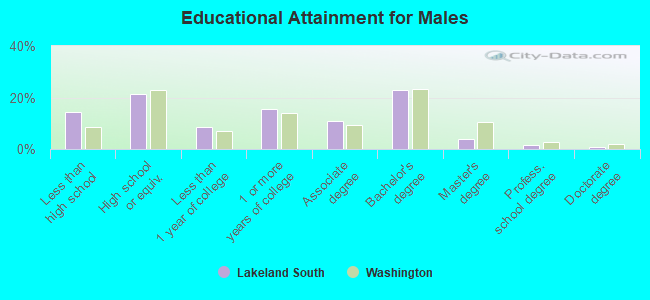
Education attainment for males 25 years and older:
No schooling: 68Nursery to 4th grade: 05th and 6th grade: 417th and 8th grade: 799th grade: 010th grade: 20311th grade: 5712th grade, no diploma: 198High school graduate (or equivalency): 979Less than 1 year of college: 397Some college more than 1 year, no degree: 713Associate degree: 501Bachelor's degree: 1,036Master's degree: 173Professional school degree: 77Doctorate degree: 30
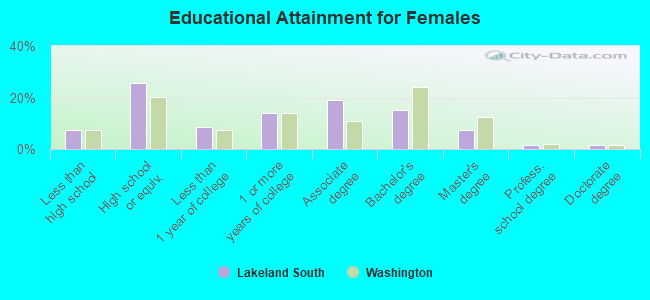
Education attainment for females 25 years and older:
No schooling: 62Nursery to 4th grade: 05th and 6th grade: 627th and 8th grade: 09th grade: 1210th grade: 011th grade: 5312th grade, no diploma: 129High school graduate (or equivalency): 1,118Less than 1 year of college: 370Some college more than 1 year, no degree: 601Associate degree: 823Bachelor's degree: 657Master's degree: 324Professional school degree: 68Doctorate degree: 65
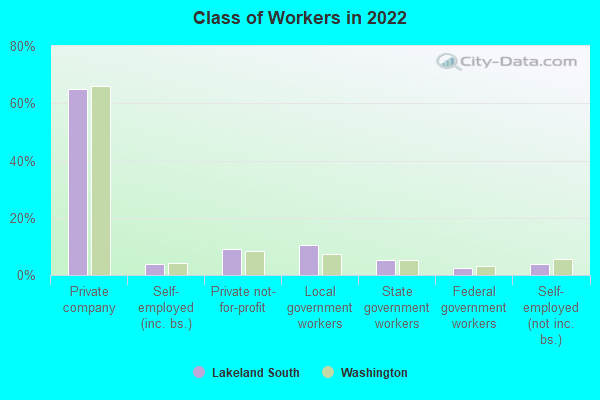
Housing units in structures:
One, detached: 3,809One, attached: 843 or 4: 2225 to 9: 1320 to 49: 13Mobile homes: 545Median worth of mobile homes: $128,414
Housing units lacking complete kitchen facilities in 2022: 0.3%House/condo owner moved in on average 13 years ago
Renter moved in on average 5 years ago
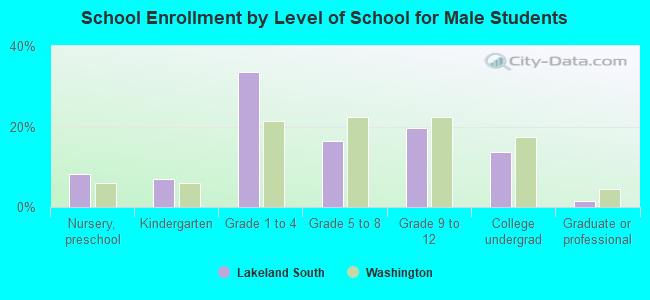
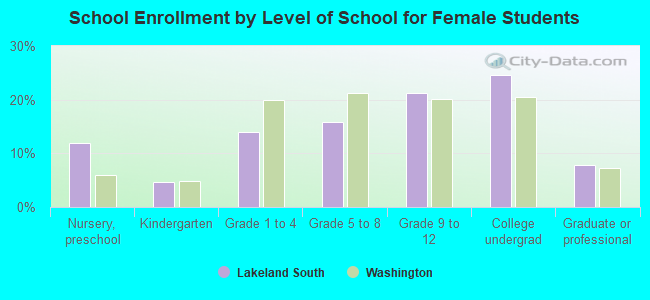
Private vs. public school enrollment:
Students in private schools in grades 1 to 8 (elementary and middle school): 154 Here:
12.9%Washington:
12.4%
Students in private schools in grades 9 to 12 (high school): 21 Students in private undergraduate colleges: 74 Here:
13.9%Washington:
16.5%