Lakewood, WA (Washington) Houses and Residents
Estimated median house or condo value in 2022: $492,353 (it was $139,800 in 2000 )
Lakewood:
$492,353Washington:
$569,500
Lower value quartile - upper value quartile: $365,773 - $553,314Mean price in 2022: Detached houses: $552,813 Here:
$552,813State:
$734,307
Townhouses or other attached units: $477,840 Here:
$477,840State:
$657,697
In 2-unit structures: $279,687 Here:
$279,687State:
$534,634
In 3-to-4-unit structures: $390,477 Here:
$390,477State:
$510,239
In 5-or-more-unit structures: $378,435 Here:
$378,435State:
$503,183
Mobile homes: $50,372 Here:
$50,372State:
$218,362
Occupied boats, RVs, vans, etc.: $21,341 Here:
$21,341State:
$159,523
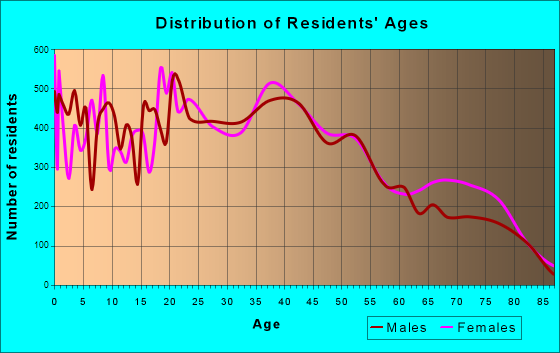
Total population: 59,610 (Urban population: 58,317, Rural population: 0)
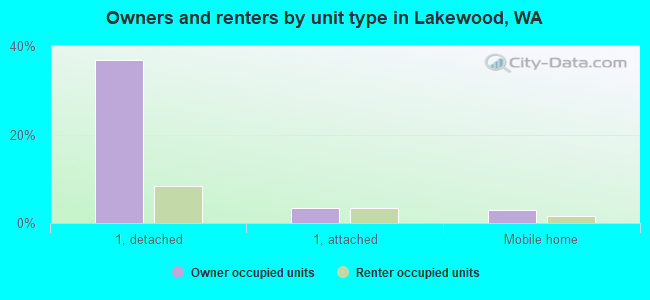
Houses: 29,066 (27,121 occupied: 11,819 owner occupied, 15,307 renter occupied )
% of renters here:
56%State:
36%
Housing density: 1,698 houses/condos per square mile
Median price asked for vacant for-sale houses and condos in 2022: $371,346.
Median contract rent in 2022: $1,313 (lower quartile is $1,033, upper quartile is $1,589)
Median rent asked for vacant for-rent units in 2022: $1,517
Median gross rent in Lakewood, WA in 2022: $1,389
Housing units in Lakewood with a mortgage: 6,661 (469 second mortgage, 0 home equity loan, 348 both second mortgage and home equity loan )Houses without a mortgage: 158
Median household income for houses/condos with a mortgage: $119,109
Median household income for apartments without a mortgage: $73,462
Median monthly housing costs: $1,359
Data:
Median house or condo value ($)
Median house or condo value ($ change since 2000)
Median house or condo value ($) - White
Median house or condo value ($) - Black or African American
Median house or condo value ($) - Asian
Median house or condo value ($) - Hispanic or Latino
Median house or condo value ($) - American Indian and Alaska Native
Median house or condo value ($) - Multirace
Median house or condo value ($) - Other Race
Median price asked for mobile homes ($)
Household density (households per square mile)
Mean house or condo value by units in structure - 1, detached ($)
Mean house or condo value by units in structure - 1, attached ($)
Mean house or condo value by units in structure - 2 ($)
Mean house or condo value by units in structure by units in structure - 3 or 4 ($)
Mean house or condo value by units in structure - 5 or more ($)
Mean house or condo value by units in structure - Boat, RV, van, etc. ($)
Mean house or condo value by units in structure - Mobile home ($)
Median contract rent ($)
Median contract rent - Lower quartile ($)
Median contract rent - Upper quartile ($)
Median gross rent ($)
Urban houses (%)
Rural houses (%)
Houses occupied (%)
Houses occupied (% change since 2000)
Houses owner occupied (%)
Houses owner occupied (% change since 2000)
Houses renter occupied (%)
Houses renter occupied (% change since 2000)
Vacant housing units - For rent (%)
Vacant housing units - For rent (% change since 2000)
Vacant housing units - For sale only (%)
Vacant housing units - For sale only (% change since 2000)
Vacant housing units - Rented or sold, not occupied (%)
Vacant housing units - Rented or sold, not occupied (% change since 2000)
Vacant housing units - For seasonal, recreational, or occasional use (%)
Vacant housing units - For seasonal, recreational, or occasional use (% change since 2000)
Vacant housing units - For migrant workers (%)
Vacant housing units - For migrant workers (% change since 2000)
Vacant housing units - Other vacant (%)
Vacant housing units - Other vacant (% change since 2000)
Median monthly housing costs ($)
Median household income for houses/condos with a mortgage ($)
Median household income for houses/condos without a mortgage ($)
Median household income ($)
Median household income ($) - White
Median household income ($) - Black or African American
Median household income ($) - Asian
Median household income ($) - Hispanic or Latino
Median household income ($) - American Indian and Alaska Native
Median household income ($) - Multirace
Median household income ($) - Other Race
Mortgage status - with mortgage (%)
Mortgage status - with second mortgage (%)
Mortgage status - with home equity loan (%)
Mortgage status - with both second mortgage and home equity loan (%)
Mortgage status - without a mortgage (%)
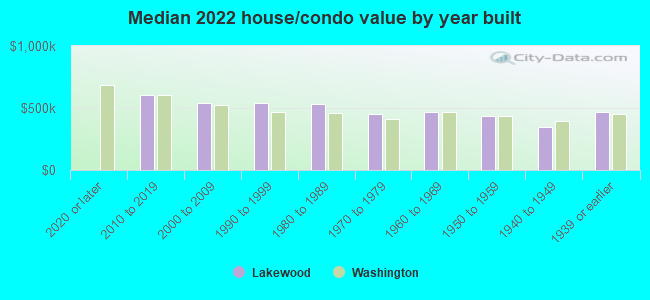
Median year house/condo built
Median year apartment built
Household type by relationship - Male householder living alone (%)
Household type by relationship - Male householder not living alone (%)
Household type by relationship - Female householder living alone (%)
Household type by relationship - Female householder not living alone (%)
Household type by relationship - Opposite-Sex spouse (%)
Household type by relationship - Same-Sex spouse (%)
Household type by relationship - Opposite-Sex unmarried partner (%)
Household type by relationship - Same-Sex unmarried partner (%)
Household type by relationship - In group quarters (%)
Size of family households - 2-person household (%)
Size of family households - 3-person household (%)
Size of family households - 4-person household (%)
Size of family households - 5-person household (%)
Size of family households - 6-person household (%)
Size of family households - 7-or-more-person household (%)
Size of nonfamily households - 1-person household (%)
Size of nonfamily households - 2-person household (%)
Size of nonfamily households - 3-person household (%)
Size of nonfamily households - 4-person household (%)
Size of nonfamily households - 5-person household (%)
Size of nonfamily households - 6-person household (%)
Size of nonfamily households - 7-or-moreperson household (%)
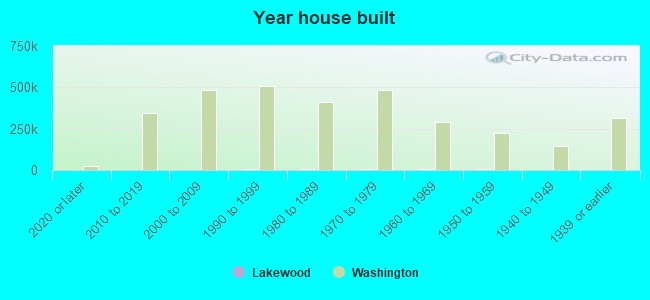
Year house built - Built 2010 or later (%)
Year house built - Built 2000 to 2009 (%)
Year house built - Built 1990 to 1999 (%)
Year house built - Built 1980 to 1989 (%)
Year house built - Built 1970 to 1979 (%)
Year house built - Built 1960 to 1969 (%)
Year house built - Built 1950 to 1959 (%)
Year house built - Built 1940 to 1949 (%)
Year house built - Built 1939 or earlier (%)
Median number of rooms in houses and condos
Median number of rooms in apartments
Median number of bedrooms in owner occupied houses
Mean number of bedrooms in owner occupied houses
Median number of bedrooms in renter occupied houses
Mean number of bedrooms in renter occupied houses
Median number of vehichles in owner occupied houses
Mean number of vehichles in owner occupied houses
Median number of vehichles in renter occupied houses
Mean number of vehichles in renter occupied houses
Rooms in owner-occupied houses - 1 room (%)
Rooms in owner-occupied houses - 2 rooms (%)
Rooms in owner-occupied houses - 3 rooms (%)
Rooms in owner-occupied houses - 4 rooms (%)
Rooms in owner-occupied houses - 5 rooms (%)
Rooms in owner-occupied houses - 6 rooms (%)
Rooms in owner-occupied houses - 7 rooms (%)
Rooms in owner-occupied houses - 8 rooms (%)
Rooms in owner-occupied houses - 9+ rooms (%)
Rooms in renter-occupied houses - 1 room (%)
Rooms in renter-occupied houses - 2 rooms (%)
Rooms in renter-occupied houses - 3 rooms (%)
Rooms in renter-occupied houses - 4 rooms (%)
Rooms in renter-occupied houses - 5 rooms (%)
Rooms in renter-occupied houses - 6 rooms (%)
Rooms in renter-occupied houses - 7 rooms (%)
Rooms in renter-occupied houses - 8 rooms (%)
Rooms in renter-occupied houses - 9+ rooms (%)
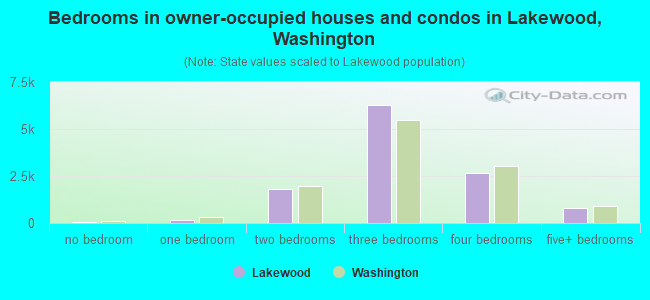
Bedrooms in owner-occupied houses - no bedrooms (%)
Bedrooms in owner-occupied houses - 1 bedroom (%)
Bedrooms in owner-occupied houses - 2 bedrooms (%)
Bedrooms in owner-occupied houses - 3 bedrooms (%)
Bedrooms in owner-occupied houses - 4 bedrooms (%)
Bedrooms in owner-occupied houses - 5+ bedrooms (%)
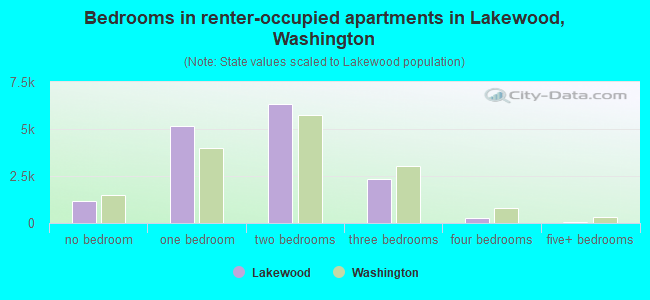
Bedrooms in renter-occupied houses - no bedrooms (%)
Bedrooms in renter-occupied houses - 1 bedroom (%)
Bedrooms in renter-occupied houses - 2 bedrooms (%)
Bedrooms in renter-occupied houses - 3 bedrooms (%)
Bedrooms in renter-occupied houses - 4 bedrooms (%)
Bedrooms in renter-occupied houses - 5+ bedrooms (%)
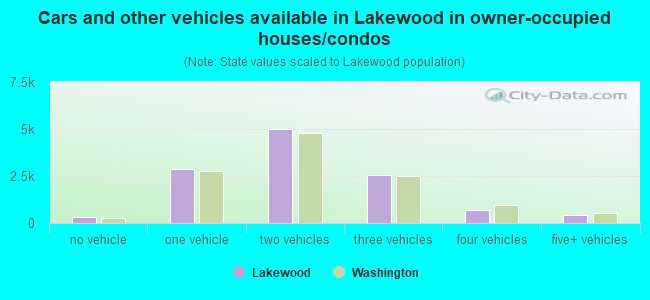
Vehicles available in owner-occupied houses - no vehicle available (%)
Vehicles available in owner-occupied houses - 1 vehicle available(%)
Vehicles available in owner-occupied houses - 2 Vehicles available (%)
Vehicles available in owner-occupied houses - 3 Vehicles available (%)
Vehicles available in owner-occupied houses - 4 Vehicles available (%)
Vehicles available in owner-occupied houses - 5+ Vehicles available (%)
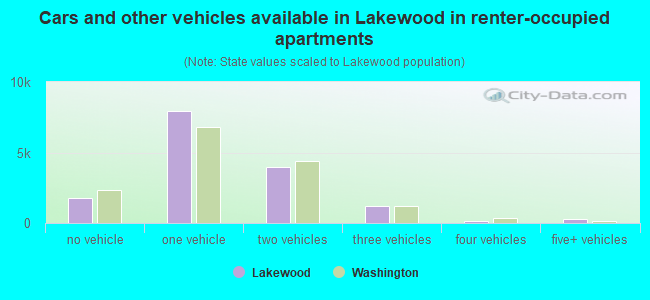
Vehicles available in renter-occupied houses - no vehicle available (%)
Vehicles available in renter-occupied houses - 1 vehicle available (%)
Vehicles available in renter-occupied houses - 2 Vehicles available (%)
Vehicles available in renter-occupied houses - 3 Vehicles available (%)
Vehicles available in renter-occupied houses - 4 Vehicles available (%)
Vehicles available in renter-occupied houses - 5+ Vehicles available (%)
Housing units in structures - 1, detached (%)
Housing units in structures - 1, attached (%)
Housing units in structures - 2 (%)
Housing units in structures - 3 or 4 (%)
Housing units in structures - 5 to 9 (%)
Housing units in structures - 10 to 19 (%)
Housing units in structures - 20 to 49 (%)
Housing units in structures - 50 or more (%)
Housing units in structures - Mobile home (%)
Housing units in structures - Boat, RV, van, etc. (%)
Housing units in structures - Owners - 1, detached (%)
Housing units in structures - Owners - 1, attached (%)
Housing units in structures - Owners - 2 (%)
Housing units in structures - Owners - 3 or 4 (%)
Housing units in structures - Owners - 5 to 9 (%)
Housing units in structures - Owners - 10 to 19 (%)
Housing units in structures - Owners - 20 to 49 (%)
Housing units in structures - Owners - 50 or more (%)
Housing units in structures - Owners - Mobile home (%)
Housing units in structures - Owners - Boat, RV, van, etc. (%)
Housing units in structures - Renters - 1, detached (%)
Housing units in structures - Renters - 1, attached (%)
Housing units in structures - Renters - 2 (%)
Housing units in structures - Renters - 3 or 4 (%)
Housing units in structures - Renters - 5 to 9 (%)
Housing units in structures - Renters - 10 to 19 (%)
Housing units in structures - Renters - 20 to 49 (%)
Housing units in structures - Renters - 50 or more (%)
Housing units in structures - Renters - Mobile home (%)
Housing units in structures - Renters - Boat, RV, van, etc. (%)
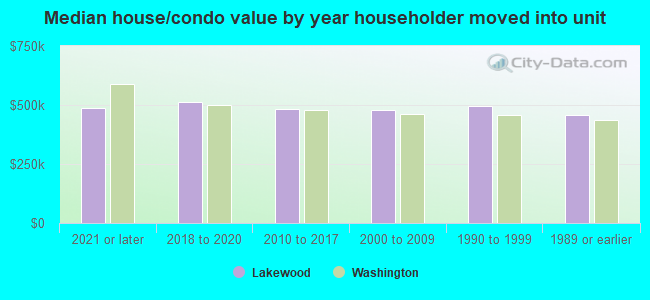
House/condo owner moved in on average (years ago)
Renter moved in on average (years ago)
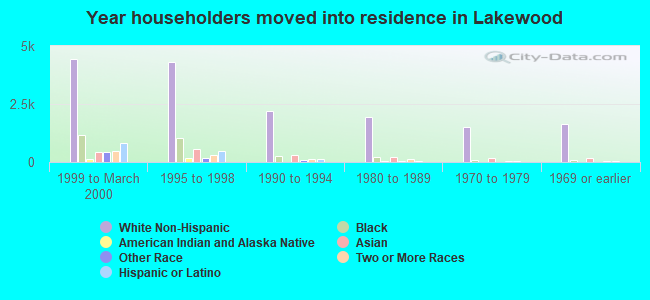
Year householder moved into unit - Moved in 1999 to March 2000 (%)
Year householder moved into unit - Moved in 1999 to March 2000 (%) - White
Year householder moved into unit - Moved in 1999 to March 2000 (%) - Black or African American
Year householder moved into unit - Moved in 1999 to March 2000 (%) - Asian
Year householder moved into unit - Moved in 1999 to March 2000 (%) - Hispanic or Latino
Year householder moved into unit - Moved in 1999 to March 2000 (%) - American Indian and Alaska Native
Year householder moved into unit - Moved in 1999 to March 2000 (%) - Multirace
Year householder moved into unit - Moved in 1999 to March 2000 (%) - Other Race
Year householder moved into unit - Moved in 1995 to 1998 (%)
Year householder moved into unit - Moved in 1995 to 1998 (%) - White
Year householder moved into unit - Moved in 1995 to 1998 (%) - Black or African American
Year householder moved into unit - Moved in 1995 to 1998 (%) - Asian
Year householder moved into unit - Moved in 1995 to 1998 (%) - Hispanic or Latino
Year householder moved into unit - Moved in 1995 to 1998 (%) - American Indian and Alaska Native
Year householder moved into unit - Moved in 1995 to 1998 (%) - Multirace
Year householder moved into unit - Moved in 1995 to 1998 (%) - Other Race
Year householder moved into unit - Moved in 1990 to 1994 (%)
Year householder moved into unit - Moved in 1990 to 1994 (%) - White
Year householder moved into unit - Moved in 1990 to 1994 (%) - Black or African American
Year householder moved into unit - Moved in 1990 to 1994 (%) - Asian
Year householder moved into unit - Moved in 1990 to 1994 (%) - Hispanic or Latino
Year householder moved into unit - Moved in 1990 to 1994 (%) - American Indian and Alaska Native
Year householder moved into unit - Moved in 1990 to 1994 (%) - Multirace
Year householder moved into unit - Moved in 1990 to 1994 (%) - Other Race
Year householder moved into unit - Moved in 1980 to 1989 (%)
Year householder moved into unit - Moved in 1980 to 1989 (%) - White
Year householder moved into unit - Moved in 1980 to 1989 (%) - Black or African American
Year householder moved into unit - Moved in 1980 to 1989 (%) - Asian
Year householder moved into unit - Moved in 1980 to 1989 (%) - Hispanic or Latino
Year householder moved into unit - Moved in 1980 to 1989 (%) - American Indian and Alaska Native
Year householder moved into unit - Moved in 1980 to 1989 (%) - Multirace
Year householder moved into unit - Moved in 1980 to 1989 (%) - Other Race
Year householder moved into unit - Moved in 1970 to 1979 (%)
Year householder moved into unit - Moved in 1970 to 1979 (%) - White
Year householder moved into unit - Moved in 1970 to 1979 (%) - Black or African American
Year householder moved into unit - Moved in 1970 to 1979 (%) - Asian
Year householder moved into unit - Moved in 1970 to 1979 (%) - Hispanic or Latino
Year householder moved into unit - Moved in 1970 to 1979 (%) - American Indian and Alaska Native
Year householder moved into unit - Moved in 1970 to 1979 (%) - Multirace
Year householder moved into unit - Moved in 1970 to 1979 (%) - Other Race
Year householder moved into unit - Moved in 1969 or earlier (%)
Year householder moved into unit - Moved in 1969 or earlier (%) - White
Year householder moved into unit - Moved in 1969 or earlier (%) - Black or African American
Year householder moved into unit - Moved in 1969 or earlier (%) - Asian
Year householder moved into unit - Moved in 1969 or earlier (%) - Hispanic or Latino
Year householder moved into unit - Moved in 1969 or earlier (%) - American Indian and Alaska Native
Year householder moved into unit - Moved in 1969 or earlier (%) - Multirace
Year householder moved into unit - Moved in 1969 or earlier (%) - Other Race
Housing units lacking complete plumbing facilities (%)
Housing units lacking complete kitchen facilities (%)
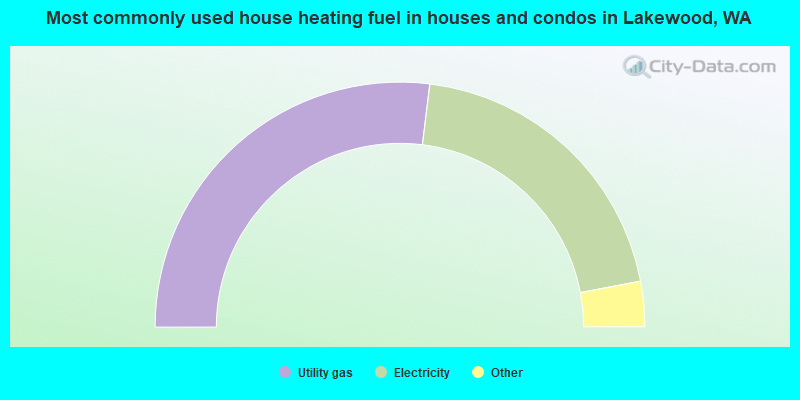
House heating fuel used in houses and condos - Utility gas (%)
House heating fuel used in houses and condos - Bottled, tank, or LP gas (%)
House heating fuel used in houses and condos - Electricity (%)
House heating fuel used in houses and condos - Fuel oil, kerosene, etc. (%)
House heating fuel used in houses and condos - Coal or coke (%)
House heating fuel used in houses and condos - Wood (%)
House heating fuel used in houses and condos - Solar energy (%)
House heating fuel used in houses and condos - Other fuel (%)
House heating fuel used in houses and condos - No fuel used (%)
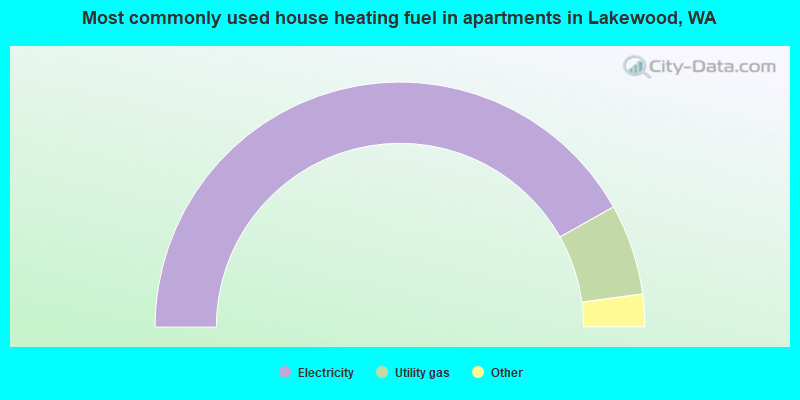
House heating fuel used in apartments - Utility gas (%)
House heating fuel used in apartments - Bottled, tank, or LP gas (%)
House heating fuel used in apartments - Electricity (%)
House heating fuel used in apartments - Fuel oil, kerosene, etc. (%)
House heating fuel used in apartments - Coal or coke (%)
House heating fuel used in apartments - Wood (%)
House heating fuel used in apartments - Solar energy (%)
House heating fuel used in apartments - Other fuel (%)
House heating fuel used in apartments - No fuel used (%)
Latest news about housing in Lakewood, WA collected exclusively by city-data.com from local newspapers, TV, and radio stations
Median year house/condo built: 1968Median year apartment built: 1978Household type by relationship:
Households: 63,718
Male householders: 13,346 (4,373 living alone ), Female householders: 13,259 (4,412 living alone )10,252 spouses (10,135 opposite-sex spouses ), 2,726 unmarried partners , (2,677 opposite-sex unmarried partners ), 15,150 children (13,830 natural , 258 adopted , 1,061 stepchildren ), 1,499 grandchildren , 1,242 brothers or sisters , 1,055 parents , 36 foster children , 1,091 other relatives , 2,640 non-relatives In group quarters: 1,415
Size of family households: 7,555 2-persons , 3,855 3-persons , 2,701 4-persons , 1,249 5-persons , 275 6-persons , 533 7-or-more-persons .
Size of nonfamily households: 8,945 1-person , 1,786 2-persons , 173 3-persons , 39 4-persons , 28 5-persons , 20 6-persons .
5,551 married couples with children. single-parent households (1,640 men , 4,028 women ).
76.4% of residents of Lakewood speak English at home. of residents speak Spanish at home (63% speak English very well , 17% speak English well , 17% speak English not well , 3% don't speak English at all ).of residents speak other Indo-European language at home (85% speak English very well , 9% speak English well , 4% speak English not well , 2% don't speak English at all ).of residents speak Asian or Pacific Island language at home (54% speak English very well , 27% speak English well , 18% speak English not well , 1% don't speak English at all ).of residents speak other language at home (84% speak English very well , 8% speak English well , 8% speak English not well ).
Foreign born population: 10,419 (16.4%)of them are naturalized citizens )
Median number of rooms in houses and condos:
Median number of rooms in apartments
Owner-occupied Renter-occupied
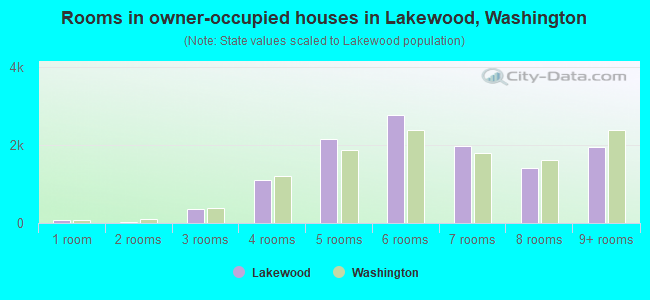
Rooms in owner-occupied houses in Lakewood, Washington
65 1 room 25 2 rooms 363 3 rooms 1,111 4 rooms 2,154 5 rooms 2,771 6 rooms 1,968 7 rooms 1,418 8 rooms 1,945 9+ rooms
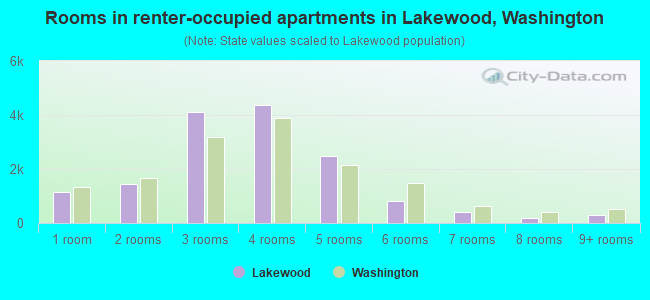
Rooms in renter-occupied apartments in Lakewood, Washington
1,153 1 room 1,451 2 rooms 4,114 3 rooms 4,370 4 rooms 2,491 5 rooms 817 6 rooms 411 7 rooms 187 8 rooms 314 9+ rooms
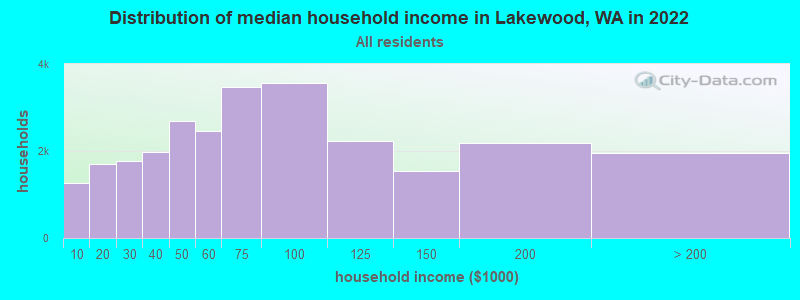
Lakewood, WA household income distribution 1,269 Less than $10,0001,693 $10,000 to $19,9991,773 $20,000 to $29,9991,980 $30,000 to $39,9992,696 $40,000 to $49,9992,454 $50,000 to $59,9993,476 $60,000 to $74,9993,566 $75,000 to $99,9992,230 $100,000 to $124,9991,531 $125,000 to $149,9992,184 $150,000 to $199,9991,959 $200,000 or more
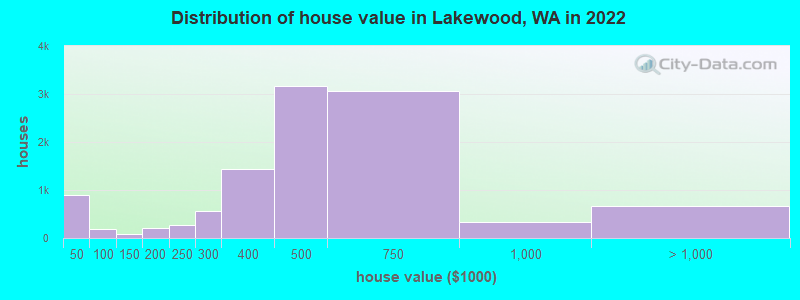
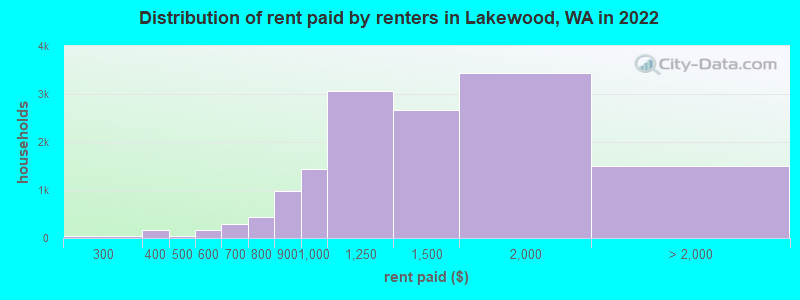
Home value of owner - occupied houses in 2022 in Lakewood, WA 303 Less than $10,00054 $10,000 to $14,999175 $15,000 to $19,99935 $20,000 to $24,99967 $25,000 to $29,99988 $30,000 to $34,99970 $35,000 to $39,999111 $40,000 to $49,99943 $50,000 to $59,9999 $60,000 to $69,99923 $70,000 to $79,9997 $80,000 to $89,99957 $100,000 to $124,99918 $125,000 to $149,99998 $150,000 to $174,999116 $175,000 to $199,999268 $200,000 to $249,999559 $250,000 to $299,9991,441 $300,000 to $399,9993,171 $400,000 to $499,9993,060 $500,000 to $749,999334 $750,000 to $999,999399 $1,000,000 to $1,499,99968 $1,500,000 to $1,999,999207 $2,000,000 or moreRent paid by renters in 2022 in Lakewood, WA 3 Less than $10031 $150 to $19927 $200 to $24913 $250 to $299158 $300 to $3499 $350 to $39941 $450 to $499139 $500 to $54917 $550 to $59998 $600 to $649188 $650 to $69975 $700 to $749363 $750 to $799988 $800 to $8991,447 $900 to $9993,053 $1,000 to $1,2492,674 $1,250 to $1,4993,440 $1,500 to $1,999839 $2,000 to $2,499158 $2,500 to $2,99956 $3,000 to $3,49967 $3,500 or more381 No cash rent
Percentage of workers working in this county: 86.7%Number of people working at home: 3,112 (10.3% of all workers )
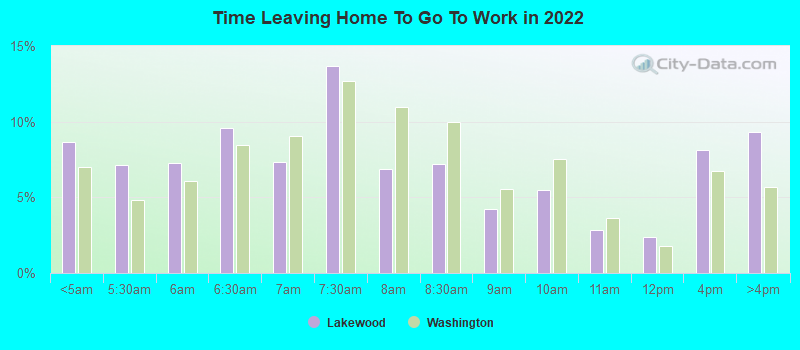
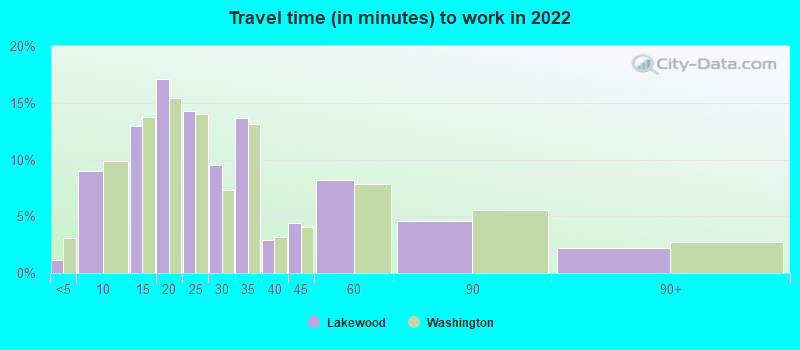
Travel time to work (commute)
Less than 5 minutes: 2705 to 9 minutes: 2,21010 to 14 minutes: 3,55915 to 19 minutes: 4,94820 to 24 minutes: 3,82525 to 29 minutes: 2,92430 to 34 minutes: 3,68335 to 39 minutes: 75940 to 44 minutes: 94445 to 59 minutes: 1,88860 to 89 minutes: 1,24590 or more minutes: 779
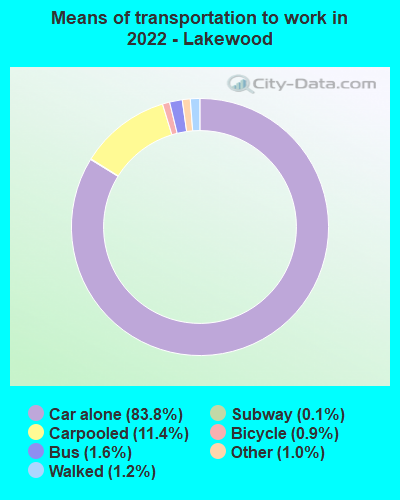
Means of transportation to work:
Drove a car alone: 23,007 (72.9%)Carpooled: 3,244 (10.3%)Bus : 399 (1.3%)Long-distance train or commuter rail : 52 (0.2%)Taxi: 259 (0.8%)Bicycle: 369 (1.2%)Walked: 409 (1.3%)Worked at home: 3,112 (9.9%)
Unemployment by race in 2022
Unemployment rate for White non-Hispanic residents 4.2% Males2.7% FemalesUnemployment rate for Black residents 10.6% Males1.2% FemalesUnemployment rate for American Indian and Alaska Native residents 5.9% FemalesUnemployment rate for Asian residents 5.6% Males3.5% FemalesUnemployment rate for other race residents 4.2% Males4.6% FemalesUnemployment rate for two or more race residents 10.1% Males1.3% FemalesUnemployment rate for Hispanic or Latino residents 14.2% Males5.2% Females
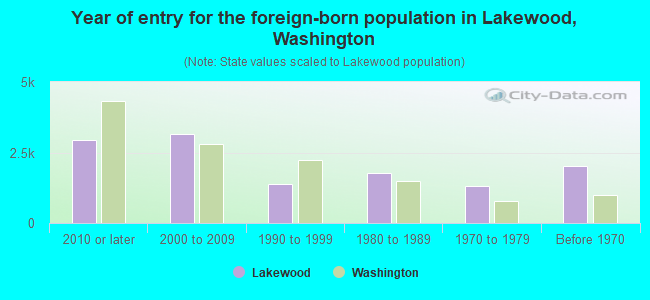
Year of entry for the foreign-born population in Lakewood, Washington
2,955 2010 or later 3,170 2000 to 2009 1,394 1990 to 1999 1,790 1980 to 1989 1,311 1970 to 1979 2,012 Before 1970
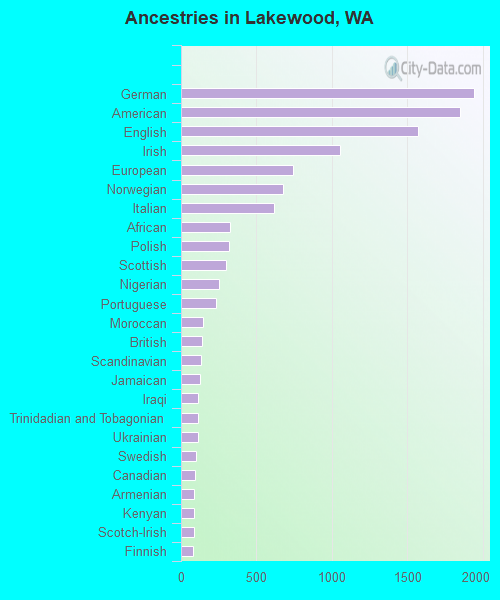
First ancestries reported:
German: 1,943 (6.3%)
American: 1,850 (6.0%)
English: 1,572 (5.1%)
Irish: 1,051 (3.4%)
European: 742 (2.4%)
Norwegian: 673 (2.2%)
Italian: 618 (2.0%)
African: 325 (1.1%)
Polish: 320 (1.0%)
Scottish: 301 (1.0%)
Nigerian: 252 (0.8%)
Portuguese: 231 (0.8%)
Moroccan: 145 (0.5%)
British: 139 (0.5%)
Scandinavian: 135 (0.4%)
Jamaican: 128 (0.4%)
Iraqi: 112 (0.4%)
Trinidadian and Tobagonian: 112 (0.4%)
Ukrainian: 110 (0.4%)
Swedish: 101 (0.3%)
Canadian: 90 (0.3%)
Armenian: 88 (0.3%)
Kenyan: 86 (0.3%)
Scotch-Irish: 83 (0.3%)
Finnish: 80 (0.3%)
Northern European: 75 (0.2%)
French: 68 (0.2%)
Croatian: 53 (0.2%)
Russian: 49 (0.2%)
Dutch: 47 (0.2%)
Welsh: 32 (0.1%)
Turkish: 29 (0.09%)
Czech: 25 (0.08%)
Hungarian: 25 (0.08%)
Danish: 23 (0.07%)
Romanian: 22 (0.07%)
Cajun: 19 (0.06%)
British West Indian: 19 (0.06%)
Belgian: 17 (0.06%)
Greek: 16 (0.05%)
French Canadian: 16 (0.05%)
Austrian: 15 (0.05%)
Latvian: 9 (0.03%)
Ethiopian: 8 (0.03%)
Swiss: 8 (0.03%)
Pennsylvania German: 7 (0.02%)
Eastern European: 7 (0.02%)
Lebanese: 7 (0.02%)
Haitian: 6 (0.02%)
Bahamian: 4 (0.01%)
Most common places of birth for foreign-born residents (%): Mexico Lakewood:
26.4% (2,672)Washington:
21.1% (241,655)
Philippines Lakewood:
16.7% (1,688)Washington:
6.3% (71,661)
Korea Lakewood:
13.5% (1,363)Washington:
4.3% (48,886)
Vietnam Lakewood:
4.9% (497)Washington:
5.4% (62,003)
Germany Lakewood:
4.3% (433)Washington:
1.6% (17,761)
Jamaica Lakewood:
3.3% (334)Washington:
0.3% (3,471)
Kenya Lakewood:
2.6% (261)Washington:
1.1% (12,735)
Japan Lakewood:
2.2% (221)Washington:
1.5% (17,453)
Canada Lakewood:
1.9% (197)Washington:
4.1% (47,238)
Thailand Lakewood:
1.9% (196)Washington:
0.9% (9,937)
Micronesia Lakewood:
1.8% (185)Washington:
0.4% (4,144)
Nigeria Lakewood:
1.7% (174)Washington:
0.2% (2,660)
Honduras Lakewood:
1.6% (163)Washington:
0.6% (6,500)
Place of birth for U.S.-born residents:
This state: 25,510Other state: 24,482Northeast: 2,065Midwest: 5,857South: 6,603West: 10,008 84.1% of Lakewood residents lived in the same house 1 years ago.
Out of people who lived in different houses, 36.8% lived in this county.
Out of people who lived in different counties, 31.8% lived in Washington.
Lakewood:
84.1%State average:
85.2%
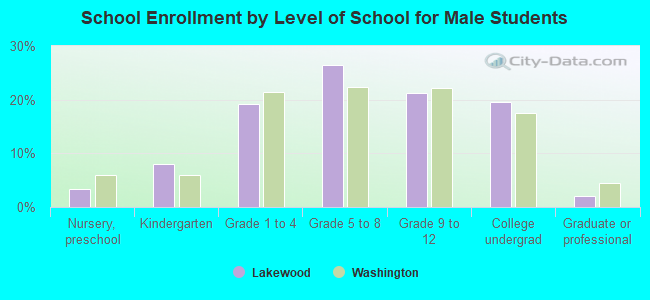
Education attainment for males 25 years and older:
No schooling: 355Nursery to 4th grade: 05th and 6th grade: 2947th and 8th grade: 4419th grade: 20710th grade: 25011th grade: 66512th grade, no diploma: 540High school graduate (or equivalency): 6,744Less than 1 year of college: 1,765Some college more than 1 year, no degree: 3,629Associate degree: 2,068Bachelor's degree: 2,616Master's degree: 1,487Professional school degree: 481Doctorate degree: 429
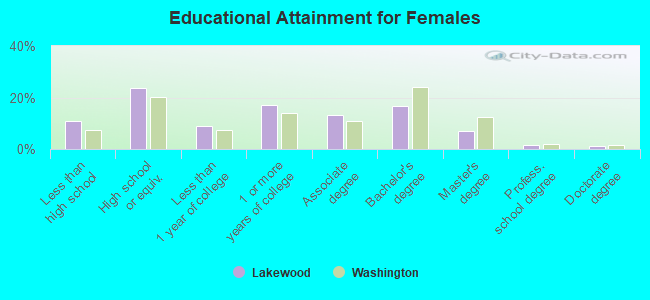
Education attainment for females 25 years and older:
No schooling: 439Nursery to 4th grade: 225th and 6th grade: 2457th and 8th grade: 2259th grade: 31010th grade: 19311th grade: 44212th grade, no diploma: 612High school graduate (or equivalency): 5,365Less than 1 year of college: 2,019Some college more than 1 year, no degree: 3,869Associate degree: 3,008Bachelor's degree: 3,836Master's degree: 1,557Professional school degree: 308Doctorate degree: 270
Housing units in structures:
One, detached: 12,969One, attached: 1,593Two: 1,1043 or 4: 2,6635 to 9: 2,90110 to 19: 3,44420 to 49: 1,75250 or more: 1,338Mobile homes: 1,282Boats, RVs, vans, etc.: 15Median worth of mobile homes: $22,346
Housing units lacking complete plumbing facilities in 2022: 0.3%Housing units lacking complete kitchen facilities in 2022: 0.8%House/condo owner moved in on average 12 years ago
Renter moved in on average 3 years ago
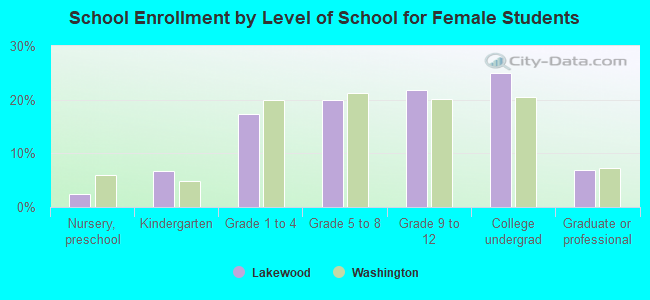
Private vs. public school enrollment:
Students in private schools in grades 1 to 8 (elementary and middle school): 168 Here:
3.1%Washington:
12.4%
Students in private schools in grades 9 to 12 (high school): 93 Students in private undergraduate colleges: 630 Here:
22.3%Washington:
16.5%