Lambs Grove, IA (Iowa) Houses and Residents
| Lambs Grove: | $199,636 |
| Iowa: | $194,600 |
Mean price in 2022:
Detached houses: $199,319
Here: $199,319 State: $245,224
Total population: 172 (All urban)
Houses: 95 (95 occupied: 95 owner occupied, 1 renter occupied)
| % of renters here: | 1% |
| State: | 28% |
Housing density: 937 houses/condos per square mile
Median price asked for vacant for-sale houses and condos in 2022 in this county: $105,956.
Median gross rent in Lambs Grove, IA in 2022: $-649,890,590
Housing units in Lambs Grove with a mortgage: 57 (7 second mortgage, 0 home equity loan, 4 both second mortgage and home equity loan)
Houses without a mortgage: 0
Median household income for houses/condos with a mortgage: $112,717
Median household income for apartments without a mortgage: $61,725
Median monthly housing costs: $1,071
Compare current foreclosures near Lambs Grove, IA:
| Photo | Address | Area | Beds / Baths | Price | Details |
|---|---|---|---|---|---|

|
#1
Marion St
Prairie City, IA 50228
|
1,145 sq. feet
|
1 baths 2 beds |
show details | |

|
#2
N Park St
Prairie City, IA 50228
|
1,316 sq. feet
|
1 baths 4 beds |
show details | |

|
#3
50th Ave
Prairie City, IA 50228
|
2,052 sq. feet
|
2 baths 3 beds |
show details | |

|
#4
Park St
Laurel, IA 50141
|
1,230 sq. feet
|
1 baths 2 beds |
show details | |

|
#5
N 11th Ave E
Newton, IA 50208
|
- sq. feet
|
- baths - beds |
show details | |

|
#6
Rock Creek West St
Kellogg, IA 50135
|
- sq. feet
|
- baths - beds |
show details | |

|
#7
E North St
Monroe, IA 50170
|
- sq. feet
|
- baths - beds |
show details | |

|
#8
W Steenhoek St Unit A
Prairie City, IA 50228
|
- sq. feet
|
- baths - beds |
show details | |

|
#9
E 23rd St S
Newton, IA 50208
|
- sq. feet
|
- baths - beds |
show details | |

|
#10
S 7th Ave E # 4
Newton, IA 50208
|
- sq. feet
|
- baths - beds |
show details |
| Photo | Address | Area | Beds / Baths | Price | Details |
|---|---|---|---|---|---|

|
#11
S 8th Ave W
Newton, IA 50208
|
- sq. feet
|
- baths - beds |
show details | |

|
#12
E 15th St N
Newton, IA 50208
|
- sq. feet
|
- baths - beds |
show details | |

|
#13
S 17th Ave W
Newton, IA 50208
|
- sq. feet
|
- baths - beds |
show details | |

|
#14
E 8th St S
Newton, IA 50208
|
- sq. feet
|
- baths - beds |
show details | |

|
#15
E 3rd St S
Newton, IA 50208
|
- sq. feet
|
- baths - beds |
show details | |

|
#16
S 112th Ave E
Reasnor, IA 50232
|
- sq. feet
|
- baths - beds |
show details | |

|
#17
S 3rd Ave E
Newton, IA 50208
|
- sq. feet
|
- baths - beds |
show details | |

|
#18
E 5th St N
Newton, IA 50208
|
- sq. feet
|
- baths - beds |
show details | |

|
#19
N 2nd Ave E
Newton, IA 50208
|
- sq. feet
|
- baths - beds |
show details | |

|
#20
Glenway Dr
Newton, IA 50208
|
- sq. feet
|
- baths - beds |
show details |
| Photo | Address | Area | Beds / Baths | Price | Details |
|---|---|---|---|---|---|

|
#21
Holiday Ct
Newton, IA 50208
|
- sq. feet
|
- baths - beds |
show details | |

|
#22
S Goodrich St
Colfax, IA 50054
|
- sq. feet
|
- baths - beds |
show details | |

|
#23
Lincoln St
Newton, IA 50208
|
- sq. feet
|
- baths - beds |
show details | |

|
#24
W 84th St N
Colfax, IA 50054
|
- sq. feet
|
- baths - beds |
show details | |

|
#25
N 6th Ave E
Newton, IA 50208
|
- sq. feet
|
- baths - beds |
show details | |

|
#26
S 28th Ave W
Newton, IA 50208
|
- sq. feet
|
- baths - beds |
show details | |

|
#27
W 3rd St N
Newton, IA 50208
|
- sq. feet
|
- baths - beds |
show details | |

|
#28
N 4th Ave E
Newton, IA 50208
|
- sq. feet
|
- baths - beds |
show details | |

|
#29
Water St
Kellogg, IA 50135
|
- sq. feet
|
- baths - beds |
show details | |

|
Check over 1 million property listings on Foreclosure.com!
|
browse all offers | |||


Household type by relationship:
Households: 281- Male householders: 47 (6 living alone), Female householders: 47 (13 living alone)
63 spouses (63 opposite-sex spouses), 12 unmarried partners, (12 opposite-sex unmarried partners), 86 children (86 natural, 0 adopted, 0 stepchildren), 7 grandchildren, 0 brothers or sisters, 1 parents, 0 foster children, 8 other relatives, 9 non-relatives
Size of family households: 43 2-persons, 8 3-persons, 8 4-persons, 1 5-persons, 1 6-persons, 10 7-or-more-persons.
Size of nonfamily households: 19 1-person, 5 2-persons.
47 married couples with children.
9 single-parent households (9 men, 0 women).
98.9% of residents of Lambs Grove speak English at home.
0.7% of residents speak Spanish at home (100% speak English very well).
| Here: | 7.4 |
| State: | 6.8 |
| Here: | -666666666.0 |
| State: | 4.2 |

- Bedrooms in owner-occupied houses and condos in Lambs Grove, Iowa
- 0no bedroom
- 01 bedroom
- 322 bedrooms
- 293 bedrooms
- 264 bedrooms
- 95+ bedrooms

- Bedrooms in renter-occupied apartments in Lambs Grove, Iowa
- 0no bedroom
- 01 bedroom
- 02 bedrooms
- 13 bedrooms
- 04 bedrooms
- 05+ bedrooms

- Cars and other vehicles available in Lambs Grove in owner-occupied houses/condos
- 0no vehicle
- 211 vehicle
- 472 vehicles
- 133 vehicles
- 134 vehicles
- 15+ vehicles

- Cars and other vehicles available in Lambs Grove in renter-occupied apartments
- 0no vehicle
- 01 vehicle
- 12 vehicles
- 03 vehicles
- 04 vehicles
- 05+ vehicles

- Rooms in owner-occupied houses in Lambs Grove, Iowa
- 01 room
- 02 rooms
- 13 rooms
- 14 rooms
- 115 rooms
- 146 rooms
- 277 rooms
- 88 rooms
- 339+ rooms

- Rooms in renter-occupied apartments in Lambs Grove, Iowa
- 01 room
- 02 rooms
- 03 rooms
- 04 rooms
- 05 rooms
- 06 rooms
- 17 rooms
- 08 rooms
- 09+ rooms


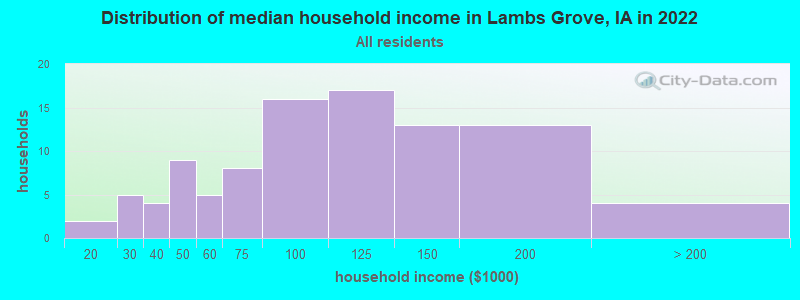
Lambs Grove, IA household income distribution

- 2$10,000 to $19,999
- 5$20,000 to $29,999
- 4$30,000 to $39,999
- 9$40,000 to $49,999
- 5$50,000 to $59,999
- 8$60,000 to $74,999
- 16$75,000 to $99,999
- 17$100,000 to $124,999
- 13$125,000 to $149,999
- 13$150,000 to $199,999
- 4$200,000 or more
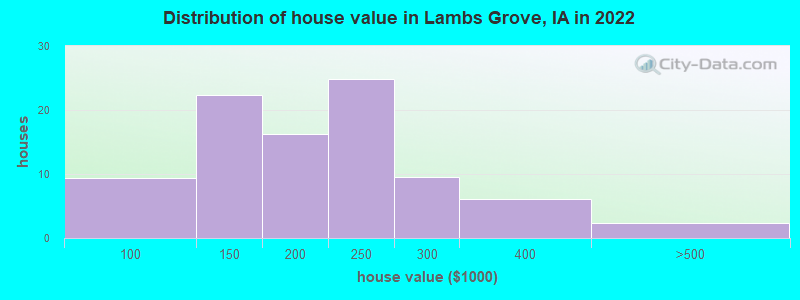
Home value of owner - occupied houses in 2022 in Lambs Grove, IA
-
- 5$80,000 to $89,999
- 3$90,000 to $99,999
- 9$100,000 to $124,999
- 12$125,000 to $149,999
- 6$150,000 to $174,999
- 9$175,000 to $199,999
- 24$200,000 to $249,999
- 9$250,000 to $299,999
- 6$300,000 to $399,999
- 2$400,000 to $499,999

Percentage of workers working in this county: 82.6%
Number of people working at home: 61 (39.4% of all workers)
Travel time to work (commute)
- Less than 5 minutes: 2
- 5 to 9 minutes: 40
- 10 to 14 minutes: 20
- 15 to 19 minutes: 1
- 20 to 24 minutes: 0
- 25 to 29 minutes: 1
- 30 to 34 minutes: 3
- 35 to 39 minutes: 1
- 40 to 44 minutes: 23
- 45 to 59 minutes: 1
- 60 to 89 minutes: 0
- 90 or more minutes: 3
Means of transportation to work:
- Drove a car alone: 110 (94.0%)
- Carpooled: 3 (2.6%)
- Bicycle: 2 (1.7%)
- Other means: 2 (1.7%)

- Unemployment by race in 2022
- Unemployment rate for White non-Hispanic residents
- 3.7%Males
- 10.8%Females

First ancestries reported:
- German: 37 (37.5%)
- American: 16 (16.2%)
- English: 11 (11.2%)
- Dutch: 6 (6.1%)
- Polish: 6 (6.1%)
- Norwegian: 2 (2.0%)
- Welsh: 1 (1.0%)
Place of birth for U.S.-born residents:
- This state: 220
- Other state: 51
- Northeast: 2
- Midwest: 21
- South: 9
- West: 18
97.1% of Lambs Grove residents lived in the same house 1 years ago.
Out of people who lived in different houses, 47.1% lived in this county.
Out of people who lived in different counties, 100.0% lived in Iowa.
| Lambs Grove: | 97.1% |
| State average: | 87.2% |
Education attainment for males 25 years and older:
- No schooling: 0
- Nursery to 4th grade: 0
- 5th and 6th grade: 0
- 7th and 8th grade: 0
- 9th grade: 0
- 10th grade: 0
- 11th grade: 0
- 12th grade, no diploma: 0
- High school graduate (or equivalency): 39
- Less than 1 year of college: 5
- Some college more than 1 year, no degree: 17
- Associate degree: 6
- Bachelor's degree: 8
- Master's degree: 6
- Professional school degree: 0
- Doctorate degree: 0

Education attainment for females 25 years and older:
- No schooling: 0
- Nursery to 4th grade: 0
- 5th and 6th grade: 0
- 7th and 8th grade: 0
- 9th grade: 0
- 10th grade: 0
- 11th grade: 1
- 12th grade, no diploma: 0
- High school graduate (or equivalency): 13
- Less than 1 year of college: 16
- Some college more than 1 year, no degree: 29
- Associate degree: 26
- Bachelor's degree: 8
- Master's degree: 8
- Professional school degree: 4
- Doctorate degree: 0


Housing units in structures:
- One, detached: 95

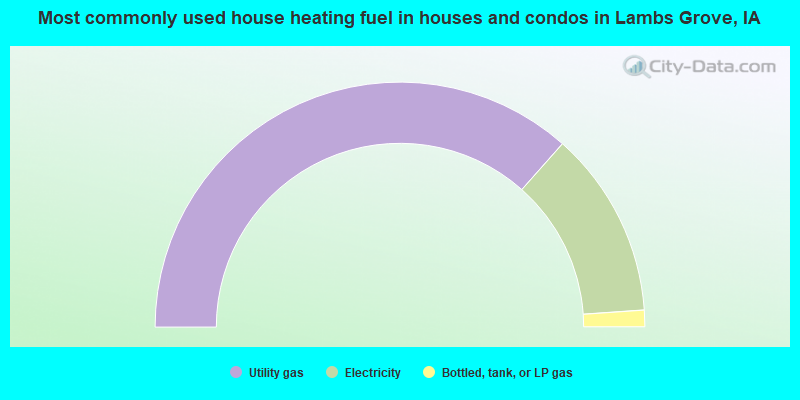
- 73.1%Utility gas
- 24.7%Electricity
- 2.2%Bottled, tank, or LP gas
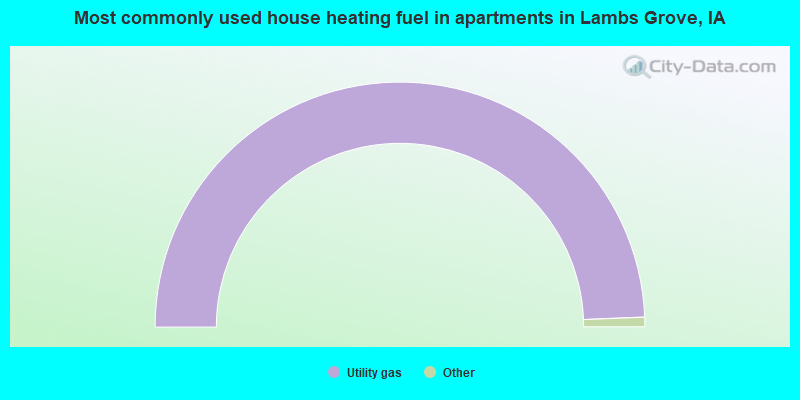
- 100.0%Utility gas
Private vs. public school enrollment:
| Here: | 6.7% |
| Iowa: | 10.6% |
| Here: | 0.0% |
| Iowa: | 7.9% |


