Housing density: 591 houses/condos per square mile
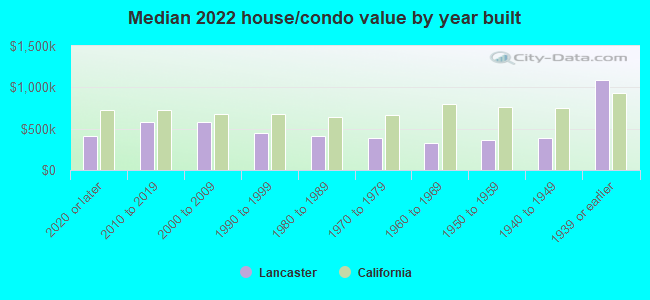
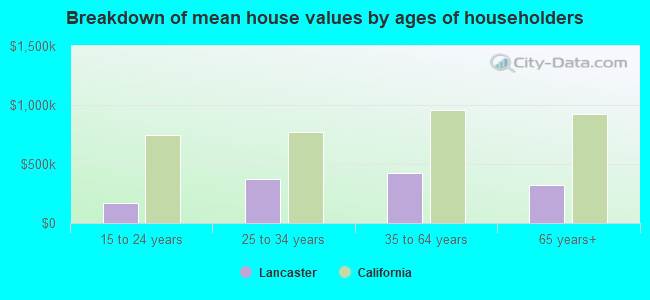
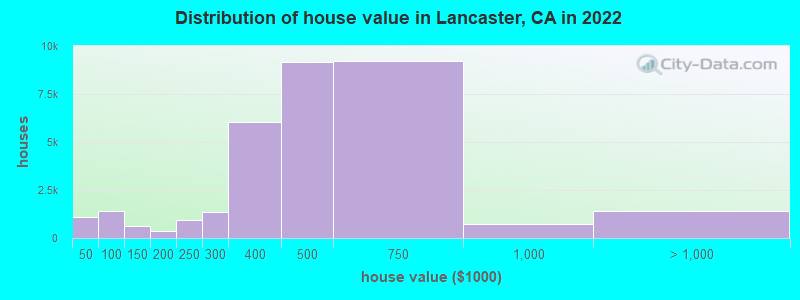
Median price asked for vacant for-sale houses and condos in 2022: $487,849.
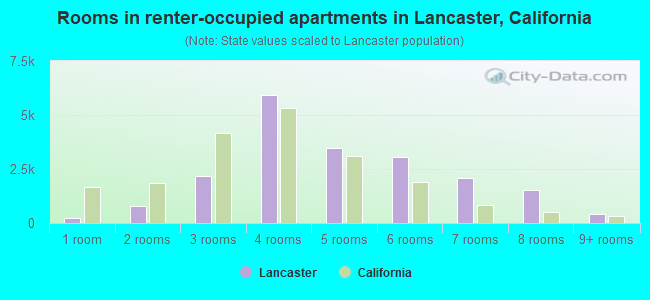
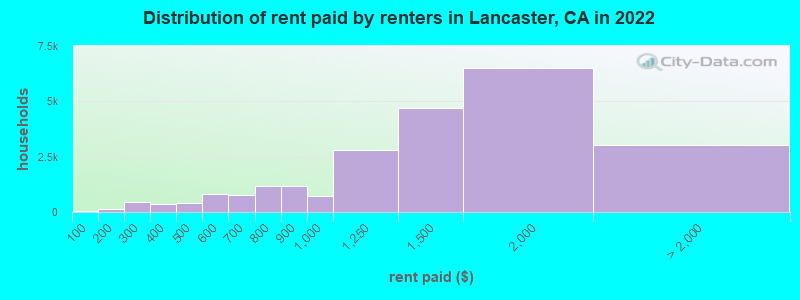
Median contract rent in 2022: $1,438 (lower quartile is $1,057, upper quartile is $1,780)
Median rent asked for vacant for-rent units in 2022: $1,212
Median gross rent in Lancaster, CA in 2022: $1,692
Housing units in Lancaster with a mortgage: 23,623 (522 second mortgage, 45 home equity loan, 307 both second mortgage and home equity loan) Houses without a mortgage: 50
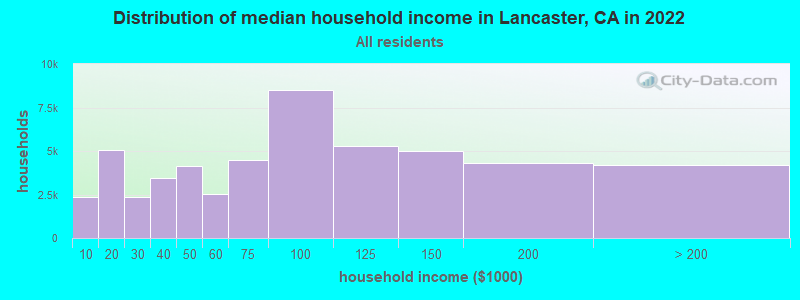
Median household income for houses/condos with a mortgage: $103,240
Median household income for apartments without a mortgage: $63,557
Size of family households: 12,027 2-persons, 9,475 3-persons, 6,239 4-persons, 5,180 5-persons, 2,756 6-persons, 2,861 7-or-more-persons.
Size of nonfamily households: 10,113 1-person, 2,698 2-persons, 319 3-persons.
20,330 married couples with children.
11,927 single-parent households (2,431 men, 9,496 women).
69.1% of residents of Lancaster speak English at home.
26.9% of residents speak Spanish at home (59% speak English very well, 22% speak English well, 13% speak English not well, 5% don't speak English at all).
1.3% of residents speak other Indo-European language at home (65% speak English very well, 27% speak English well, 4% speak English not well, 4% don't speak English at all).
2.3% of residents speak Asian or Pacific Island language at home (63% speak English very well, 25% speak English well, 11% speak English not well, 1% don't speak English at all).
1.1% of residents speak other language at home (60% speak English very well, 16% speak English well, 14% speak English not well, 10% don't speak English at all).
Foreign born population: 26,952 (15.9%)
(57.7% of them are naturalized citizens)
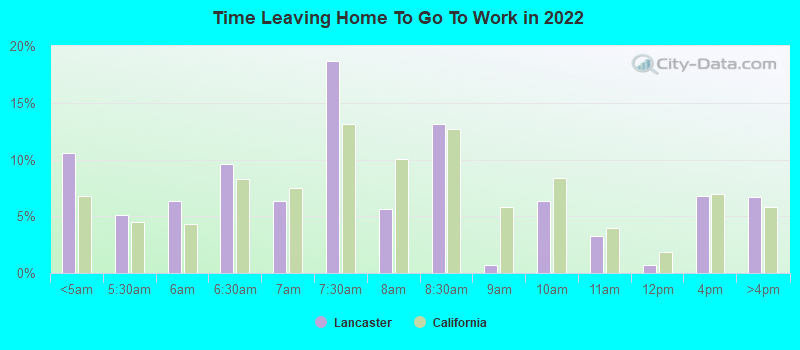
Percentage of workers working in this county: 91.2% Number of people working at home: 6,703 (10.1% of all workers)
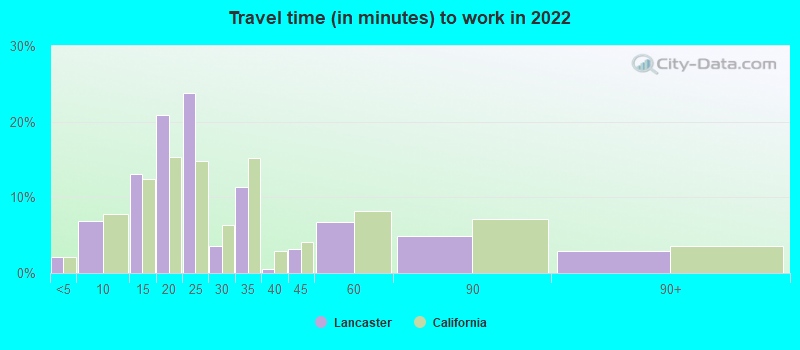
Travel time to work (commute)
Less than 5 minutes: 1,449
5 to 9 minutes: 3,801
10 to 14 minutes: 7,090
15 to 19 minutes: 12,366
20 to 24 minutes: 11,126
25 to 29 minutes: 1,540
30 to 34 minutes: 3,626
35 to 39 minutes: 1,131
40 to 44 minutes: 689
45 to 59 minutes: 5,086
60 to 89 minutes: 6,407
90 or more minutes: 5,300
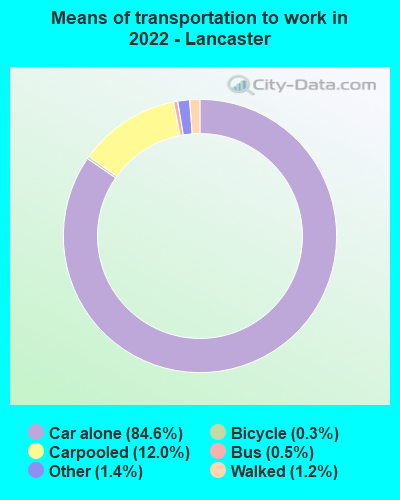
Means of transportation to work:
Drove a car alone: 43,077 (72.8%)
Carpooled: 6,747 (11.4%)
Bus: 249 (0.4%)
Subway or elevated rail: 2 (0.0%)
Taxi: 758 (1.3%)
Bicycle: 147 (0.2%)
Walked: 665 (1.1%)
Worked at home: 7,061 (11.9%)
Unemployment by race in 2022
Unemployment rate for White non-Hispanic residents
7.7%Males
12.8%Females
Unemployment rate for Black residents
11.6%Males
12.0%Females
Unemployment rate for American Indian and Alaska Native residents
6.8%Males
6.1%Females
Unemployment rate for Asian residents
0.6%Males
4.2%Females
Unemployment rate for other race residents
11.3%Males
9.8%Females
Unemployment rate for two or more race residents
7.3%Males
4.8%Females
Unemployment rate for Hispanic or Latino residents
6.6%Males
7.9%Females
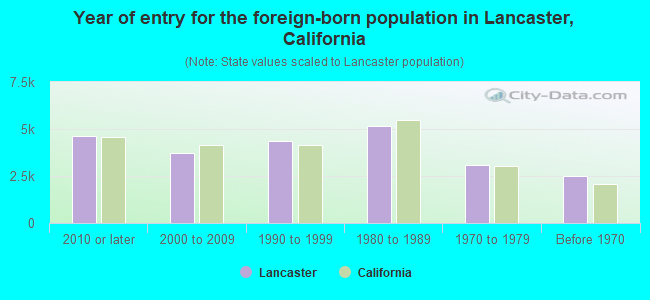
Year of entry for the foreign-born population in Lancaster, California
4,6322010 or later
3,7482000 to 2009
4,3561990 to 1999
5,1701980 to 1989
3,0961970 to 1979
2,474Before 1970
First ancestries reported:
American: 2,544 (2.3%)
German: 2,451 (2.2%)
English: 2,396 (2.2%)
Italian: 2,131 (1.9%)
Irish: 1,505 (1.4%)
African: 1,484 (1.3%)
European: 542 (0.5%)
Egyptian: 496 (0.4%)
Scottish: 458 (0.4%)
French: 408 (0.4%)
Polish: 324 (0.3%)
Australian: 318 (0.3%)
Belizean: 317 (0.3%)
Arab: 235 (0.2%)
Norwegian: 222 (0.2%)
Syrian: 220 (0.2%)
Swedish: 199 (0.2%)
Nigerian: 182 (0.2%)
Greek: 177 (0.2%)
Welsh: 164 (0.1%)
Dutch: 155 (0.1%)
Scotch-Irish: 117 (0.1%)
Northern European: 113 (0.1%)
Portuguese: 113 (0.1%)
Iranian: 105 (0.10%)
Jamaican: 104 (0.09%)
Hungarian: 98 (0.09%)
Armenian: 93 (0.08%)
Scandinavian: 77 (0.07%)
British: 73 (0.07%)
Jordanian: 66 (0.06%)
Haitian: 56 (0.05%)
French Canadian: 55 (0.05%)
Russian: 55 (0.05%)
Afghan: 52 (0.05%)
Finnish: 45 (0.04%)
Danish: 33 (0.03%)
Brazilian: 32 (0.03%)
Lebanese: 32 (0.03%)
Czech: 31 (0.03%)
Eastern European: 29 (0.03%)
Turkish: 27 (0.02%)
U.S. Virgin Islander: 27 (0.02%)
Zimbabwean: 23 (0.02%)
Cajun: 22 (0.02%)
Austrian: 22 (0.02%)
Canadian: 21 (0.02%)
Croatian: 20 (0.02%)
Serbian: 16 (0.01%)
Ethiopian: 16 (0.01%)
Belgian: 12 (0.01%)
Slovak: 12 (0.01%)
Assyrian: 12 (0.01%)
Swiss: 12 (0.01%)
Israeli: 10 (0.01%)
Luxembourger: 10 (0.01%)
Pennsylvania German: 9 (0.01%)
West Indian: 9 (0.01%)
Romanian: 7 (0.01%)
Guyanese: 6 (0.01%)
Most common places of birth for foreign-born residents (%):
Mexico
Lancaster:
38.1% (8,459)
California:
37.2% (3,881,193)
El Salvador
Lancaster:
10.2% (2,275)
California:
4.2% (440,287)
Philippines
Lancaster:
8.1% (1,799)
California:
7.8% (818,297)
Guatemala
Lancaster:
5.4% (1,198)
California:
2.8% (290,436)
Nicaragua
Lancaster:
2.5% (550)
California:
0.6% (58,161)
India
Lancaster:
2.5% (544)
California:
5.2% (539,184)
Syria
Lancaster:
1.7% (380)
California:
0.3% (30,949)
Egypt
Lancaster:
1.7% (379)
California:
0.4% (42,718)
Honduras
Lancaster:
1.7% (377)
California:
0.6% (66,590)
Peru
Lancaster:
1.7% (376)
California:
0.7% (74,025)
Belize
Lancaster:
1.6% (356)
California:
0.2% (15,693)
Australia
Lancaster:
1.5% (342)
California:
0.2% (23,338)
Place of birth for U.S.-born residents:
This state: 121,634
Other state: 19,442
Northeast: 3,297
Midwest: 5,667
South: 7,961
West: 2,517
91.4% of Lancaster residents lived in the same house 1 years ago. Out of people who lived in different houses, 40.4% lived in this county. Out of people who lived in different counties, 62.2% lived in California.
Lancaster:
91.4%
State average:
88.9%
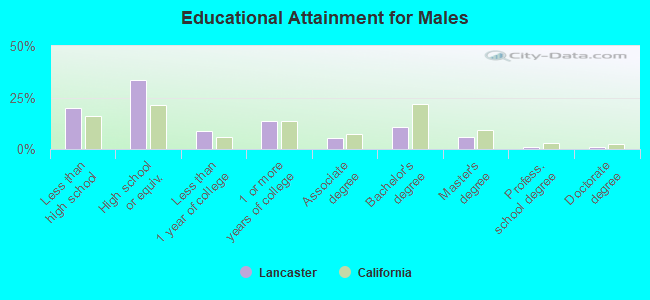
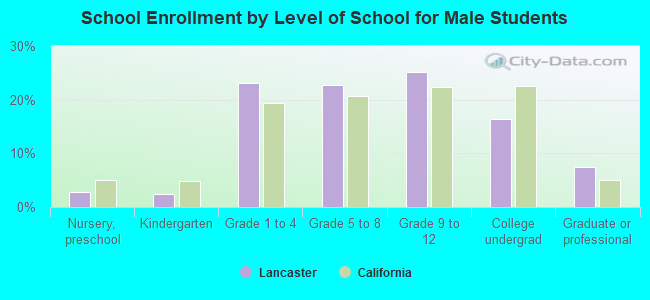
Education attainment for males 25 years and older:
No schooling: 1,820
Nursery to 4th grade: 970
5th and 6th grade: 1,341
7th and 8th grade: 595
9th grade: 1,222
10th grade: 717
11th grade: 1,800
12th grade, no diploma: 2,280
High school graduate (or equivalency): 18,281
Less than 1 year of college: 4,666
Some college more than 1 year, no degree: 7,499
Associate degree: 3,009
Bachelor's degree: 5,921
Master's degree: 3,167
Professional school degree: 402
Doctorate degree: 520
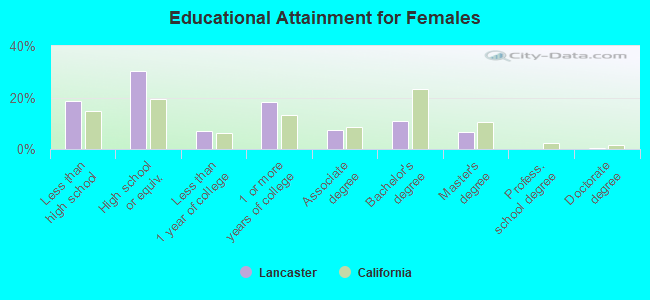
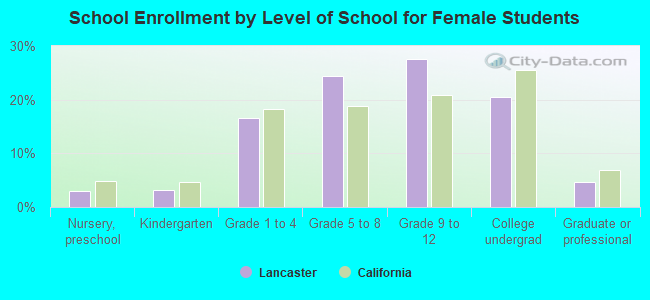
Education attainment for females 25 years and older:
No schooling: 1,203
Nursery to 4th grade: 1,035
5th and 6th grade: 1,556
7th and 8th grade: 913
9th grade: 1,302
10th grade: 1,047
11th grade: 1,133
12th grade, no diploma: 1,964
High school graduate (or equivalency): 16,540
Less than 1 year of college: 3,895
Some college more than 1 year, no degree: 10,011
Associate degree: 3,973
Bachelor's degree: 6,022
Master's degree: 3,648
Professional school degree: 44
Doctorate degree: 195
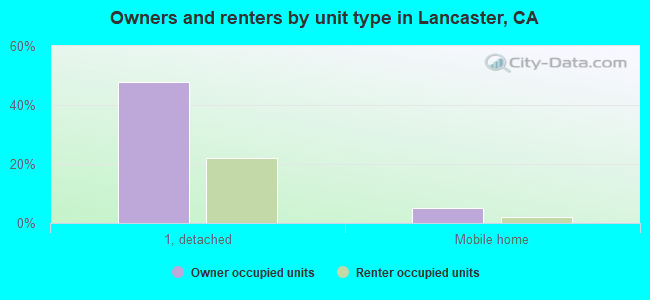
Housing units in structures:
One, detached: 39,708
One, attached: 1,108
Two: 660
3 or 4: 1,812
5 to 9: 3,120
10 to 19: 1,127
20 to 49: 1,561
50 or more: 2,244
Mobile homes: 4,026
Boats, RVs, vans, etc.: 193
Median worth of mobile homes: $81,400
Housing units lacking complete plumbing facilities in 2022: 1.4%
Housing units lacking complete kitchen facilities in 2022: 3.3%
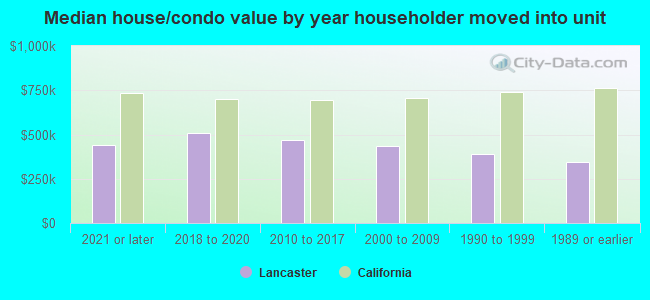
House/condo owner moved in on average 10 years ago