Landsford, SC (South Carolina) Houses and Residents
| Landsford: | $173,794 |
| South Carolina: | $254,600 |
Total population: 4,728 (Urban population: 0, Rural population: 5,023 (119 farm, 4,904 nonfarm))
Houses: 1,951 (1,813 occupied: 1,583 owner occupied, 230 renter occupied)
| % of renters here: | 13% |
| State: | 28% |
Housing density: 29 houses/condos per square mile
Median price asked for vacant for-sale houses and condos in 2022 in this county: $126,519.
Median contract rent in 2022: $736 (lower quartile is $526, upper quartile is $933)
Median rent asked for vacant for-rent units in 2022: $687
Median gross rent in Landsford, SC in 2022: $967
Housing units in Landsford with a mortgage: 466 (49 second mortgage, 60 home equity loan, 12 both second mortgage and home equity loan)
Houses without a mortgage: 258


Household type by relationship:
Households: 32,922- In family households: 28,500 (5,386 male householders, 3,687 female householders)
5,724 spouses, 9,647 children (8,850 natural, 234 adopted, 563 stepchildren), 1,631 grandchildren, 446 brothers or sisters, 318 parents, foster children, 548 other relatives, 944 non-relatives
- In nonfamily households: 4,422 (1,839 male householders (1,558 living alone)), 1,964 female householders (1,772 living alone)), 619 nonrelatives
- In group quarters: 218 (189 institutionalized population)
4,717 married couples with children.
2,923 single-parent households (495 men, 2,428 women).
97.3% of residents of Landsford speak English at home.
1.9% of residents speak Spanish at home (89% speak English very well, 10% speak English well, 1% speak English not well).
0.5% of residents speak other Indo-European language at home (88% speak English very well, 12% speak English not well).
0.3% of residents speak Asian or Pacific Island language at home (100% speak English very well).
Foreign born population: 43 (0.8%)
(107.0% of them are naturalized citizens)
| Here: | 6.2 |
| State: | 6.4 |
| Here: | 4.9 |
| State: | 4.5 |

- Bedrooms in owner-occupied houses and condos in Landsford, South Carolina
- 0no bedroom
- 321 bedroom
- 3012 bedrooms
- 1,0143 bedrooms
- 2094 bedrooms
- 275+ bedrooms

- Bedrooms in renter-occupied apartments in Landsford, South Carolina
- 1no bedroom
- 231 bedroom
- 1102 bedrooms
- 803 bedrooms
- 164 bedrooms
- 05+ bedrooms

- Cars and other vehicles available in Landsford in owner-occupied houses/condos
- 64no vehicle
- 4521 vehicle
- 7302 vehicles
- 2573 vehicles
- 594 vehicles
- 215+ vehicles

- Cars and other vehicles available in Landsford in renter-occupied apartments
- 7no vehicle
- 971 vehicle
- 1032 vehicles
- 193 vehicles
- 44 vehicles
- 05+ vehicles

- Rooms in owner-occupied houses in Landsford, South Carolina
- 01 room
- 102 rooms
- 593 rooms
- 2124 rooms
- 4585 rooms
- 4466 rooms
- 2077 rooms
- 1038 rooms
- 889+ rooms

- Rooms in renter-occupied apartments in Landsford, South Carolina
- 11 room
- 42 rooms
- 363 rooms
- 624 rooms
- 785 rooms
- 256 rooms
- 177 rooms
- 78 rooms
- 09+ rooms


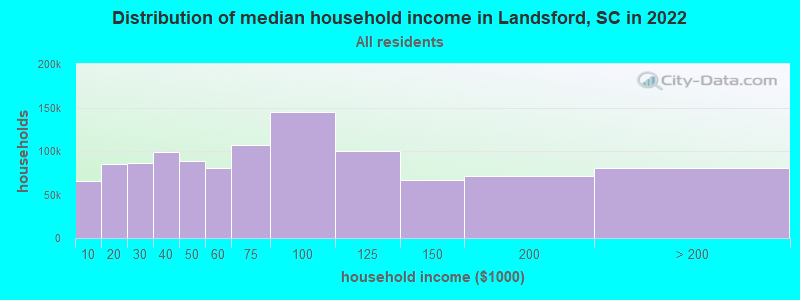
Landsford, SC household income distribution

- 45,826Less than $10,000
- 70,102$10,000 to $19,999
- 61,322$20,000 to $29,999
- 68,090$30,000 to $39,999
- 62,851$40,000 to $49,999
- 49,089$50,000 to $59,999
- 65,457$60,000 to $74,999
- 86,757$75,000 to $99,999
- 61,218$100,000 to $124,999
- 38,352$125,000 to $149,999
- 38,151$150,000 to $199,999
- 37,613$200,000 or more
Percentage of workers working in this county: 19.3%
Number of people working at home: 172 (7.4% of all workers)
Travel time to work (commute)
- Less than 5 minutes: 19
- 5 to 9 minutes: 104
- 10 to 14 minutes: 173
- 15 to 19 minutes: 357
- 20 to 24 minutes: 393
- 25 to 29 minutes: 196
- 30 to 34 minutes: 304
- 35 to 39 minutes: 63
- 40 to 44 minutes: 81
- 45 to 59 minutes: 382
- 60 to 89 minutes: 124
- 90 or more minutes: 53
Means of transportation to work:
- Drove a car alone: 1,886 (83.0%)
- Carpooled: 336 (14.8%)
- Bus or trolley bus: 10 (0.4%)
- Walked: 4 (0.2%)
- Other means: 13 (0.6%)
- Worked at home: 24 (1.1%)


- Year of entry for the foreign-born population in Landsford, South Carolina
- 31995 to March 2000
- 01990 to 1994
- 01985 to 1989
- 01980 to 1984
- 01975 to 1979
- 61970 to 1974
- 01965 to 1969
- 11Before 1965
Most common places of birth for foreign-born residents (%):
| Landsford: | 30.0% (6) |
| South Carolina: | 6.8% (7,873) |
| Landsford: | 30.0% (6) |
| South Carolina: | 0.9% (1,082) |
| Landsford: | 25.0% (5) |
| South Carolina: | 1.3% (1,526) |
| Landsford: | 15.0% (3) |
| South Carolina: | 1.4% (1,599) |
Place of birth for U.S.-born residents:
- This state: 3,512
- Other state: 1,490
- Northeast: 266
- Midwest: 204
- South: 970
- West: 50
63% of Landsford residents lived in the same house 5 years ago.
Out of people who lived in different houses, 27% lived in this county.
Out of people who lived in different counties, 66% lived in South Carolina.
Education attainment for males 25 years and older:
- No schooling: 8
- Nursery to 4th grade: 5
- 5th and 6th grade: 40
- 7th and 8th grade: 74
- 9th grade: 92
- 10th grade: 112
- 11th grade: 61
- 12th grade, no diploma: 91
- High school graduate (or equivalency): 604
- Less than 1 year of college: 91
- Some college more than 1 year, no degree: 190
- Associate degree: 86
- Bachelor's degree: 66
- Master's degree: 23
- Professional school degree: 6
- Doctorate degree: 11

Education attainment for females 25 years and older:
- No schooling: 4
- Nursery to 4th grade: 7
- 5th and 6th grade: 47
- 7th and 8th grade: 67
- 9th grade: 68
- 10th grade: 83
- 11th grade: 75
- 12th grade, no diploma: 70
- High school graduate (or equivalency): 583
- Less than 1 year of college: 107
- Some college more than 1 year, no degree: 201
- Associate degree: 122
- Bachelor's degree: 87
- Master's degree: 35
- Professional school degree: 6
- Doctorate degree: 15


Housing units in structures:
- One, detached: 1,040
- One, attached: 6
- Two: 35
- 5 to 9: 2
- 10 to 19: 12
- Mobile homes: 844
- Boats, RVs, vans, etc.: 12
Median worth of mobile homes: $80,161
Housing units lacking complete kitchen facilities: 1.5%

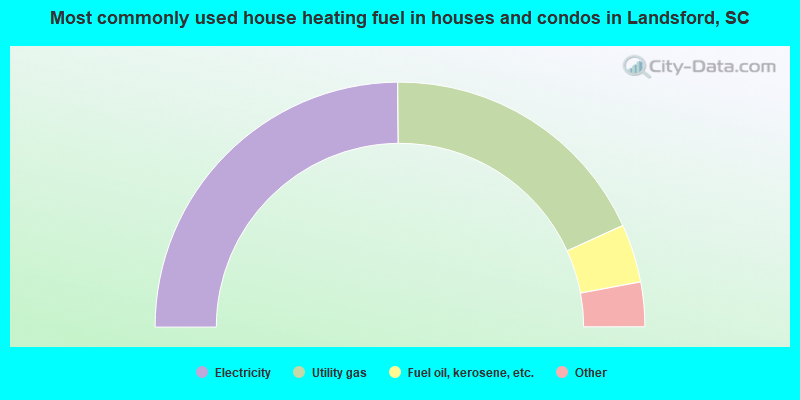
- 49.7%Electricity
- 36.7%Utility gas
- 7.7%Fuel oil, kerosene, etc.
- 4.0%Bottled, tank, or LP gas
- 1.6%Wood
- 0.4%Solar energy
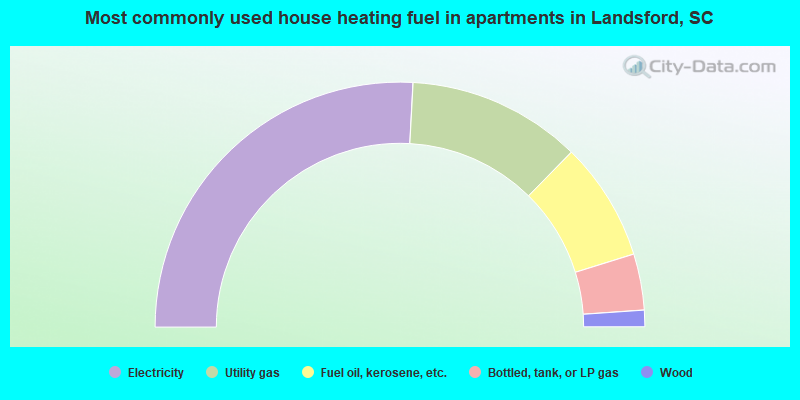
- 51.7%Electricity
- 23.0%Utility gas
- 15.7%Fuel oil, kerosene, etc.
- 7.4%Bottled, tank, or LP gas
- 2.2%Wood
Private vs. public school enrollment:
| Here: | 6.0% |
| South Carolina: | 9.2% |
| Here: | 4.8% |
| South Carolina: | 8.1% |
| Here: | 29.1% |
| South Carolina: | 20.3% |


