Jump to a detailed profile or search site with Google Custom Search

Lansdowne-Baltimore Highlands, MD (Maryland) Houses and Residents

Estimated median house or condo value in 2022: $251,461 (it was $95,900 in 2000)
Lansdowne-Baltimore Highlands:

$251,461
Maryland:

$398,100
Lower value quartile - upper value quartile: $189,926 - $309,130

Total population: 16,370 (Urban population: 15,724, Rural population: 0)

Houses: 6,041 (5,796 occupied: 3,150 owner occupied, 2,646 renter occupied)

% of renters here:

46%
State:

32%

Housing density: 1,474 houses/condos per square mile

Median price asked for vacant for-sale houses and condos in 2022 in this county: $215,354.

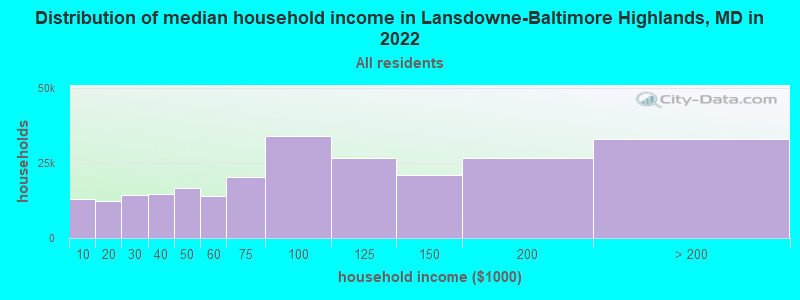
Median contract rent in 2022: $1,041 (lower quartile is $880, upper quartile is $1,189)


Median rent asked for vacant for-rent units in 2022: $1,167


Median gross rent in Lansdowne-Baltimore Highlands, MD in 2022: $1,206

Housing units in Lansdowne-Baltimore Highlands with a mortgage: 2,026 (402 second mortgage, 180 home equity loan, 7 both second mortgage and home equity loan)
Houses without a mortgage: 938

Compare current foreclosures near Lansdowne-Baltimore Highlands, MD:

Powered by Foreclosure.com


Lansdowne-Baltimore Highlands, MD forum
Discuss Lansdowne-Baltimore Highlands, Maryland housing on our local forum with over 2,400,000 registered users
Lansdowne-Baltimore Highlands, Maryland Age and Sex of Residents

Household type by relationship:

Households: 784,248
  • In family households: 644,097 (132,622 male householders, 72,491 female householders)
    144,119 spouses, 221,400 children (206,732 natural, 5,221 adopted, 9,447 stepchildren), 18,508 grandchildren, 9,101 brothers or sisters, 8,851 parents, foster children, 11,414 other relatives, 20,131 non-relatives
  • In nonfamily households: 140,151 (46,803 male householders (35,220 living alone)), 64,799 female householders (54,258 living alone)), 28,549 nonrelatives
  • In group quarters: 20,781 (8,128 institutionalized population)

115,770 married couples with children.
43,547 single-parent households (8,990 men, 34,557 women).

92.1% of residents of Lansdowne-Baltimore Highlands speak English at home.
3.8% of residents speak Spanish at home (61% speak English very well, 16% speak English well, 14% speak English not well, 8% don't speak English at all).
1.8% of residents speak other Indo-European language at home (63% speak English very well, 27% speak English well, 5% speak English not well, 4% don't speak English at all).
2.2% of residents speak Asian or Pacific Island language at home (24% speak English very well, 39% speak English well, 33% speak English not well, 4% don't speak English at all).
0.1% of residents speak other language at home (43% speak English very well, 57% speak English well).

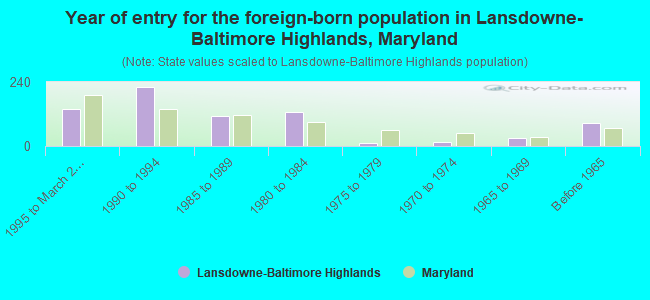
Foreign born population: 1,526 (8.7%)
(51.8% of them are naturalized citizens)

Median number of rooms in houses and condos:
Here:

5.9
State:

7.3

Median number of rooms in apartments
Here:

4.2
State:

4.2

Owner-occupied Renter-occupied
Bedrooms in owner-occupied houses and condos in Lansdowne-Baltimore Highlands, Maryland
  • Bedrooms in owner-occupied houses and condos in Lansdowne-Baltimore Highlands, Maryland
  • 0no bedroom
  • 581 bedroom
  • 6812 bedrooms
  • 1,8973 bedrooms
  • 4454 bedrooms
  • 695+ bedrooms
Bedrooms in renter-occupied apartments in Lansdowne-Baltimore Highlands, Maryland
  • Bedrooms in renter-occupied apartments in Lansdowne-Baltimore Highlands, Maryland
  • 43no bedroom
  • 4221 bedroom
  • 1,6162 bedrooms
  • 5323 bedrooms
  • 274 bedrooms
  • 65+ bedrooms
Owner-occupied Renter-occupied
Cars and other vehicles available in Lansdowne-Baltimore Highlands in owner-occupied houses/condos
  • Cars and other vehicles available in Lansdowne-Baltimore Highlands in owner-occupied houses/condos
  • 196no vehicle
  • 1,0001 vehicle
  • 1,2572 vehicles
  • 5773 vehicles
  • 724 vehicles
  • 485+ vehicles
Cars and other vehicles available in Lansdowne-Baltimore Highlands in renter-occupied apartments
  • Cars and other vehicles available in Lansdowne-Baltimore Highlands in renter-occupied apartments
  • 780no vehicle
  • 1,3341 vehicle
  • 4312 vehicles
  • 903 vehicles
  • 114 vehicles
  • 05+ vehicles
Owner-occupied Renter-occupied
Rooms in owner-occupied houses in Lansdowne-Baltimore Highlands, Maryland
  • Rooms in owner-occupied houses in Lansdowne-Baltimore Highlands, Maryland
  • 01 room
  • 02 rooms
  • 683 rooms
  • 3184 rooms
  • 9255 rooms
  • 8336 rooms
  • 4917 rooms
  • 2628 rooms
  • 2539+ rooms
Rooms in renter-occupied apartments in Lansdowne-Baltimore Highlands, Maryland
  • Rooms in renter-occupied apartments in Lansdowne-Baltimore Highlands, Maryland
  • 111 room
  • 1732 rooms
  • 2423 rooms
  • 1,2694 rooms
  • 6415 rooms
  • 2396 rooms
  • 207 rooms
  • 268 rooms
  • 259+ rooms
Year house built
Breakdown of mean house values by ages of householders
Owners and renters by unit type in Lansdowne-Baltimore Highlands, MD
  • Lansdowne-Baltimore Highlands, MD household income distribution

  • Distribution of median household income in Lansdowne-Baltimore Highlands, MD in 2022
  • 13,182Less than $10,000
  • 12,354$10,000 to $19,999
  • 14,472$20,000 to $29,999
  • 14,614$30,000 to $39,999
  • 16,767$40,000 to $49,999
  • 13,906$50,000 to $59,999
  • 20,522$60,000 to $74,999
  • 34,101$75,000 to $99,999
  • 26,715$100,000 to $124,999
  • 21,089$125,000 to $149,999
  • 26,622$150,000 to $199,999
  • 33,205$200,000 or more

Percentage of workers working in this county: 33.1%
Number of people working at home: 1,320 (16.2% of all workers)

Travel time to work (commute)

  • Less than 5 minutes: 180
  • 5 to 9 minutes: 622
  • 10 to 14 minutes: 975
  • 15 to 19 minutes: 1,480
  • 20 to 24 minutes: 1,283
  • 25 to 29 minutes: 380
  • 30 to 34 minutes: 923
  • 35 to 39 minutes: 112
  • 40 to 44 minutes: 145
  • 45 to 59 minutes: 346
  • 60 to 89 minutes: 358
  • 90 or more minutes: 257

Means of transportation to work:

  • Drove a car alone: 5,222 (73.4%)
  • Carpooled: 1,021 (14.4%)
  • Bus or trolley bus: 389 (5.5%)
  • Streetcar or trolley car: 12 (0.2%)
  • Subway or elevated: 39 (0.5%)
  • Railroad: 41 (0.6%)
  • Taxi: 54 (0.8%)
  • Bicycle: 22 (0.3%)
  • Walked: 189 (2.7%)
  • Other means: 72 (1.0%)
  • Worked at home: 51 (0.7%)
Class of Workers in 2000
Year of entry for the foreign-born population in Lansdowne-Baltimore Highlands, Maryland
  • Year of entry for the foreign-born population in Lansdowne-Baltimore Highlands, Maryland
  • 1391995 to March 2000
  • 2221990 to 1994
  • 1141985 to 1989
  • 1291980 to 1984
  • 121975 to 1979
  • 141970 to 1974
  • 291965 to 1969
  • 86Before 1965
Ancestries in Lansdowne-Baltimore Highlands, MD <small>(Other ancestries excluded from the graph)</small>

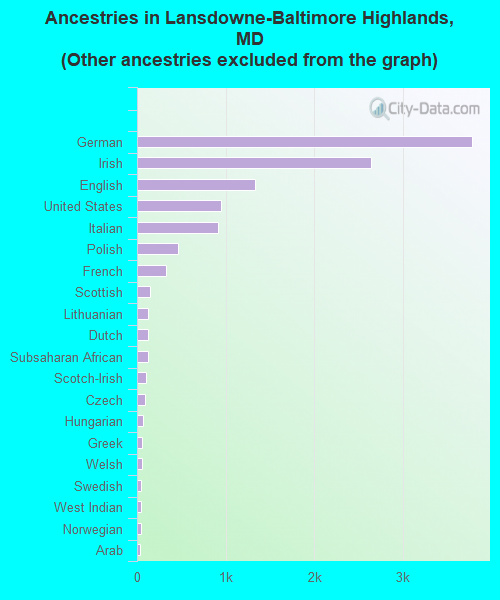
First ancestries reported:

  • Other: 4,106 (26.2%)
  • German: 3,784 (24.2%)
  • Irish: 2,638 (16.8%)
  • English: 1,332 (8.5%)
  • United States: 953 (6.1%)
  • Italian: 918 (5.9%)
  • Polish: 464 (3.0%)
  • French: 322 (2.1%)
  • Scottish: 147 (0.9%)
  • Lithuanian: 129 (0.8%)
  • Dutch: 121 (0.8%)
  • Subsaharan African: 120 (0.8%)
  • Scotch-Irish: 101 (0.6%)
  • Czech: 92 (0.6%)
  • Hungarian: 72 (0.5%)
  • Greek: 61 (0.4%)
  • Welsh: 52 (0.3%)
  • Swedish: 49 (0.3%)
  • West Indian: 47 (0.3%)
  • Norwegian: 43 (0.3%)
  • Arab: 37 (0.2%)
  • Ukrainian: 27 (0.2%)
  • Russian: 18 (0.1%)
  • French Canadian: 15 (0.10%)
  • Slovak: 12 (0.08%)
  • Swiss: 7 (0.04%)

Most common places of birth for foreign-born residents (%):

El Salvador
Lansdowne-Baltimore Highlands:

18.4% (137)
Maryland:

8.1% (41,818)

Philippines
Lansdowne-Baltimore Highlands:

13.8% (103)
Maryland:

4.1% (21,007)

Mexico
Lansdowne-Baltimore Highlands:

7.2% (54)
Maryland:

3.7% (19,287)

China, excluding Hong Kong and Taiwan
Lansdowne-Baltimore Highlands:

6.7% (50)
Maryland:

4.4% (22,741)

Vietnam
Lansdowne-Baltimore Highlands:

6.6% (49)
Maryland:

2.9% (14,807)

Korea
Lansdowne-Baltimore Highlands:

5.6% (42)
Maryland:

6.0% (31,249)

Pakistan
Lansdowne-Baltimore Highlands:

5.1% (38)
Maryland:

1.4% (7,183)

India
Lansdowne-Baltimore Highlands:

4.3% (32)
Maryland:

6.2% (32,276)

Haiti
Lansdowne-Baltimore Highlands:

3.6% (27)
Maryland:

1.0% (5,367)

Malaysia
Lansdowne-Baltimore Highlands:

3.0% (22)
Maryland:

0.2% (945)

Dominican Republic
Lansdowne-Baltimore Highlands:

3.0% (22)
Maryland:

1.0% (5,419)

United Kingdom
Lansdowne-Baltimore Highlands:

2.6% (19)
Maryland:

2.7% (14,206)

Other South Eastern Asia
Lansdowne-Baltimore Highlands:

2.4% (18)
Maryland:

0.2% (1,259)

Taiwan
Lansdowne-Baltimore Highlands:

2.3% (17)
Maryland:

1.5% (7,928)

Greece
Lansdowne-Baltimore Highlands:

2.1% (16)
Maryland:

0.8% (4,214)

Jamaica
Lansdowne-Baltimore Highlands:

2.0% (15)
Maryland:

3.7% (18,988)

Egypt
Lansdowne-Baltimore Highlands:

1.9% (14)
Maryland:

0.5% (2,477)

Argentina
Lansdowne-Baltimore Highlands:

1.7% (13)
Maryland:

0.6% (2,999)

Chile
Lansdowne-Baltimore Highlands:

1.7% (13)
Maryland:

0.6% (3,146)

Place of birth for U.S.-born residents:

  • This state: 12,852
  • Other state: 2,016
  • Northeast: 595
  • Midwest: 190
  • South: 1,094
  • West: 137

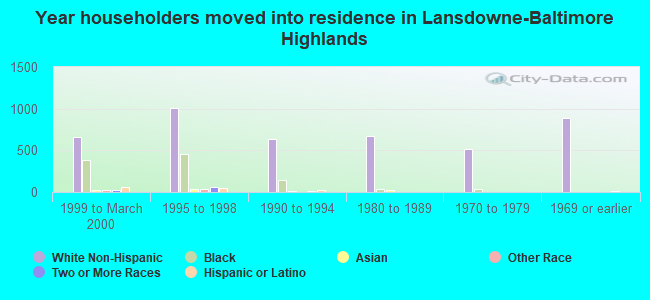
56% of Lansdowne-Baltimore Highlands residents lived in the same house 5 years ago.
   Out of people who lived in different houses, 38% lived in this county.
   Out of people who lived in different counties, 86% lived in Maryland.

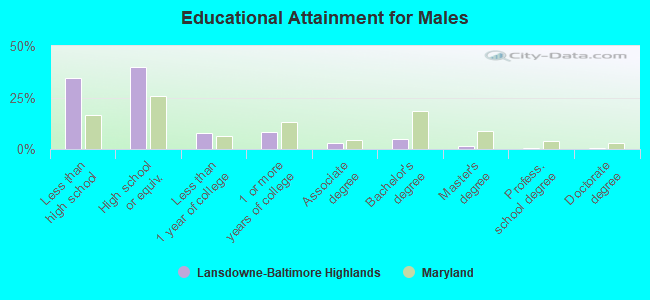
Education attainment for males 25 years and older:

  • No schooling: 65
  • Nursery to 4th grade: 25
  • 5th and 6th grade: 104
  • 7th and 8th grade: 278
  • 9th grade: 224
  • 10th grade: 338
  • 11th grade: 232
  • 12th grade, no diploma: 242
  • High school graduate (or equivalency): 1,752
  • Less than 1 year of college: 335
  • Some college more than 1 year, no degree: 363
  • Associate degree: 117
  • Bachelor's degree: 203
  • Master's degree: 66
  • Professional school degree: 26
  • Doctorate degree: 12
Educational Attainment for Males

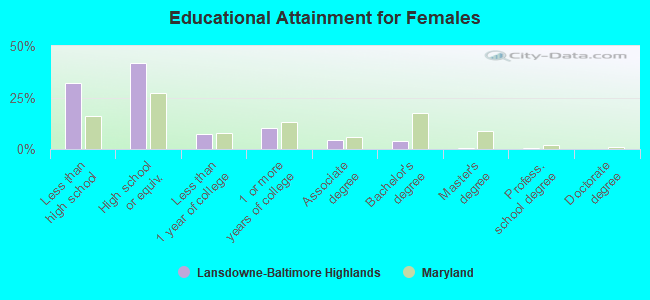
Education attainment for females 25 years and older:

  • No schooling: 56
  • Nursery to 4th grade: 0
  • 5th and 6th grade: 82
  • 7th and 8th grade: 318
  • 9th grade: 323
  • 10th grade: 385
  • 11th grade: 246
  • 12th grade, no diploma: 237
  • High school graduate (or equivalency): 2,134
  • Less than 1 year of college: 374
  • Some college more than 1 year, no degree: 514
  • Associate degree: 226
  • Bachelor's degree: 190
  • Master's degree: 14
  • Professional school degree: 13
  • Doctorate degree: 10
Educational Attainment for Females
Lansdowne-Baltimore Highlands marital status for males
Lansdowne-Baltimore Highlands marital status for females

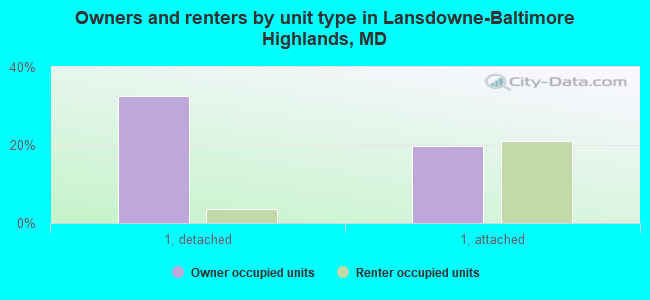
Housing units in structures:

  • One, detached: 2,164
  • One, attached: 2,461
  • Two: 79
  • 3 or 4: 138
  • 5 to 9: 211
  • 10 to 19: 564
  • 20 to 49: 190
  • 50 or more: 156
  • Mobile homes: 68
  • Boats, RVs, vans, etc.: 10

Median worth of mobile homes: $67,964

Housing units lacking complete plumbing facilities: 0.5%

Housing units lacking complete kitchen facilities: 0.2%
Year householders moved into residence in Lansdowne-Baltimore Highlands
Houses and condos Apartments
Most commonly used house heating fuel in houses and condos in Lansdowne-Baltimore Highlands, MD
  • 71.9%Utility gas
  • 15.4%Fuel oil, kerosene, etc.
  • 11.0%Electricity
  • 1.0%Bottled, tank, or LP gas
  • 0.5%Wood
  • 0.2%Other fuel
Most commonly used house heating fuel in apartments in Lansdowne-Baltimore Highlands, MD
  • 80.1%Utility gas
  • 14.4%Electricity
  • 4.5%Fuel oil, kerosene, etc.
  • 1.0%Bottled, tank, or LP gas

Private vs. public school enrollment:

Students in private schools in grades 1 to 8 (elementary and middle school): 112
Here:

5.5%
Maryland:

14.8%

Students in private schools in grades 9 to 12 (high school): 21
Here:

2.3%
Maryland:

13.3%

Students in private undergraduate colleges: 49
Here:

10.6%
Maryland:

21.7%
School Enrollment by Level of School for Male Students
School Enrollment by Level of School for Female Students
Age and Sex of Sensory-Disabled Noninstitutionalized Residents
Age and Sex of Physically-Disabled Noninstitutionalized Residents
Age and Sex of Mentally-Disabled Noninstitutionalized Residents
Age and Sex of Self-Care Disabled Noninstitutionalized Residents
Age and Sex of Go-Outside-Home Disabled Noninstitutionalized Residents
Age and Sex of Noninstitutionalized Residents with Employment Disability