Lansing, KS (Kansas) Houses and Residents
| Lansing: | $253,910 |
| Kansas: | $206,600 |
Mean price in 2022:
Detached houses: $305,842
Here: $305,842 State: $264,181 Townhouses or other attached units: $142,773
Here: $142,773 State: $219,178 Mobile homes: $43,873
Here: $43,873 State: $74,712
Total population: 11,713 (Urban population: 8,840 (all inside urban clusters), Rural population: 296 (all nonfarm))
Houses: 3,862 (3,714 occupied: 2,990 owner occupied, 778 renter occupied)
| % of renters here: | 21% |
| State: | 32% |
Housing density: 453 houses/condos per square mile
Median price asked for vacant for-sale houses and condos in 2022 in this county: $216,293.
Median contract rent in 2022: $999 (lower quartile is $808, upper quartile is $1,553)
Median rent asked for vacant for-rent units in 2022: $9,319
Median gross rent in Lansing, KS in 2022: $1,271
Housing units in Lansing with a mortgage: 2,062 (126 second mortgage, 0 home equity loan, 106 both second mortgage and home equity loan)
Houses without a mortgage: 0
Median household income for houses/condos with a mortgage: $91,919
Median household income for apartments without a mortgage: $96,619
Median monthly housing costs: $1,316
Compare current foreclosures near Lansing, KS:
| Photo | Address | Area | Beds / Baths | Price | Details |
|---|---|---|---|---|---|

|
#1
Continental Dr
Lansing, KS 66043
|
2,098 sq. feet
|
3 baths 4 beds |
show details | |

|
#2
Canyon View Dr
Lansing, KS 66043
|
2,453 sq. feet
|
2 baths 3 beds |
show details | |

|
#3
Timber Creek Cir
Lansing, KS 66043
|
1,894 sq. feet
|
2 baths 3 beds |
show details | |

|
#4
Oakbrook Dr
Lansing, KS 66043
|
1,972 sq. feet
|
2 baths 3 beds |
show details | |

|
#5
Bittersweet Ln
Lansing, KS 66043
|
1,422 sq. feet
|
2 baths 3 beds |
show details | |

|
#6
Carriage Crossing Rd
Lansing, KS 66043
|
2,016 sq. feet
|
2 baths 4 beds |
show details | |

|
#7
W Kay St
Lansing, KS 66043
|
1,152 sq. feet
|
1 baths 3 beds |
show details | |

|
#8
Willow Ct
Lansing, KS 66043
|
1,589 sq. feet
|
2 baths 3 beds |
show details | |

|
#9
N 8th St
Lansing, KS 66043
|
1,764 sq. feet
|
1 baths 3 beds |
show details | |

|
#10
Bittersweet Ln
Lansing, KS 66043
|
3,574 sq. feet
|
3 baths 5 beds |
show details |
| Photo | Address | Area | Beds / Baths | Price | Details |
|---|---|---|---|---|---|

|
#11
Fairlane St
Lansing, KS 66043
|
925 sq. feet
|
1 baths 3 beds |
show details | |

|
#12
Reagan Dr
Lansing, KS 66043
|
- sq. feet
|
- baths - beds |
show details | |

|
#13
S Ethel Ln
Lansing, KS 66043
|
- sq. feet
|
- baths - beds |
show details | |

|
#14
Holiday Dr
Lansing, KS 66043
|
- sq. feet
|
- baths - beds |
show details | |

|
#15
Crestview Ter
Lansing, KS 66043
|
- sq. feet
|
- baths - beds |
show details | |

|
#16
4h Rd
Lansing, KS 66043
|
- sq. feet
|
- baths - beds |
show details | |

|
#17
Hithergreen Ct
Lansing, KS 66043
|
- sq. feet
|
- baths - beds |
show details | |

|
#18
W Eisenhower Rd # A14
Lansing, KS 66043
|
- sq. feet
|
8 baths - beds |
show details | |

|
#19
Walker Ave
Kansas City, KS 66104
|
1,540 sq. feet
|
2 baths 3 beds |
$104,900
|
show details |

|
#20
Pleasant St
Tonganoxie, KS 66086
|
884 sq. feet
|
1 baths 2 beds |
show details |
| Photo | Address | Area | Beds / Baths | Price | Details |
|---|---|---|---|---|---|

|
#21
N 3rd St
Leavenworth, KS 66048
|
2,520 sq. feet
|
2 baths 4 beds |
show details | |

|
#22
NW 67th Ct
Kansas City, MO 64152
|
2,212 sq. feet
|
4 baths 5 beds |
show details | |

|
#23
Pottawatomie St
Leavenworth, KS 66048
|
2,651 sq. feet
|
2 baths 5 beds |
show details | |

|
#24
Haskell Ave
Kansas City, KS 66109
|
1,230 sq. feet
|
1 baths 2 beds |
show details | |

|
#25
N 45th St
Kansas City, KS 66104
|
1,120 sq. feet
|
1 baths 3 beds |
show details | |

|
#26
N London Ave
Kansas City, MO 64151
|
1,650 sq. feet
|
3 baths 4 beds |
show details | |

|
#27
S 104th Ter
Kansas City, KS 66111
|
1,430 sq. feet
|
2 baths 3 beds |
show details | |

|
#28
Ridge Ave
Kansas City, KS 66111
|
888 sq. feet
|
1 baths 2 beds |
show details | |

|
#29
N 75th St
Kansas City, KS 66109
|
1,056 sq. feet
|
1 baths 3 beds |
show details | |

|
#30
Cernech Rd
Kansas City, KS 66104
|
1,728 sq. feet
|
2 baths 3 beds |
show details |
| Photo | Address | Area | Beds / Baths | Price | Details |
|---|---|---|---|---|---|

|
#31
N 89th Ct
Kansas City, KS 66112
|
2,368 sq. feet
|
4 baths 6 beds |
show details | |

|
#32
Swartz Rd
Kansas City, KS 66106
|
900 sq. feet
|
1 baths 2 beds |
show details | |

|
#33
S 137th St
Bonner Springs, KS 66012
|
1,284 sq. feet
|
2 baths 3 beds |
show details | |

|
#34
Kimball Ave
Kansas City, KS 66104
|
1,268 sq. feet
|
1 baths 2 beds |
show details | |

|
#35
Orville Ave
Kansas City, KS 66102
|
852 sq. feet
|
1 baths 2 beds |
show details | |

|
#36
NW 75th St
Kansas City, MO 64118
|
1,260 sq. feet
|
2 baths 3 beds |
show details | |

|
#37
Freeman Ave
Kansas City, KS 66102
|
1,172 sq. feet
|
1 baths 2 beds |
show details | |

|
#38
N 31st St
Kansas City, KS 66104
|
798 sq. feet
|
1 baths 2 beds |
show details | |

|
#39
N 80th St
Kansas City, KS 66112
|
2,859 sq. feet
|
3 baths 4 beds |
show details | |

|
#40
Waverly Ave
Kansas City, KS 66109
|
1,224 sq. feet
|
2 baths 3 beds |
show details |
| Photo | Address | Area | Beds / Baths | Price | Details |
|---|---|---|---|---|---|

|
#41
N 83rd Dr
Kansas City, KS 66112
|
1,325 sq. feet
|
1 baths 3 beds |
show details | |

|
#42
N 32nd St
Kansas City, KS 66104
|
672 sq. feet
|
1 baths 2 beds |
show details | |

|
#43
Clare Rd
Shawnee, KS 66226
|
2,388 sq. feet
|
2 baths 3 beds |
show details | |

|
#44
Brownridge Dr
Shawnee, KS 66218
|
1,896 sq. feet
|
2 baths 3 beds |
show details | |

|
#45
N 80th St
Kansas City, KS 66112
|
1,888 sq. feet
|
2 baths 4 beds |
show details | |

|
#46
Haskell Ave
Kansas City, KS 66104
|
2,196 sq. feet
|
2 baths 3 beds |
show details | |

|
#47
N 15th St
Kansas City, KS 66104
|
1,077 sq. feet
|
1 baths 3 beds |
show details | |

|
#48
N 52nd Ter
Kansas City, KS 66104
|
1,109 sq. feet
|
1 baths 3 beds |
show details | |

|
#49
Oakland Ave
Kansas City, KS 66112
|
2,635 sq. feet
|
2 baths 4 beds |
show details | |

|
Check over 1 million property listings on Foreclosure.com!
|
browse all offers | |||

Latest news about housing in Lansing, KS collected exclusively by city-data.com from local newspapers, TV, and radio stations

 | What to expect as a single, POC guy? (42 replies) |
| BAD Parts of Kansas to avoid (0 replies) |
| Some general questions about Kansas (134 replies) |
| Moving to Fort Leavensworth, KS (2 replies) |
| RADICALLY incorrect population data (7 replies) |
| Ex "City Boy" yearns to become a "Country Boy" (67 replies) |

Median year apartment built: 1985
Household type by relationship:
Households: 11,369- Male householders: 2,058 (578 living alone), Female householders: 1,617 (299 living alone)
1,963 spouses (1,938 opposite-sex spouses), 97 unmarried partners, (97 opposite-sex unmarried partners), 3,189 children (2,907 natural, 151 adopted, 130 stepchildren), 296 grandchildren, 181 brothers or sisters, 55 parents, 0 foster children, 81 other relatives, 185 non-relatives
- In group quarters: 1,640
Size of family households: 1,029 2-persons, 493 3-persons, 651 4-persons, 199 5-persons, 243 6-persons, 15 7-or-more-persons.
Size of nonfamily households: 1,030 1-person, 120 2-persons, 17 4-persons.
1,785 married couples with children.
586 single-parent households (303 men, 283 women).
95.1% of residents of Lansing speak English at home.
2.3% of residents speak Spanish at home (87% speak English very well, 12% speak English well, 1% speak English not well).
1.1% of residents speak other Indo-European language at home (50% speak English very well, 20% speak English not well, 30% don't speak English at all).
0.7% of residents speak Asian or Pacific Island language at home (31% speak English very well, 69% speak English well).
0.9% of residents speak other language at home (91% speak English very well, 9% speak English well).
Foreign born population: 670 (5.9%)
(33.1% of them are naturalized citizens)
| Here: | 7.6 |
| State: | 6.9 |
| Here: | 5.5 |
| State: | 4.4 |

- Bedrooms in owner-occupied houses and condos in Lansing, Kansas
- 0no bedroom
- 271 bedroom
- 3242 bedrooms
- 1,1473 bedrooms
- 1,2944 bedrooms
- 1995+ bedrooms

- Bedrooms in renter-occupied apartments in Lansing, Kansas
- 0no bedroom
- 311 bedroom
- 4172 bedrooms
- 1403 bedrooms
- 1414 bedrooms
- 505+ bedrooms

- Cars and other vehicles available in Lansing in owner-occupied houses/condos
- 39no vehicle
- 4061 vehicle
- 1,5142 vehicles
- 7573 vehicles
- 2054 vehicles
- 685+ vehicles

- Cars and other vehicles available in Lansing in renter-occupied apartments
- 57no vehicle
- 2571 vehicle
- 3632 vehicles
- 1033 vehicles
- 04 vehicles
- 05+ vehicles

- Rooms in owner-occupied houses in Lansing, Kansas
- 01 room
- 02 rooms
- 83 rooms
- 1354 rooms
- 3245 rooms
- 4076 rooms
- 3667 rooms
- 8028 rooms
- 9499+ rooms

- Rooms in renter-occupied apartments in Lansing, Kansas
- 01 room
- 122 rooms
- 2163 rooms
- 984 rooms
- 1395 rooms
- 1226 rooms
- 687 rooms
- 518 rooms
- 719+ rooms


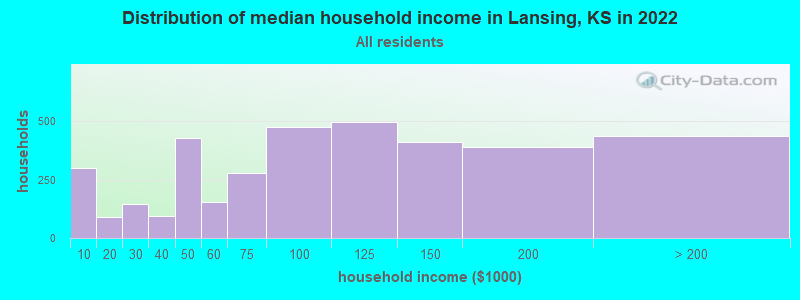
Lansing, KS household income distribution

- 301Less than $10,000
- 89$10,000 to $19,999
- 146$20,000 to $29,999
- 96$30,000 to $39,999
- 427$40,000 to $49,999
- 156$50,000 to $59,999
- 277$60,000 to $74,999
- 475$75,000 to $99,999
- 497$100,000 to $124,999
- 411$125,000 to $149,999
- 388$150,000 to $199,999
- 439$200,000 or more
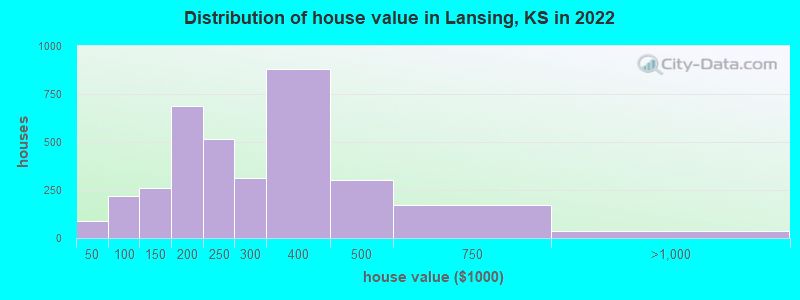
Home value of owner - occupied houses in 2022 in Lansing, KS
-
- 19$10,000 to $14,999
- 35$15,000 to $19,999
- 14$20,000 to $24,999
- 5$30,000 to $34,999
- 14$40,000 to $49,999
- 5$50,000 to $59,999
- 105$60,000 to $69,999
- 34$70,000 to $79,999
- 38$80,000 to $89,999
- 20$90,000 to $99,999
- 103$100,000 to $124,999
- 155$125,000 to $149,999
- 335$150,000 to $174,999
- 350$175,000 to $199,999
- 516$200,000 to $249,999
- 312$250,000 to $299,999
- 878$300,000 to $399,999
- 300$400,000 to $499,999
- 169$500,000 to $749,999
- 33$750,000 to $999,999
Rent paid by renters in 2022 in Lansing, KS
-
- 1$400 to $449
- 21$450 to $499
- 20$550 to $599
- 74$650 to $699
- 130$700 to $749
- 94$800 to $899
- 37$900 to $999
- 68$1,000 to $1,249
- 90$1,250 to $1,499
- 120$1,500 to $1,999
- 20$2,000 to $2,499
- 27$3,000 to $3,499
- 14$3,500 or more
- 9No cash rent


Percentage of workers working in this county: 72.2%
Number of people working at home: 569 (12.3% of all workers)
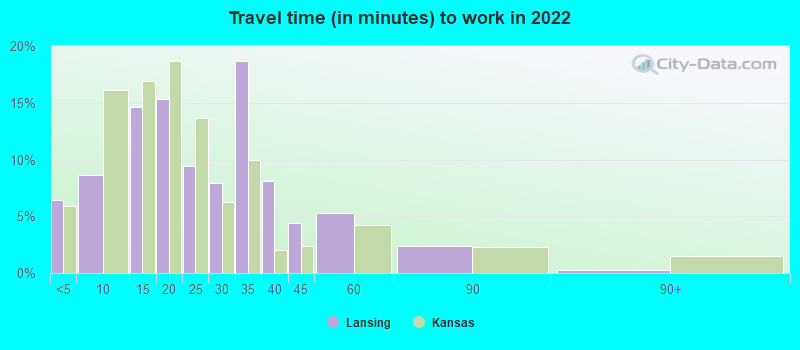
Travel time to work (commute)
- Less than 5 minutes: 332
- 5 to 9 minutes: 547
- 10 to 14 minutes: 545
- 15 to 19 minutes: 644
- 20 to 24 minutes: 607
- 25 to 29 minutes: 184
- 30 to 34 minutes: 574
- 35 to 39 minutes: 94
- 40 to 44 minutes: 239
- 45 to 59 minutes: 250
- 60 to 89 minutes: 97
- 90 or more minutes: 0
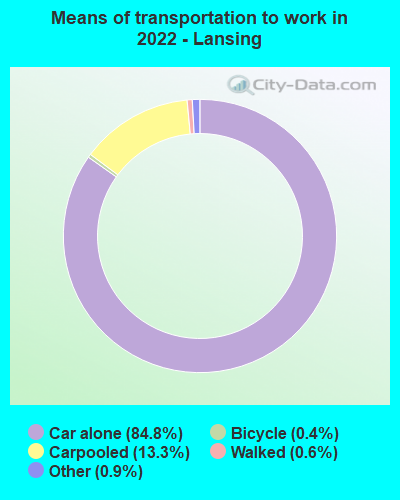
Means of transportation to work:
- Drove a car alone: 2,530 (71.6%)
- Carpooled: 402 (11.4%)
- Taxi: 31 (0.9%)
- Bicycle: 12 (0.3%)
- Walked: 17 (0.5%)
- Worked at home: 569 (16.1%)

- Unemployment by race in 2022
- Unemployment rate for White non-Hispanic residents
- 2.3%Males
- 0.6%Females
- Unemployment rate for other race residents
- 66.9%Males
- Unemployment rate for two or more race residents
- 5.3%Females

- Year of entry for the foreign-born population in Lansing, Kansas
- 1422010 or later
- 642000 to 2009
- 711990 to 1999
- 981980 to 1989
- 661970 to 1979
- 71Before 1970
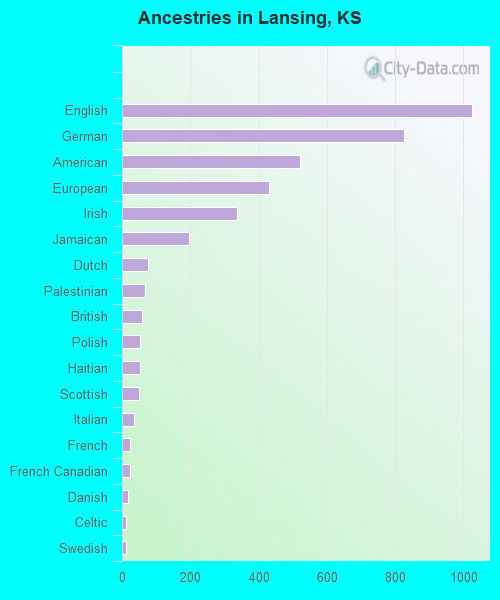
First ancestries reported:
- English: 1,024 (19.7%)
- German: 825 (15.9%)
- American: 522 (10.0%)
- European: 432 (8.3%)
- Irish: 338 (6.5%)
- Jamaican: 195 (3.7%)
- Dutch: 76 (1.5%)
- Palestinian: 68 (1.3%)
- British: 60 (1.2%)
- Polish: 54 (1.0%)
- Haitian: 54 (1.0%)
- Scottish: 50 (1.0%)
- Italian: 36 (0.7%)
- French: 24 (0.5%)
- French Canadian: 22 (0.4%)
- Danish: 18 (0.3%)
- Celtic: 12 (0.2%)
- Swedish: 12 (0.2%)
- Scotch-Irish: 7 (0.1%)
- African: 7 (0.1%)
- Welsh: 7 (0.1%)
- Norwegian: 6 (0.1%)
- Ethiopian: 3 (0.06%)
- Brazilian: 1 (0.02%)
Most common places of birth for foreign-born residents (%):
| Lansing: | 21.8% (90) |
| Kansas: | 0.1% (156) |
| Lansing: | 10.7% (44) |
| Kansas: | 0.4% (841) |
| Lansing: | 9.0% (37) |
| Kansas: | 2.6% (5,492) |
| Lansing: | 8.7% (36) |
| Kansas: | 0.1% (143) |
| Lansing: | 8.7% (36) |
| Kansas: | 39.2% (81,282) |
| Lansing: | 6.5% (27) |
| Kansas: | 1.6% (3,349) |
| Lansing: | 5.6% (23) |
| Kansas: | 0.2% (469) |
| Lansing: | 3.9% (16) |
| Kansas: | 0.7% (1,362) |
| Lansing: | 3.4% (14) |
| Kansas: | 1.6% (3,345) |
| Lansing: | 3.4% (14) |
| Kansas: | 1.2% (2,585) |
| Lansing: | 3.1% (13) |
| Kansas: | 0.1% (292) |
| Lansing: | 2.7% (11) |
| Kansas: | 2.2% (4,488) |
| Lansing: | 2.4% (10) |
| Kansas: | 0.6% (1,310) |
| Lansing: | 2.2% (9) |
| Kansas: | 0.1% (174) |
| Lansing: | 1.9% (8) |
| Kansas: | 0.1% (238) |
Place of birth for U.S.-born residents:
- This state: 5,384
- Other state: 4,803
- Northeast: 609
- Midwest: 1,957
- South: 1,203
- West: 1,006
80.5% of Lansing residents lived in the same house 1 years ago.
Out of people who lived in different houses, 20.5% lived in this county.
Out of people who lived in different counties, 67.9% lived in Kansas.
| Lansing: | 80.5% |
| State average: | 85.3% |
Education attainment for males 25 years and older:
- No schooling: 0
- Nursery to 4th grade: 0
- 5th and 6th grade: 2
- 7th and 8th grade: 63
- 9th grade: 60
- 10th grade: 49
- 11th grade: 174
- 12th grade, no diploma: 26
- High school graduate (or equivalency): 1,656
- Less than 1 year of college: 185
- Some college more than 1 year, no degree: 1,010
- Associate degree: 142
- Bachelor's degree: 699
- Master's degree: 737
- Professional school degree: 34
- Doctorate degree: 30

Education attainment for females 25 years and older:
- No schooling: 0
- Nursery to 4th grade: 0
- 5th and 6th grade: 0
- 7th and 8th grade: 34
- 9th grade: 6
- 10th grade: 0
- 11th grade: 15
- 12th grade, no diploma: 12
- High school graduate (or equivalency): 660
- Less than 1 year of college: 161
- Some college more than 1 year, no degree: 426
- Associate degree: 325
- Bachelor's degree: 1,096
- Master's degree: 413
- Professional school degree: 75
- Doctorate degree: 17


Housing units in structures:
- One, detached: 3,263
- One, attached: 57
- Two: 47
- 3 or 4: 50
- 5 to 9: 299
- 10 to 19: 44
- 50 or more: 35
- Mobile homes: 64
Housing units lacking complete kitchen facilities in 2022: 1.7%
House/condo owner moved in on average 10 years ago
Renter moved in on average 1 years ago

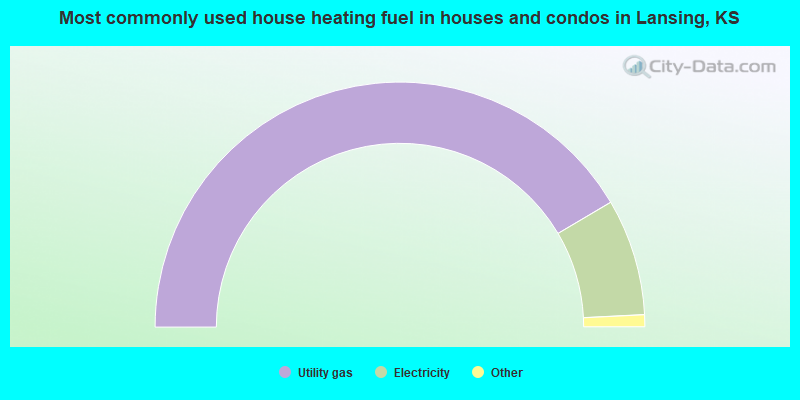
- 83.1%Utility gas
- 15.4%Electricity
- 1.1%Bottled, tank, or LP gas
- 0.5%Wood
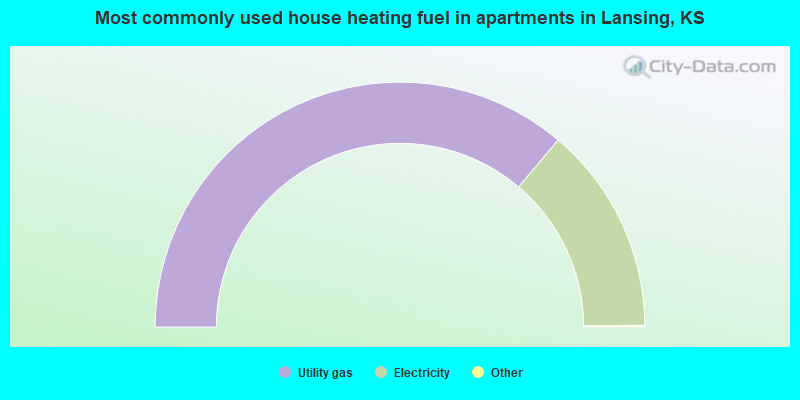
- 72.5%Utility gas
- 27.5%Electricity
Private vs. public school enrollment:
| Here: | 11.3% |
| Kansas: | 14.1% |
| Here: | 1.3% |
| Kansas: | 10.8% |
| Here: | 1.9% |
| Kansas: | 15.4% |


