Las Palmas-Juarez, TX (Texas) Houses and Residents
| Las Palmas-Juarez: | $78,650 |
| Texas: | $275,400 |
Total population: 1,895 (Urban population: 1,547, Rural population: 0)
Houses: 432 (382 occupied: 318 owner occupied, 64 renter occupied)
| % of renters here: | 17% |
| State: | 38% |
Housing density: 1,081 houses/condos per square mile
Median price asked for vacant for-sale houses and condos in 2022 in this county: $196,146.
Median contract rent in 2022: $509 (lower quartile is $492, upper quartile is $567)
Median rent asked for vacant for-rent units in 2022: $486
Median gross rent in Las Palmas-Juarez, TX in 2022: $722
Housing units in Las Palmas-Juarez with a mortgage: 62 (0 second mortgage, 8 home equity loan, 0 both second mortgage and home equity loan)
Houses without a mortgage: 231


Household type by relationship:
Households: 402,490- In family households: 374,972 (61,364 male householders, 35,215 female householders)
66,105 spouses, 152,864 children (144,793 natural, 1,885 adopted, 6,186 stepchildren), 21,694 grandchildren, 5,766 brothers or sisters, 5,826 parents, foster children, 10,679 other relatives, 8,350 non-relatives
- In nonfamily households: 27,518 (10,598 male householders (8,670 living alone)), 12,454 female householders (10,923 living alone)), 4,466 nonrelatives
- In group quarters: 3,730 (2,393 institutionalized population)
70,605 married couples with children.
23,148 single-parent households (3,644 men, 19,504 women).
4.3% of residents of Las Palmas-Juarez speak English at home.
95.7% of residents speak Spanish at home (53% speak English very well, 18% speak English well, 13% speak English not well, 16% don't speak English at all).
Foreign born population: 540 (27.5%)
(46.9% of them are naturalized citizens)
| Here: | 5.3 |
| State: | 6.3 |
| Here: | 5.2 |
| State: | 4.0 |

- Bedrooms in owner-occupied houses and condos in Las Palmas-Juarez, Texas
- 0no bedroom
- 311 bedroom
- 762 bedrooms
- 1373 bedrooms
- 604 bedrooms
- 145+ bedrooms

- Bedrooms in renter-occupied apartments in Las Palmas-Juarez, Texas
- 14no bedroom
- 01 bedroom
- 342 bedrooms
- 163 bedrooms
- 04 bedrooms
- 05+ bedrooms

- Cars and other vehicles available in Las Palmas-Juarez in owner-occupied houses/condos
- 21no vehicle
- 941 vehicle
- 1072 vehicles
- 583 vehicles
- 314 vehicles
- 75+ vehicles

- Cars and other vehicles available in Las Palmas-Juarez in renter-occupied apartments
- 14no vehicle
- 411 vehicle
- 92 vehicles
- 03 vehicles
- 04 vehicles
- 05+ vehicles

- Rooms in owner-occupied houses in Las Palmas-Juarez, Texas
- 01 room
- 242 rooms
- 153 rooms
- 514 rooms
- 1185 rooms
- 726 rooms
- 387 rooms
- 08 rooms
- 09+ rooms

- Rooms in renter-occupied apartments in Las Palmas-Juarez, Texas
- 141 room
- 02 rooms
- 03 rooms
- 264 rooms
- 85 rooms
- 76 rooms
- 07 rooms
- 98 rooms
- 09+ rooms


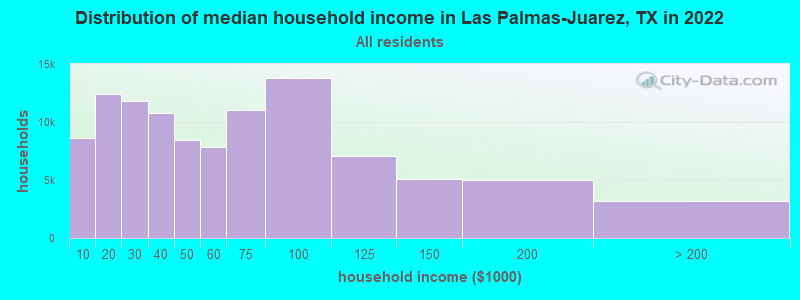
Las Palmas-Juarez, TX household income distribution

- 8,652Less than $10,000
- 12,386$10,000 to $19,999
- 11,828$20,000 to $29,999
- 10,773$30,000 to $39,999
- 8,434$40,000 to $49,999
- 7,810$50,000 to $59,999
- 11,056$60,000 to $74,999
- 13,761$75,000 to $99,999
- 7,044$100,000 to $124,999
- 5,110$125,000 to $149,999
- 5,002$150,000 to $199,999
- 3,187$200,000 or more
Percentage of workers working in this county: 82.5%
Number of people working at home: 60 (8.3% of all workers)
Travel time to work (commute)
- Less than 5 minutes: 11
- 5 to 9 minutes: 84
- 10 to 14 minutes: 54
- 15 to 19 minutes: 133
- 20 to 24 minutes: 68
- 25 to 29 minutes: 9
- 30 to 34 minutes: 62
- 35 to 39 minutes: 12
- 40 to 44 minutes: 0
- 45 to 59 minutes: 4
- 60 to 89 minutes: 5
- 90 or more minutes: 0
Means of transportation to work:
- Drove a car alone: 348 (78.0%)
- Carpooled: 88 (19.7%)
- Bicycle: 3 (0.7%)
- Other means: 3 (0.7%)
- Worked at home: 4 (0.9%)


- Year of entry for the foreign-born population in Las Palmas-Juarez, Texas
- 431995 to March 2000
- 811990 to 1994
- 611985 to 1989
- 361980 to 1984
- 641975 to 1979
- 841970 to 1974
- 251965 to 1969
- 103Before 1965

First ancestries reported:
- Other: 1,454 (95.0%)
- United States: 51 (3.3%)
- German: 25 (1.6%)
Most common places of birth for foreign-born residents (%):
| Las Palmas-Juarez: | 100.0% (497) |
| Texas: | 64.8% (1,879,369) |
Place of birth for U.S.-born residents:
- This state: 1,015
- Other state: 35
- Northeast: 0
- Midwest: 9
- South: 22
- West: 4
84% of Las Palmas-Juarez residents lived in the same house 5 years ago.
Out of people who lived in different houses, 69% lived in this county.
Out of people who lived in different counties, 49% lived in Texas.
Education attainment for males 25 years and older:
- No schooling: 17
- Nursery to 4th grade: 94
- 5th and 6th grade: 68
- 7th and 8th grade: 9
- 9th grade: 18
- 10th grade: 9
- 11th grade: 4
- 12th grade, no diploma: 8
- High school graduate (or equivalency): 73
- Less than 1 year of college: 11
- Some college more than 1 year, no degree: 18
- Associate degree: 10
- Bachelor's degree: 5
- Master's degree: 0
- Professional school degree: 0
- Doctorate degree: 0

Education attainment for females 25 years and older:
- No schooling: 31
- Nursery to 4th grade: 89
- 5th and 6th grade: 46
- 7th and 8th grade: 29
- 9th grade: 37
- 10th grade: 35
- 11th grade: 10
- 12th grade, no diploma: 10
- High school graduate (or equivalency): 57
- Less than 1 year of college: 9
- Some college more than 1 year, no degree: 25
- Associate degree: 12
- Bachelor's degree: 10
- Master's degree: 7
- Professional school degree: 0
- Doctorate degree: 0


Housing units in structures:
- One, detached: 417
- Mobile homes: 15
Median worth of mobile homes: $50,111
Housing units lacking complete kitchen facilities: 7.4%

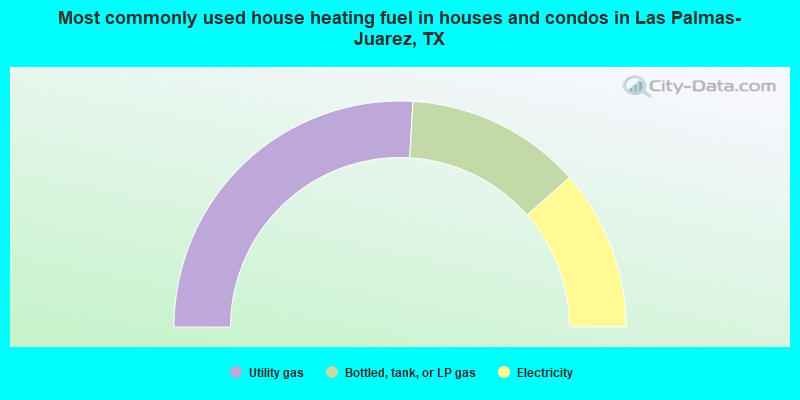
- 51.9%Utility gas
- 25.2%Bottled, tank, or LP gas
- 23.0%Electricity
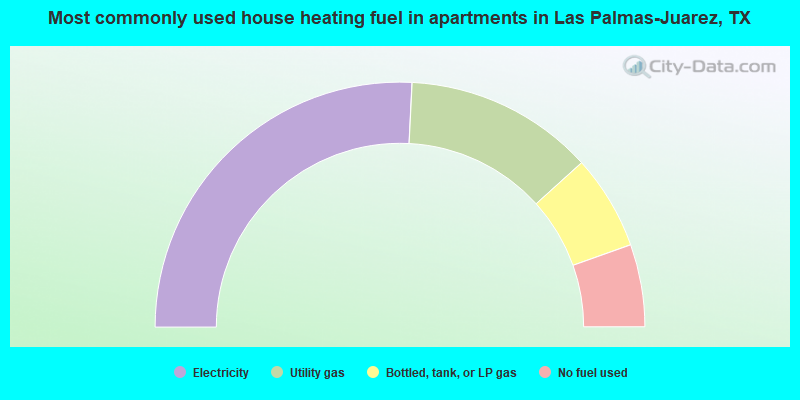
- 51.6%Electricity
- 25.0%Utility gas
- 12.5%Bottled, tank, or LP gas
- 10.9%No fuel used
Private vs. public school enrollment:
| Here: | 0.0% |
| Texas: | 6.8% |
| Here: | 0.0% |
| Texas: | 6.2% |
| Here: | 9.2% |
| Texas: | 15.4% |


