Lathrop, CA (California) Houses and Residents
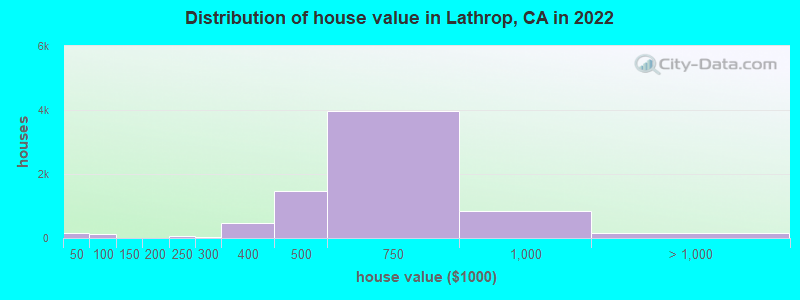
Estimated median house or condo value in 2022: $629,623 (it was $145,700 in 2000 )
Lathrop:
$629,623California:
$715,900
Lower value quartile - upper value quartile: $508,746 - $741,208Mean price in 2022: Detached houses: $488,202 Here:
$488,202State:
$988,808
Townhouses or other attached units: $445,800 Here:
$445,800State:
$838,546
Mobile homes: $108,125 Here:
$108,125State:
$184,506
Total population: 20,075 (Urban population: 9,844, Rural population: 490 (all nonfarm) )
Houses: 8,098 (7,567 occupied: 6,272 owner occupied, 1,225 renter occupied )
% of renters here:
16%State:
44%
Housing density: 494 houses/condos per square mile
Median price asked for vacant for-sale houses and condos in 2022: $627,301.
Median contract rent in 2022: $1,832 (lower quartile is $1,472, upper quartile is over $2,000)
Median rent asked for vacant for-rent units in 2022: $2,455
Median gross rent in Lathrop, CA in 2022: over $2,000
Housing units in Lathrop with a mortgage: 5,215 (533 second mortgage, 2 home equity loan, 476 both second mortgage and home equity loan )Houses without a mortgage: 86
Median household income for houses/condos with a mortgage: $122,091
Median household income for apartments without a mortgage: $72,245
Median monthly housing costs: $2,342
Data:
Median house or condo value ($)
Median house or condo value ($ change since 2000)
Median house or condo value ($) - White
Median house or condo value ($) - Black or African American
Median house or condo value ($) - Asian
Median house or condo value ($) - Hispanic or Latino
Median house or condo value ($) - American Indian and Alaska Native
Median house or condo value ($) - Multirace
Median house or condo value ($) - Other Race
Median price asked for mobile homes ($)
Household density (households per square mile)
Mean house or condo value by units in structure - 1, detached ($)
Mean house or condo value by units in structure - 1, attached ($)
Mean house or condo value by units in structure - 2 ($)
Mean house or condo value by units in structure by units in structure - 3 or 4 ($)
Mean house or condo value by units in structure - 5 or more ($)
Mean house or condo value by units in structure - Boat, RV, van, etc. ($)
Mean house or condo value by units in structure - Mobile home ($)
Median contract rent ($)
Median contract rent - Lower quartile ($)
Median contract rent - Upper quartile ($)
Median gross rent ($)
Urban houses (%)
Rural houses (%)
Houses occupied (%)
Houses occupied (% change since 2000)
Houses owner occupied (%)
Houses owner occupied (% change since 2000)
Houses renter occupied (%)
Houses renter occupied (% change since 2000)
Vacant housing units - For rent (%)
Vacant housing units - For rent (% change since 2000)
Vacant housing units - For sale only (%)
Vacant housing units - For sale only (% change since 2000)
Vacant housing units - Rented or sold, not occupied (%)
Vacant housing units - Rented or sold, not occupied (% change since 2000)
Vacant housing units - For seasonal, recreational, or occasional use (%)
Vacant housing units - For seasonal, recreational, or occasional use (% change since 2000)
Vacant housing units - For migrant workers (%)
Vacant housing units - For migrant workers (% change since 2000)
Vacant housing units - Other vacant (%)
Vacant housing units - Other vacant (% change since 2000)
Median monthly housing costs ($)
Median household income for houses/condos with a mortgage ($)
Median household income for houses/condos without a mortgage ($)
Median household income ($)
Median household income ($) - White
Median household income ($) - Black or African American
Median household income ($) - Asian
Median household income ($) - Hispanic or Latino
Median household income ($) - American Indian and Alaska Native
Median household income ($) - Multirace
Median household income ($) - Other Race
Mortgage status - with mortgage (%)
Mortgage status - with second mortgage (%)
Mortgage status - with home equity loan (%)
Mortgage status - with both second mortgage and home equity loan (%)
Mortgage status - without a mortgage (%)
Median year house/condo built
Median year apartment built
Household type by relationship - Male householder living alone (%)
Household type by relationship - Male householder not living alone (%)
Household type by relationship - Female householder living alone (%)
Household type by relationship - Female householder not living alone (%)
Household type by relationship - Opposite-Sex spouse (%)
Household type by relationship - Same-Sex spouse (%)
Household type by relationship - Opposite-Sex unmarried partner (%)
Household type by relationship - Same-Sex unmarried partner (%)
Household type by relationship - In group quarters (%)
Size of family households - 2-person household (%)
Size of family households - 3-person household (%)
Size of family households - 4-person household (%)
Size of family households - 5-person household (%)
Size of family households - 6-person household (%)
Size of family households - 7-or-more-person household (%)
Size of nonfamily households - 1-person household (%)
Size of nonfamily households - 2-person household (%)
Size of nonfamily households - 3-person household (%)
Size of nonfamily households - 4-person household (%)
Size of nonfamily households - 5-person household (%)
Size of nonfamily households - 6-person household (%)
Size of nonfamily households - 7-or-moreperson household (%)
Year house built - Built 2010 or later (%)
Year house built - Built 2000 to 2009 (%)
Year house built - Built 1990 to 1999 (%)
Year house built - Built 1980 to 1989 (%)
Year house built - Built 1970 to 1979 (%)
Year house built - Built 1960 to 1969 (%)
Year house built - Built 1950 to 1959 (%)
Year house built - Built 1940 to 1949 (%)
Year house built - Built 1939 or earlier (%)
Median number of rooms in houses and condos
Median number of rooms in apartments
Median number of bedrooms in owner occupied houses
Mean number of bedrooms in owner occupied houses
Median number of bedrooms in renter occupied houses
Mean number of bedrooms in renter occupied houses
Median number of vehichles in owner occupied houses
Mean number of vehichles in owner occupied houses
Median number of vehichles in renter occupied houses
Mean number of vehichles in renter occupied houses
Rooms in owner-occupied houses - 1 room (%)
Rooms in owner-occupied houses - 2 rooms (%)
Rooms in owner-occupied houses - 3 rooms (%)
Rooms in owner-occupied houses - 4 rooms (%)
Rooms in owner-occupied houses - 5 rooms (%)
Rooms in owner-occupied houses - 6 rooms (%)
Rooms in owner-occupied houses - 7 rooms (%)
Rooms in owner-occupied houses - 8 rooms (%)
Rooms in owner-occupied houses - 9+ rooms (%)
Rooms in renter-occupied houses - 1 room (%)
Rooms in renter-occupied houses - 2 rooms (%)
Rooms in renter-occupied houses - 3 rooms (%)
Rooms in renter-occupied houses - 4 rooms (%)
Rooms in renter-occupied houses - 5 rooms (%)
Rooms in renter-occupied houses - 6 rooms (%)
Rooms in renter-occupied houses - 7 rooms (%)
Rooms in renter-occupied houses - 8 rooms (%)
Rooms in renter-occupied houses - 9+ rooms (%)
Bedrooms in owner-occupied houses - no bedrooms (%)
Bedrooms in owner-occupied houses - 1 bedroom (%)
Bedrooms in owner-occupied houses - 2 bedrooms (%)
Bedrooms in owner-occupied houses - 3 bedrooms (%)
Bedrooms in owner-occupied houses - 4 bedrooms (%)
Bedrooms in owner-occupied houses - 5+ bedrooms (%)
Bedrooms in renter-occupied houses - no bedrooms (%)
Bedrooms in renter-occupied houses - 1 bedroom (%)
Bedrooms in renter-occupied houses - 2 bedrooms (%)
Bedrooms in renter-occupied houses - 3 bedrooms (%)
Bedrooms in renter-occupied houses - 4 bedrooms (%)
Bedrooms in renter-occupied houses - 5+ bedrooms (%)
Vehicles available in owner-occupied houses - no vehicle available (%)
Vehicles available in owner-occupied houses - 1 vehicle available(%)
Vehicles available in owner-occupied houses - 2 Vehicles available (%)
Vehicles available in owner-occupied houses - 3 Vehicles available (%)
Vehicles available in owner-occupied houses - 4 Vehicles available (%)
Vehicles available in owner-occupied houses - 5+ Vehicles available (%)
Vehicles available in renter-occupied houses - no vehicle available (%)
Vehicles available in renter-occupied houses - 1 vehicle available (%)
Vehicles available in renter-occupied houses - 2 Vehicles available (%)
Vehicles available in renter-occupied houses - 3 Vehicles available (%)
Vehicles available in renter-occupied houses - 4 Vehicles available (%)
Vehicles available in renter-occupied houses - 5+ Vehicles available (%)
Housing units in structures - 1, detached (%)
Housing units in structures - 1, attached (%)
Housing units in structures - 2 (%)
Housing units in structures - 3 or 4 (%)
Housing units in structures - 5 to 9 (%)
Housing units in structures - 10 to 19 (%)
Housing units in structures - 20 to 49 (%)
Housing units in structures - 50 or more (%)
Housing units in structures - Mobile home (%)
Housing units in structures - Boat, RV, van, etc. (%)
Housing units in structures - Owners - 1, detached (%)
Housing units in structures - Owners - 1, attached (%)
Housing units in structures - Owners - 2 (%)
Housing units in structures - Owners - 3 or 4 (%)
Housing units in structures - Owners - 5 to 9 (%)
Housing units in structures - Owners - 10 to 19 (%)
Housing units in structures - Owners - 20 to 49 (%)
Housing units in structures - Owners - 50 or more (%)
Housing units in structures - Owners - Mobile home (%)
Housing units in structures - Owners - Boat, RV, van, etc. (%)
Housing units in structures - Renters - 1, detached (%)
Housing units in structures - Renters - 1, attached (%)
Housing units in structures - Renters - 2 (%)
Housing units in structures - Renters - 3 or 4 (%)
Housing units in structures - Renters - 5 to 9 (%)
Housing units in structures - Renters - 10 to 19 (%)
Housing units in structures - Renters - 20 to 49 (%)
Housing units in structures - Renters - 50 or more (%)
Housing units in structures - Renters - Mobile home (%)
Housing units in structures - Renters - Boat, RV, van, etc. (%)
House/condo owner moved in on average (years ago)
Renter moved in on average (years ago)
Year householder moved into unit - Moved in 1999 to March 2000 (%)
Year householder moved into unit - Moved in 1999 to March 2000 (%) - White
Year householder moved into unit - Moved in 1999 to March 2000 (%) - Black or African American
Year householder moved into unit - Moved in 1999 to March 2000 (%) - Asian
Year householder moved into unit - Moved in 1999 to March 2000 (%) - Hispanic or Latino
Year householder moved into unit - Moved in 1999 to March 2000 (%) - American Indian and Alaska Native
Year householder moved into unit - Moved in 1999 to March 2000 (%) - Multirace
Year householder moved into unit - Moved in 1999 to March 2000 (%) - Other Race
Year householder moved into unit - Moved in 1995 to 1998 (%)
Year householder moved into unit - Moved in 1995 to 1998 (%) - White
Year householder moved into unit - Moved in 1995 to 1998 (%) - Black or African American
Year householder moved into unit - Moved in 1995 to 1998 (%) - Asian
Year householder moved into unit - Moved in 1995 to 1998 (%) - Hispanic or Latino
Year householder moved into unit - Moved in 1995 to 1998 (%) - American Indian and Alaska Native
Year householder moved into unit - Moved in 1995 to 1998 (%) - Multirace
Year householder moved into unit - Moved in 1995 to 1998 (%) - Other Race
Year householder moved into unit - Moved in 1990 to 1994 (%)
Year householder moved into unit - Moved in 1990 to 1994 (%) - White
Year householder moved into unit - Moved in 1990 to 1994 (%) - Black or African American
Year householder moved into unit - Moved in 1990 to 1994 (%) - Asian
Year householder moved into unit - Moved in 1990 to 1994 (%) - Hispanic or Latino
Year householder moved into unit - Moved in 1990 to 1994 (%) - American Indian and Alaska Native
Year householder moved into unit - Moved in 1990 to 1994 (%) - Multirace
Year householder moved into unit - Moved in 1990 to 1994 (%) - Other Race
Year householder moved into unit - Moved in 1980 to 1989 (%)
Year householder moved into unit - Moved in 1980 to 1989 (%) - White
Year householder moved into unit - Moved in 1980 to 1989 (%) - Black or African American
Year householder moved into unit - Moved in 1980 to 1989 (%) - Asian
Year householder moved into unit - Moved in 1980 to 1989 (%) - Hispanic or Latino
Year householder moved into unit - Moved in 1980 to 1989 (%) - American Indian and Alaska Native
Year householder moved into unit - Moved in 1980 to 1989 (%) - Multirace
Year householder moved into unit - Moved in 1980 to 1989 (%) - Other Race
Year householder moved into unit - Moved in 1970 to 1979 (%)
Year householder moved into unit - Moved in 1970 to 1979 (%) - White
Year householder moved into unit - Moved in 1970 to 1979 (%) - Black or African American
Year householder moved into unit - Moved in 1970 to 1979 (%) - Asian
Year householder moved into unit - Moved in 1970 to 1979 (%) - Hispanic or Latino
Year householder moved into unit - Moved in 1970 to 1979 (%) - American Indian and Alaska Native
Year householder moved into unit - Moved in 1970 to 1979 (%) - Multirace
Year householder moved into unit - Moved in 1970 to 1979 (%) - Other Race
Year householder moved into unit - Moved in 1969 or earlier (%)
Year householder moved into unit - Moved in 1969 or earlier (%) - White
Year householder moved into unit - Moved in 1969 or earlier (%) - Black or African American
Year householder moved into unit - Moved in 1969 or earlier (%) - Asian
Year householder moved into unit - Moved in 1969 or earlier (%) - Hispanic or Latino
Year householder moved into unit - Moved in 1969 or earlier (%) - American Indian and Alaska Native
Year householder moved into unit - Moved in 1969 or earlier (%) - Multirace
Year householder moved into unit - Moved in 1969 or earlier (%) - Other Race
Housing units lacking complete plumbing facilities (%)
Housing units lacking complete kitchen facilities (%)
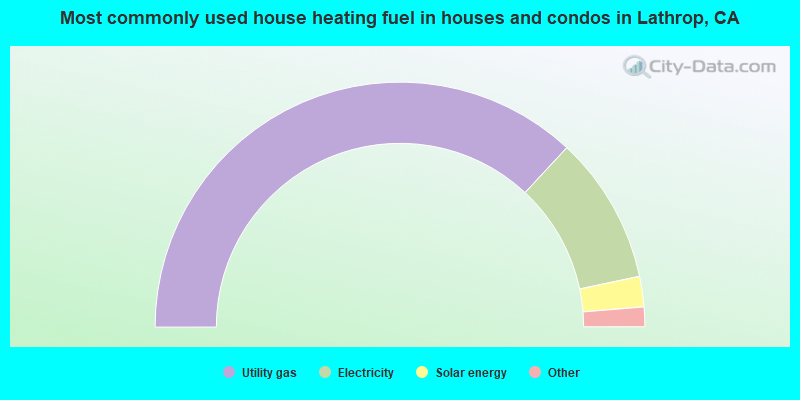
House heating fuel used in houses and condos - Utility gas (%)
House heating fuel used in houses and condos - Bottled, tank, or LP gas (%)
House heating fuel used in houses and condos - Electricity (%)
House heating fuel used in houses and condos - Fuel oil, kerosene, etc. (%)
House heating fuel used in houses and condos - Coal or coke (%)
House heating fuel used in houses and condos - Wood (%)
House heating fuel used in houses and condos - Solar energy (%)
House heating fuel used in houses and condos - Other fuel (%)
House heating fuel used in houses and condos - No fuel used (%)
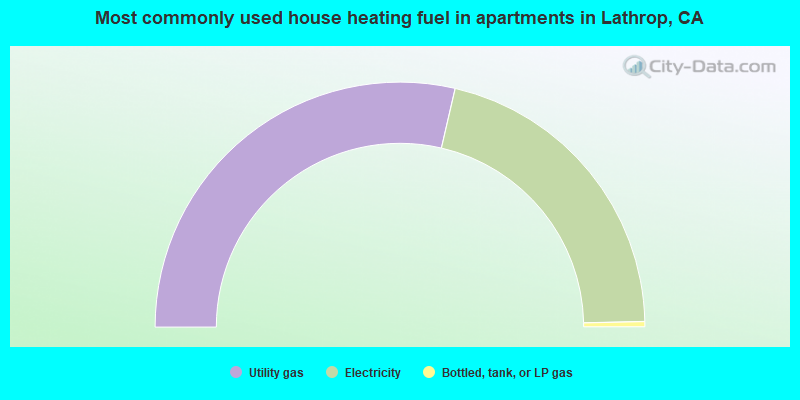
House heating fuel used in apartments - Utility gas (%)
House heating fuel used in apartments - Bottled, tank, or LP gas (%)
House heating fuel used in apartments - Electricity (%)
House heating fuel used in apartments - Fuel oil, kerosene, etc. (%)
House heating fuel used in apartments - Coal or coke (%)
House heating fuel used in apartments - Wood (%)
House heating fuel used in apartments - Solar energy (%)
House heating fuel used in apartments - Other fuel (%)
House heating fuel used in apartments - No fuel used (%)
Latest news about housing in Lathrop, CA collected exclusively by city-data.com from local newspapers, TV, and radio stations
Median year house/condo built: 2004Median year apartment built: 2002Household type by relationship:
Households: 30,157
Male householders: 3,977 (336 living alone ), Female householders: 3,512 (463 living alone )4,883 spouses (4,823 opposite-sex spouses ), 621 unmarried partners , (596 opposite-sex unmarried partners ), 10,087 children (9,541 natural , 108 adopted , 436 stepchildren ), 1,480 grandchildren , 689 brothers or sisters , 1,630 parents , 106 foster children , 1,526 other relatives , 1,617 non-relatives In group quarters: 23
Size of family households: 1,190 2-persons , 1,521 3-persons , 1,525 4-persons , 914 5-persons , 730 6-persons , 573 7-or-more-persons .
Size of nonfamily households: 816 1-person , 174 2-persons , 31 3-persons , 21 5-persons .
5,240 married couples with children. single-parent households (391 men , 825 women ).
50.9% of residents of Lathrop speak English at home. of residents speak Spanish at home (66% speak English very well , 16% speak English well , 13% speak English not well , 4% don't speak English at all ).of residents speak other Indo-European language at home (72% speak English very well , 17% speak English well , 8% speak English not well , 3% don't speak English at all ).of residents speak Asian or Pacific Island language at home (57% speak English very well , 27% speak English well , 15% speak English not well , 1% don't speak English at all ).of residents speak other language at home (72% speak English very well , 9% speak English well , 17% speak English not well , 3% don't speak English at all ).
Foreign born population: 9,797 (32.5%)of them are naturalized citizens )
Median number of rooms in houses and condos:
Median number of rooms in apartments
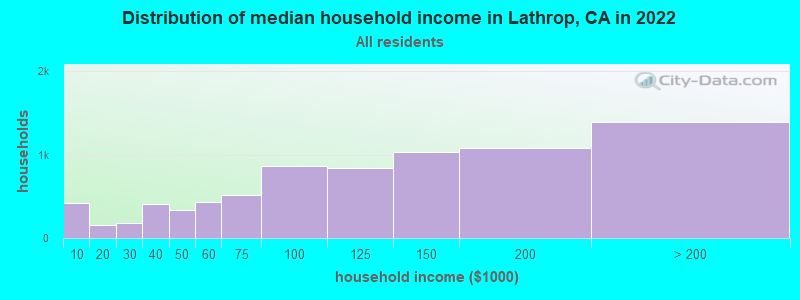
Lathrop, CA household income distribution 424 Less than $10,000155 $10,000 to $19,999176 $20,000 to $29,999410 $30,000 to $39,999338 $40,000 to $49,999433 $50,000 to $59,999512 $60,000 to $74,999863 $75,000 to $99,999835 $100,000 to $124,9991,028 $125,000 to $149,9991,083 $150,000 to $199,9991,391 $200,000 or more
Home value of owner - occupied houses in 2022 in Lathrop, CA 93 Less than $10,0009 $10,000 to $14,9992 $15,000 to $19,99914 $20,000 to $24,99916 $25,000 to $29,99915 $35,000 to $39,9994 $40,000 to $49,99922 $50,000 to $59,99990 $70,000 to $79,99913 $80,000 to $89,9996 $90,000 to $99,9998 $100,000 to $124,9995 $125,000 to $149,99913 $150,000 to $174,99957 $200,000 to $249,99920 $250,000 to $299,999464 $300,000 to $399,9991,466 $400,000 to $499,9993,955 $500,000 to $749,999831 $750,000 to $999,99970 $1,000,000 to $1,499,99926 $1,500,000 to $1,999,99948 $2,000,000 or moreRent paid by renters in 2022 in Lathrop, CA 3 $600 to $64938 $650 to $6993 $800 to $89926 $900 to $99997 $1,000 to $1,249142 $1,250 to $1,499485 $1,500 to $1,999231 $2,000 to $2,49970 $2,500 to $2,99932 $3,000 to $3,49927 $3,500 or more28 No cash rent
Percentage of workers working in this county: 64.5%Number of people working at home: 1,309 (9.8% of all workers )
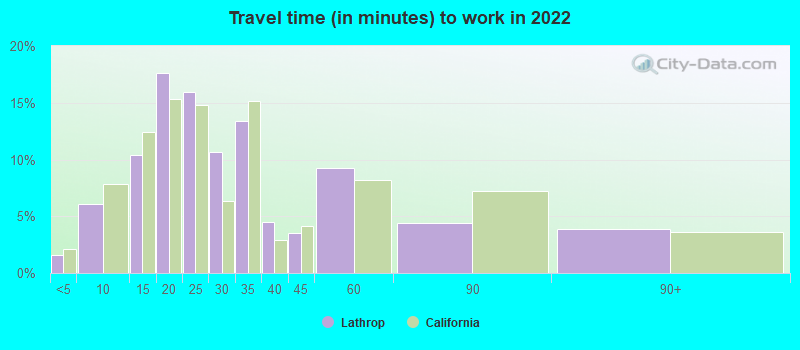
Travel time to work (commute)
Less than 5 minutes: 1185 to 9 minutes: 61710 to 14 minutes: 98315 to 19 minutes: 1,78420 to 24 minutes: 1,62525 to 29 minutes: 63530 to 34 minutes: 1,28735 to 39 minutes: 35740 to 44 minutes: 16845 to 59 minutes: 83360 to 89 minutes: 1,73490 or more minutes: 1,655
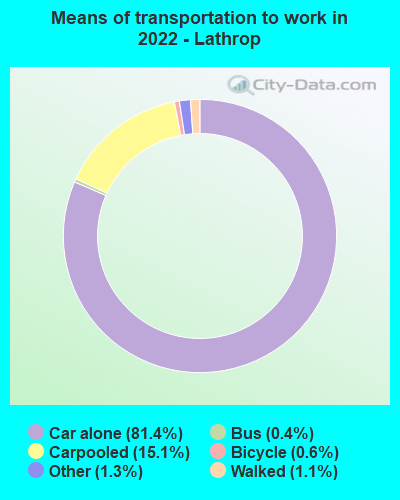
Means of transportation to work:
Drove a car alone: 9,842 (70.5%)Carpooled: 2,398 (17.2%)Bus : 39 (0.3%)Taxi: 199 (1.4%)Bicycle: 84 (0.6%)Walked: 125 (0.9%)Worked at home: 1,309 (9.4%)
Unemployment by race in 2022
Unemployment rate for White non-Hispanic residents 2.2% Males2.5% FemalesUnemployment rate for Black residents 9.3% Males5.6% FemalesUnemployment rate for Asian residents 4.1% Males10.8% FemalesUnemployment rate for other race residents 10.4% Males20.6% FemalesUnemployment rate for two or more race residents 6.3% Males25.0% FemalesUnemployment rate for Hispanic or Latino residents 7.3% Males13.4% Females
Year of entry for the foreign-born population in Lathrop, California
3,023 2010 or later 1,890 2000 to 2009 2,134 1990 to 1999 731 1980 to 1989 624 1970 to 1979 344 Before 1970
First ancestries reported:
Nigerian: 366 (2.1%)
Italian: 300 (1.7%)
German: 272 (1.5%)
English: 223 (1.3%)
American: 112 (0.6%)
Portuguese: 105 (0.6%)
African: 96 (0.5%)
Scandinavian: 83 (0.5%)
Irish: 80 (0.5%)
Palestinian: 70 (0.4%)
European: 69 (0.4%)
Norwegian: 54 (0.3%)
Welsh: 51 (0.3%)
Polish: 50 (0.3%)
Afghan: 46 (0.3%)
British: 43 (0.2%)
Scottish: 23 (0.1%)
Australian: 18 (0.1%)
Iranian: 15 (0.08%)
French: 11 (0.06%)
Scotch-Irish: 11 (0.06%)
Swiss: 10 (0.06%)
Eastern European: 9 (0.05%) Most common places of birth for foreign-born residents (%): Mexico Lathrop:
27.3% (2,494)California:
37.2% (3,881,193)
Philippines Lathrop:
22.3% (2,035)California:
7.8% (818,297)
India Lathrop:
18.8% (1,723)California:
5.2% (539,184)
El Salvador Lathrop:
3.5% (324)California:
4.2% (440,287)
Laos Lathrop:
3.5% (322)California:
0.5% (48,911)
Vietnam Lathrop:
2.5% (231)California:
4.9% (512,335)
Afghanistan Lathrop:
1.9% (175)California:
0.5% (53,260)
Burma (Myanmar) Lathrop:
1.7% (159)California:
0.3% (28,176)
Nigeria Lathrop:
1.7% (155)California:
0.3% (35,557)
Guatemala Lathrop:
1.6% (145)California:
2.8% (290,436)
Place of birth for U.S.-born residents:
This state: 18,316Other state: 1,597Northeast: 272Midwest: 369South: 648West: 302 90.6% of Lathrop residents lived in the same house 1 years ago.
Out of people who lived in different houses, 30.2% lived in this county.
Out of people who lived in different counties, 96.6% lived in California.
Lathrop:
90.6%State average:
88.9%
Education attainment for males 25 years and older:
No schooling: 617Nursery to 4th grade: 1225th and 6th grade: 2727th and 8th grade: 2059th grade: 4810th grade: 14611th grade: 22612th grade, no diploma: 383High school graduate (or equivalency): 2,825Less than 1 year of college: 616Some college more than 1 year, no degree: 1,150Associate degree: 772Bachelor's degree: 1,297Master's degree: 371Professional school degree: 110Doctorate degree: 31
Education attainment for females 25 years and older:
No schooling: 585Nursery to 4th grade: 455th and 6th grade: 3147th and 8th grade: 2369th grade: 7810th grade: 8911th grade: 4212th grade, no diploma: 396High school graduate (or equivalency): 2,385Less than 1 year of college: 698Some college more than 1 year, no degree: 1,275Associate degree: 816Bachelor's degree: 2,130Master's degree: 418Professional school degree: 6Doctorate degree: 170
Housing units in structures:
One, detached: 7,297One, attached: 252Two: 613 or 4: 1045 to 9: 5910 to 19: 1650 or more: 29Mobile homes: 275Median worth of mobile homes: $125,716
Housing units lacking complete plumbing facilities in 2022: 0.4%Housing units lacking complete kitchen facilities in 2022: 1.8%House/condo owner moved in on average 7 years ago
Renter moved in on average 4 years ago
Private vs. public school enrollment:
Students in private schools in grades 1 to 8 (elementary and middle school): 224 Here:
5.4%California:
10.5%
Students in private schools in grades 9 to 12 (high school): 147 Students in private undergraduate colleges: 182 Here:
10.3%California:
15.9%