Latrobe, PA (Pennsylvania) Houses and Residents
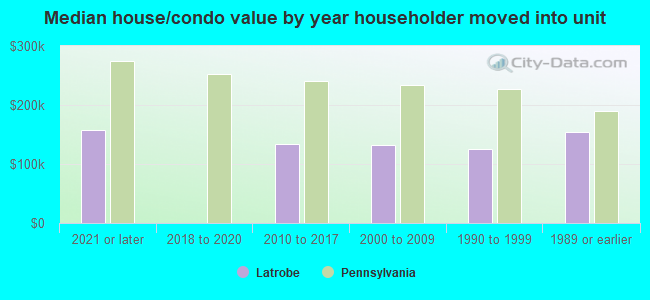
| Latrobe: | $141,668 |
| Pennsylvania: | $245,500 |
Total population: 8,129 (All urban)
Houses: 3,953 (3,703 occupied: 2,563 owner occupied, 1,194 renter occupied)
| % of renters here: | 32% |
| State: | 31% |
Housing density: 1,720 houses/condos per square mile
Median price asked for vacant for-sale houses and condos in 2022: $70,603.
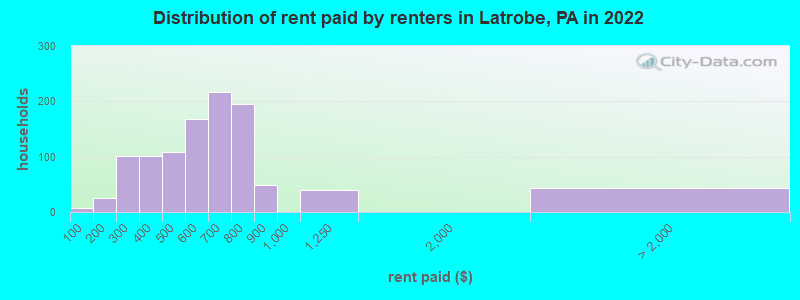
Median contract rent in 2022: $584 (lower quartile is $397, upper quartile is $741)
Median rent asked for vacant for-rent units in 2022: $683
Median gross rent in Latrobe, PA in 2022: $729
Housing units in Latrobe with a mortgage: 1,783 (147 second mortgage, 0 home equity loan, 127 both second mortgage and home equity loan)
Houses without a mortgage: 88
Median household income for houses/condos with a mortgage: $89,366
Median household income for apartments without a mortgage: $59,925
Median monthly housing costs: $825
Compare current foreclosures in Latrobe, PA:
| Photo | Address | Area | Beds / Baths | Price | Details |
|---|---|---|---|---|---|

|
#1
Wheeler Ln
Latrobe, PA 15650
|
2,212 sq. feet
|
2 baths 3 beds |
$52,500
|
show details |

|
#2
Miller St
Latrobe, PA 15650
|
- sq. feet
|
2 baths 2 beds |
show details | |

|
#3
Main St
Latrobe, PA 15650
|
1,256 sq. feet
|
1 baths 3 beds |
show details | |

|
#4
Unity St
Latrobe, PA 15650
|
- sq. feet
|
1 baths 5 beds |
show details | |

|
#5
Bethel Church Rd
Latrobe, PA 15650
|
- sq. feet
|
- baths - beds |
show details | |

|
#6
Lloyd Ave
Latrobe, PA 15650
|
- sq. feet
|
- baths - beds |
show details | |

|
#7
Mitchell Dr Apt 102
Latrobe, PA 15650
|
- sq. feet
|
- baths - beds |
show details | |

|
#8
State Route 981
Latrobe, PA 15650
|
- sq. feet
|
- baths - beds |
show details | |

|
#9
3rd St
Latrobe, PA 15650
|
- sq. feet
|
- baths - beds |
show details | |

|
#10
Roskovensky Rd
Latrobe, PA 15650
|
- sq. feet
|
- baths - beds |
show details |
| Photo | Address | Area | Beds / Baths | Price | Details |
|---|---|---|---|---|---|

|
#11
Forest St
Latrobe, PA 15650
|
- sq. feet
|
- baths - beds |
show details | |

|
#12
State Route 982
Latrobe, PA 15650
|
1,680 sq. feet
|
- baths - beds |
show details | |

|
#13
Marguerite Rd
Latrobe, PA 15650
|
- sq. feet
|
- baths - beds |
show details | |

|
#14
Spring St Apt 3b
Latrobe, PA 15650
|
- sq. feet
|
- baths - beds |
show details | |

|
#15
N Shenandoah Dr Apt 201
Latrobe, PA 15650
|
- sq. feet
|
- baths - beds |
show details | |

|
#16
E Harrison Ave
Latrobe, PA 15650
|
- sq. feet
|
- baths - beds |
show details | |

|
#17
Sequoia Ct
Latrobe, PA 15650
|
- sq. feet
|
- baths - beds |
show details | |

|
#18
Bethel Church Rd
Latrobe, PA 15650
|
- sq. feet
|
- baths - beds |
show details | |

|
#19
Laveen St
Latrobe, PA 15650
|
- sq. feet
|
- baths - beds |
show details | |

|
#20
Bethel Church Rd
Latrobe, PA 15650
|
- sq. feet
|
- baths - beds |
show details |
| Photo | Address | Area | Beds / Baths | Price | Details |
|---|---|---|---|---|---|

|
#21
Redbud Ln
Latrobe, PA 15650
|
- sq. feet
|
- baths - beds |
show details | |

|
#22
Wood St
Latrobe, PA 15650
|
- sq. feet
|
- baths - beds |
show details | |

|
#23
Sullenberger Rd
Latrobe, PA 15650
|
- sq. feet
|
- baths - beds |
show details | |

|
#24
E 4th Ave
Latrobe, PA 15650
|
- sq. feet
|
- baths - beds |
show details | |

|
#25
Glacier Ct
Latrobe, PA 15650
|
- sq. feet
|
- baths - beds |
show details | |

|
#26
State Route 982
Latrobe, PA 15650
|
- sq. feet
|
- baths - beds |
show details | |

|
#27
Saint Clair St
Latrobe, PA 15650
|
- sq. feet
|
- baths - beds |
show details | |

|
#28
Tarason Dr
Latrobe, PA 15650
|
- sq. feet
|
- baths - beds |
show details | |

|
#29
Ransel Rd
Latrobe, PA 15650
|
- sq. feet
|
- baths - beds |
show details | |

|
#30
Raymond Ave
Latrobe, PA 15650
|
- sq. feet
|
- baths - beds |
show details |
| Photo | Address | Area | Beds / Baths | Price | Details |
|---|---|---|---|---|---|

|
#31
Irving Ave
Latrobe, PA 15650
|
- sq. feet
|
- baths - beds |
show details | |

|
#32
Jefferson St
Latrobe, PA 15650
|
- sq. feet
|
- baths - beds |
show details | |

|
#33
Gertrude St
Latrobe, PA 15650
|
- sq. feet
|
- baths - beds |
show details | |

|
#34
Laurelview Dr
Latrobe, PA 15650
|
- sq. feet
|
- baths - beds |
show details | |

|
#35
Forest St
Latrobe, PA 15650
|
- sq. feet
|
- baths - beds |
show details | |

|
#36
Weldon St
Latrobe, PA 15650
|
- sq. feet
|
- baths - beds |
show details | |

|
#37
Highland Ave
Latrobe, PA 15650
|
- sq. feet
|
- baths - beds |
show details | |

|
#38
Jefferson St
Latrobe, PA 15650
|
- sq. feet
|
- baths - beds |
show details | |

|
#39
Chestnut St
Latrobe, PA 15650
|
- sq. feet
|
- baths - beds |
show details | |

|
#40
Allegheny Ave
Latrobe, PA 15650
|
- sq. feet
|
- baths - beds |
show details |
| Photo | Address | Area | Beds / Baths | Price | Details |
|---|---|---|---|---|---|

|
#41
College Ln
Latrobe, PA 15650
|
- sq. feet
|
- baths - beds |
show details | |

|
#42
Weldon St # A
Latrobe, PA 15650
|
- sq. feet
|
- baths - beds |
show details | |

|
#43
Twin Lakes Rd
Latrobe, PA 15650
|
- sq. feet
|
- baths - beds |
show details | |

|
Check over 1 million property listings on Foreclosure.com!
|
browse all offers | |||

Latest news about housing in Latrobe, PA collected exclusively by city-data.com from local newspapers, TV, and radio stations


Median year apartment built: 1962
Household type by relationship:
Households: 7,993- Male householders: 1,855 (638 living alone), Female householders: 1,807 (735 living alone)
1,348 spouses (1,342 opposite-sex spouses), 320 unmarried partners, (298 opposite-sex unmarried partners), 1,978 children (1,817 natural, 3 adopted, 156 stepchildren), 88 grandchildren, 21 brothers or sisters, 90 parents, 12 foster children, 52 other relatives, 407 non-relatives
- In group quarters: 7
Size of family households: 998 2-persons, 518 3-persons, 215 4-persons, 131 5-persons, 62 6-persons, 30 7-or-more-persons.
Size of nonfamily households: 1,340 1-person, 424 2-persons, 26 3-persons, 8 7-or-more-persons.
916 married couples with children.
295 single-parent households (24 men, 271 women).
97.7% of residents of Latrobe speak English at home.
0.8% of residents speak Spanish at home (55% speak English very well, 45% speak English not well).
0.3% of residents speak other Indo-European language at home (100% speak English very well).
0.6% of residents speak other language at home (83% speak English very well, 17% speak English well).
Foreign born population: 60 (0.8%)
(33.3% of them are naturalized citizens)
| Here: | 6.4 |
| State: | 6.8 |
| Here: | 4.4 |
| State: | 4.3 |
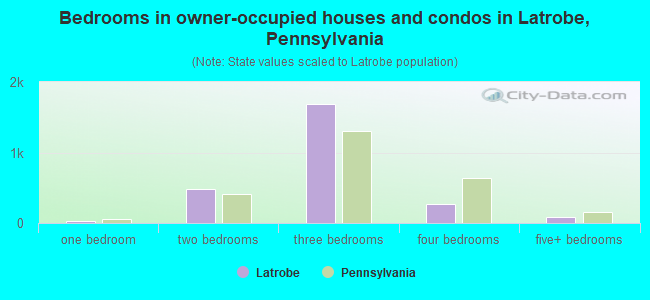
- Bedrooms in owner-occupied houses and condos in Latrobe, Pennsylvania
- 8no bedroom
- 341 bedroom
- 4782 bedrooms
- 1,6953 bedrooms
- 2694 bedrooms
- 795+ bedrooms
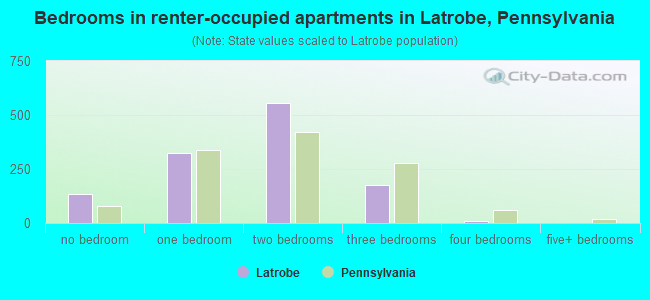
- Bedrooms in renter-occupied apartments in Latrobe, Pennsylvania
- 133no bedroom
- 3241 bedroom
- 5542 bedrooms
- 1743 bedrooms
- 84 bedrooms
- 05+ bedrooms
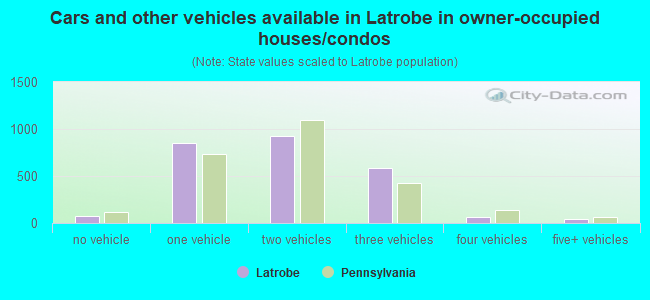
- Cars and other vehicles available in Latrobe in owner-occupied houses/condos
- 78no vehicle
- 8561 vehicle
- 9282 vehicles
- 5873 vehicles
- 694 vehicles
- 455+ vehicles
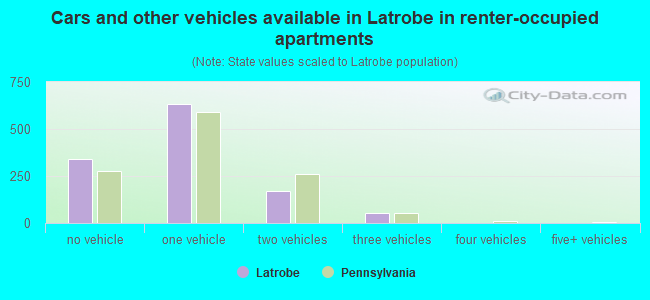
- Cars and other vehicles available in Latrobe in renter-occupied apartments
- 338no vehicle
- 6341 vehicle
- 1702 vehicles
- 523 vehicles
- 04 vehicles
- 05+ vehicles
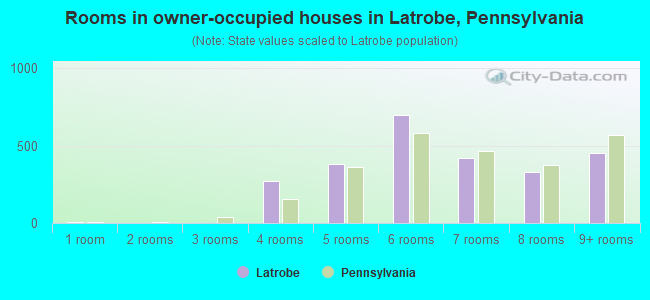
- Rooms in owner-occupied houses in Latrobe, Pennsylvania
- 81 room
- 02 rooms
- 03 rooms
- 2704 rooms
- 3825 rooms
- 7006 rooms
- 4237 rooms
- 3278 rooms
- 4539+ rooms
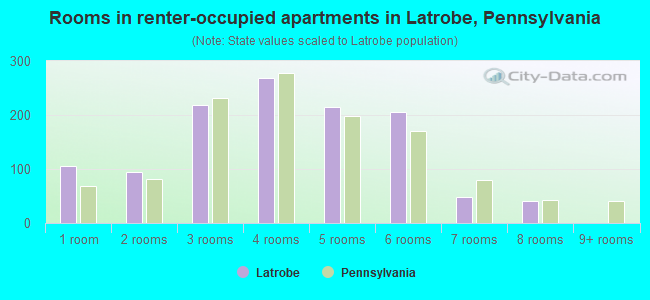
- Rooms in renter-occupied apartments in Latrobe, Pennsylvania
- 1051 room
- 942 rooms
- 2193 rooms
- 2684 rooms
- 2155 rooms
- 2056 rooms
- 497 rooms
- 408 rooms
- 09+ rooms
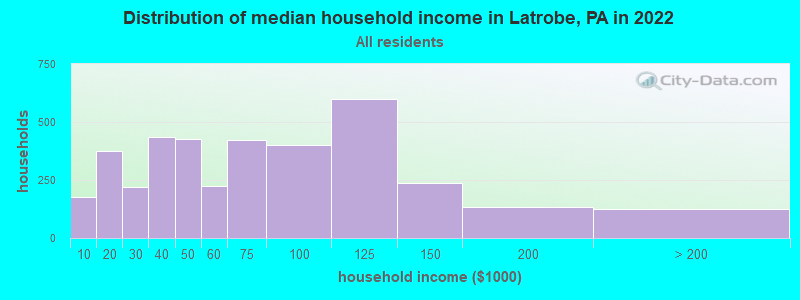
Latrobe, PA household income distribution

- 175Less than $10,000
- 373$10,000 to $19,999
- 221$20,000 to $29,999
- 435$30,000 to $39,999
- 426$40,000 to $49,999
- 224$50,000 to $59,999
- 422$60,000 to $74,999
- 399$75,000 to $99,999
- 600$100,000 to $124,999
- 235$125,000 to $149,999
- 135$150,000 to $199,999
- 126$200,000 or more
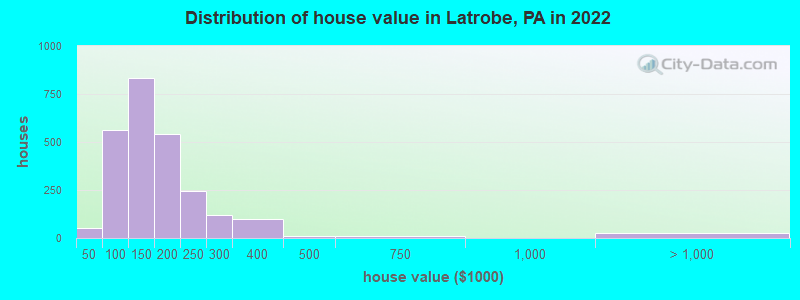
Home value of owner - occupied houses in 2022 in Latrobe, PA
-
- 19Less than $10,000
- 5$10,000 to $14,999
- 22$20,000 to $24,999
- 4$30,000 to $34,999
- 153$50,000 to $59,999
- 74$60,000 to $69,999
- 32$70,000 to $79,999
- 212$80,000 to $89,999
- 87$90,000 to $99,999
- 484$100,000 to $124,999
- 349$125,000 to $149,999
- 318$150,000 to $174,999
- 222$175,000 to $199,999
- 243$200,000 to $249,999
- 119$250,000 to $299,999
- 100$300,000 to $399,999
- 8$400,000 to $499,999
- 12$500,000 to $749,999
- 26$1,000,000 to $1,499,999
Rent paid by renters in 2022 in Latrobe, PA
-
- 8Less than $100
- 8$100 to $149
- 16$150 to $199
- 18$200 to $249
- 82$250 to $299
- 52$300 to $349
- 49$350 to $399
- 56$400 to $449
- 52$450 to $499
- 128$500 to $549
- 39$550 to $599
- 85$600 to $649
- 131$650 to $699
- 78$700 to $749
- 118$750 to $799
- 48$800 to $899
- 40$1,000 to $1,249
- 43No cash rent
Percentage of workers working in this county: 95.5%
Number of people working at home: 203 (4.6% of all workers)
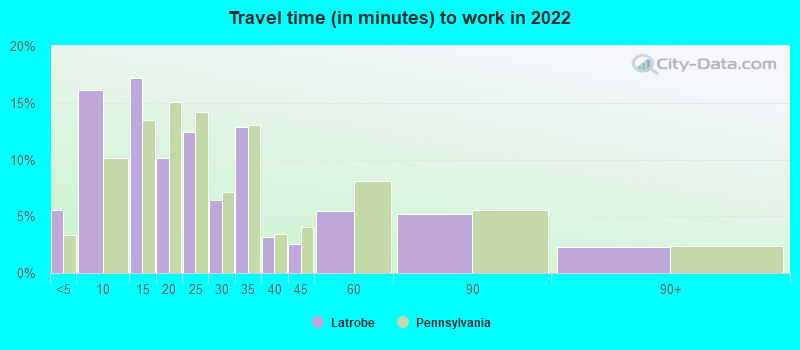
Travel time to work (commute)
- Less than 5 minutes: 381
- 5 to 9 minutes: 737
- 10 to 14 minutes: 670
- 15 to 19 minutes: 588
- 20 to 24 minutes: 432
- 25 to 29 minutes: 393
- 30 to 34 minutes: 425
- 35 to 39 minutes: 66
- 40 to 44 minutes: 74
- 45 to 59 minutes: 108
- 60 to 89 minutes: 44
- 90 or more minutes: 99
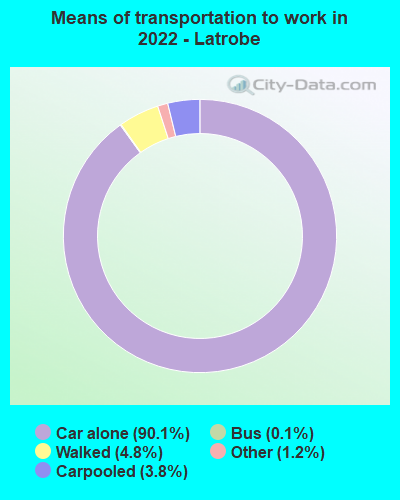
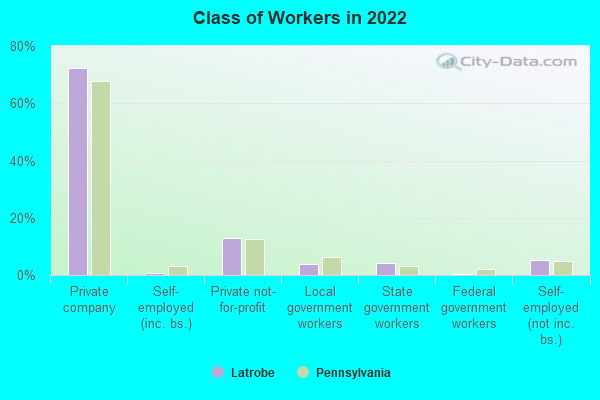
Means of transportation to work:
- Drove a car alone: 4,752 (83.3%)
- Carpooled: 210 (3.7%)
- Bus: 16 (0.3%)
- Taxi: 49 (0.9%)
- Walked: 293 (5.1%)
- Worked at home: 203 (3.6%)
- Unemployment by race in 2022
- Unemployment rate for White non-Hispanic residents
- 3.7%Males
- 1.5%Females
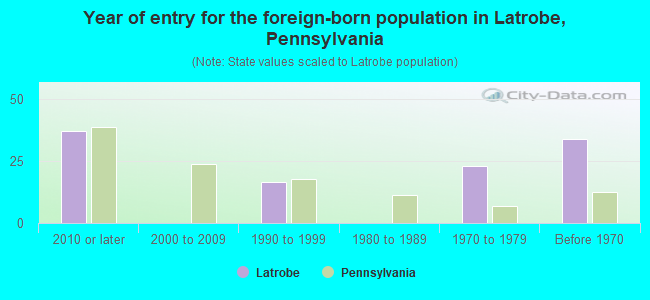
- Year of entry for the foreign-born population in Latrobe, Pennsylvania
- 372010 or later
- 02000 to 2009
- 161990 to 1999
- 01980 to 1989
- 231970 to 1979
- 34Before 1970
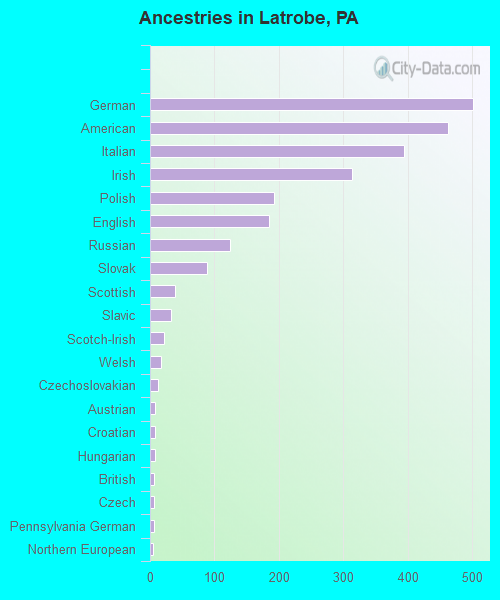
First ancestries reported:
- German: 501 (18.8%)
- American: 462 (17.3%)
- Italian: 394 (14.8%)
- Irish: 313 (11.7%)
- Polish: 192 (7.2%)
- English: 185 (6.9%)
- Russian: 124 (4.7%)
- Slovak: 88 (3.3%)
- Scottish: 39 (1.5%)
- Slavic: 32 (1.2%)
- Scotch-Irish: 22 (0.8%)
- Welsh: 17 (0.6%)
- Czechoslovakian: 12 (0.5%)
- Austrian: 8 (0.3%)
- Croatian: 8 (0.3%)
- Hungarian: 8 (0.3%)
- British: 6 (0.2%)
- Czech: 6 (0.2%)
- Pennsylvania German: 6 (0.2%)
- Northern European: 5 (0.2%)
- Scandinavian: 4 (0.2%)
Most common places of birth for foreign-born residents (%):
| Latrobe: | 49.1% (28) |
| Pennsylvania: | 10.7% (100,596) |
| Latrobe: | 15.8% (9) |
| Pennsylvania: | 1.3% (12,172) |
| Latrobe: | 12.3% (7) |
| Pennsylvania: | 0.5% (4,424) |
| Latrobe: | 10.5% (6) |
| Pennsylvania: | 1.1% (10,331) |
Place of birth for U.S.-born residents:
- This state: 6,928
- Other state: 971
- Northeast: 152
- Midwest: 226
- South: 489
- West: 96
88.1% of Latrobe residents lived in the same house 1 years ago.
Out of people who lived in different houses, 49.4% lived in this county.
Out of people who lived in different counties, 59.9% lived in Pennsylvania.
| Latrobe: | 88.1% |
| State average: | 89.3% |
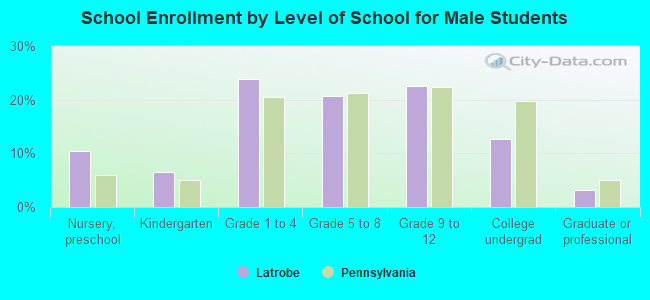
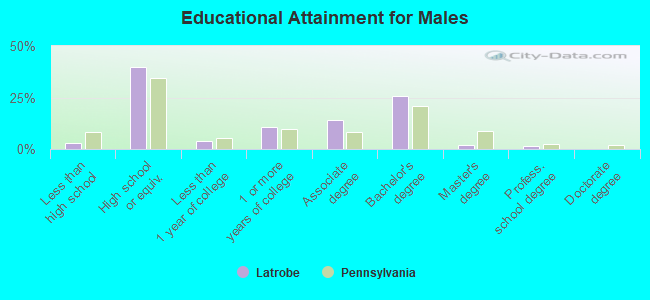
Education attainment for males 25 years and older:
- No schooling: 0
- Nursery to 4th grade: 0
- 5th and 6th grade: 0
- 7th and 8th grade: 6
- 9th grade: 6
- 10th grade: 20
- 11th grade: 31
- 12th grade, no diploma: 9
- High school graduate (or equivalency): 1,001
- Less than 1 year of college: 93
- Some college more than 1 year, no degree: 263
- Associate degree: 352
- Bachelor's degree: 645
- Master's degree: 47
- Professional school degree: 33
- Doctorate degree: 6
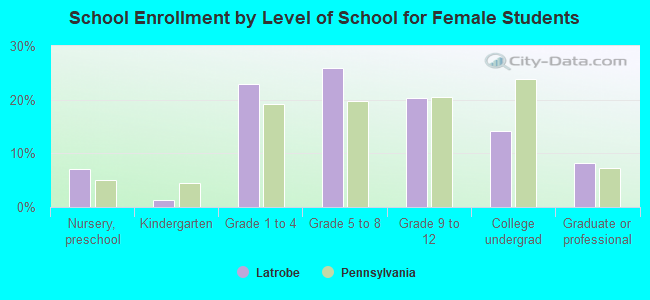
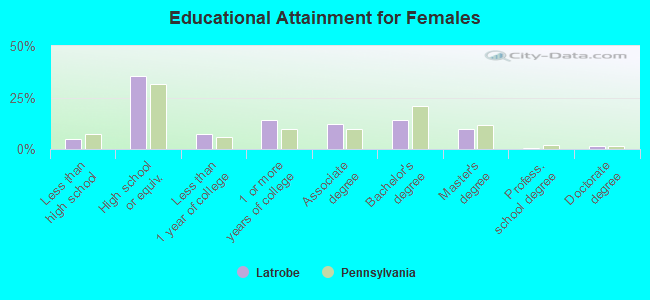
Education attainment for females 25 years and older:
- No schooling: 3
- Nursery to 4th grade: 0
- 5th and 6th grade: 0
- 7th and 8th grade: 3
- 9th grade: 25
- 10th grade: 34
- 11th grade: 54
- 12th grade, no diploma: 26
- High school graduate (or equivalency): 1,016
- Less than 1 year of college: 216
- Some college more than 1 year, no degree: 404
- Associate degree: 350
- Bachelor's degree: 410
- Master's degree: 276
- Professional school degree: 15
- Doctorate degree: 44


Housing units in structures:
- One, detached: 2,800
- One, attached: 54
- Two: 188
- 3 or 4: 191
- 5 to 9: 139
- 10 to 19: 47
- 20 to 49: 59
- 50 or more: 191
- Mobile homes: 280
Median worth of mobile homes: $62,094
Housing units lacking complete kitchen facilities in 2022: 3.9%
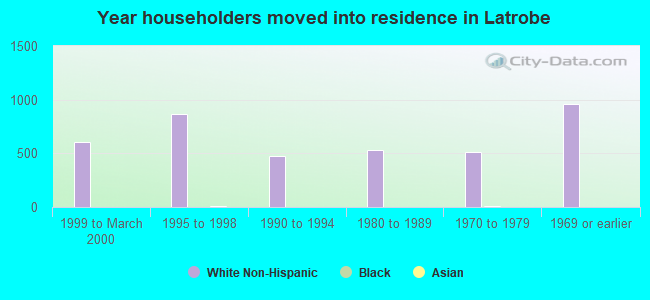
House/condo owner moved in on average 11 years ago
Renter moved in on average 3 years ago
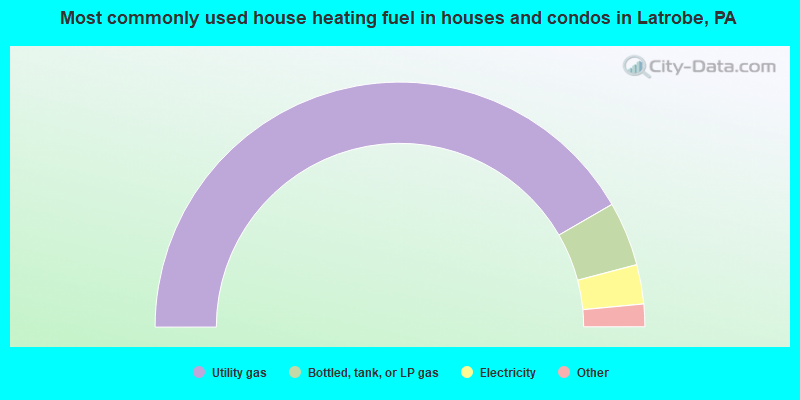
- 83.5%Utility gas
- 8.5%Bottled, tank, or LP gas
- 5.2%Electricity
- 2.2%Fuel oil, kerosene, etc.
- 0.4%Coal or coke
- 0.3%Other fuel
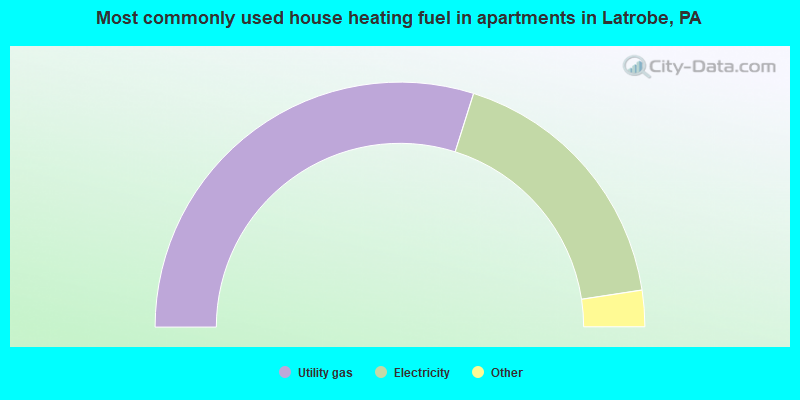
- 59.8%Utility gas
- 35.5%Electricity
- 3.8%Fuel oil, kerosene, etc.
- 0.9%No fuel used
Private vs. public school enrollment:
| Here: | 14.6% |
| Pennsylvania: | 15.7% |
| Here: | 16.6% |
| Pennsylvania: | 13.4% |
| Here: | 36.3% |
| Pennsylvania: | 39.8% |