Laurinburg, NC (North Carolina) Houses and Residents
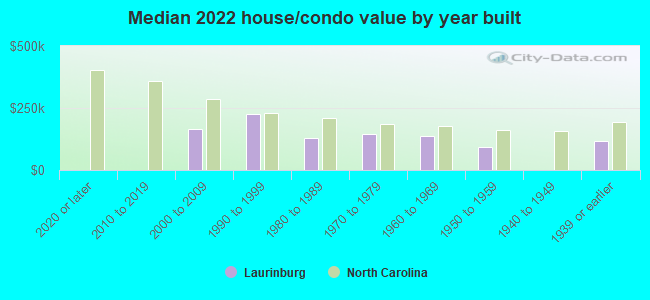
| Laurinburg: | $144,660 |
| North Carolina: | $280,600 |
Mean price in 2022:
Detached houses: $175,704
Here: $175,704 State: $375,326 Townhouses or other attached units: $217,984
Here: $217,984 State: $317,935 In 3-to-4-unit structures: $244,161
Here: $244,161 State: $254,939 In 5-or-more-unit structures: $115,916
Here: $115,916 State: $329,290 Mobile homes: $30,329
Here: $30,329 State: $124,933
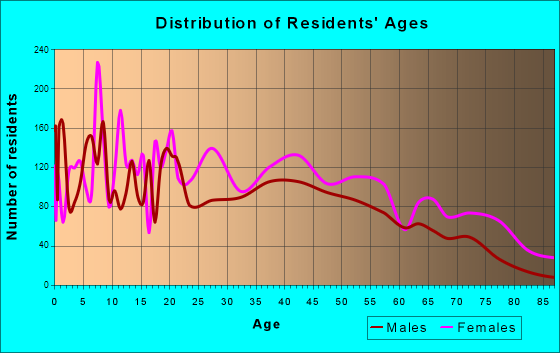
Total population: 15,593 (All urban)
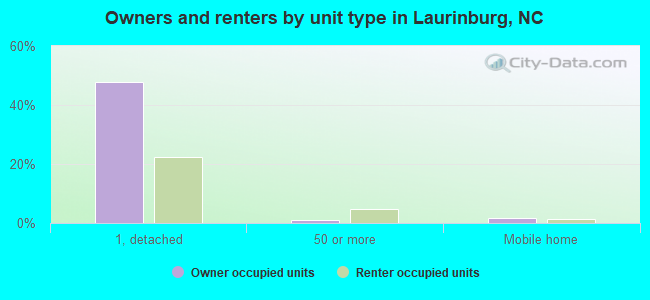
Houses: 6,399 (5,405 occupied: 2,506 owner occupied, 2,978 renter occupied)
| % of renters here: | 54% |
| State: | 33% |
Housing density: 516 houses/condos per square mile
Median price asked for vacant for-sale houses and condos in 2022: $111,859.
Median contract rent in 2022: $569 (lower quartile is $388, upper quartile is $734)
Median rent asked for vacant for-rent units in 2022: $616
Median gross rent in Laurinburg, NC in 2022: $776
Housing units in Laurinburg with a mortgage: 1,471 (148 second mortgage, 11 home equity loan, 107 both second mortgage and home equity loan)
Houses without a mortgage: 110
Median household income for houses/condos with a mortgage: $78,572
Median household income for apartments without a mortgage: $50,399
Median monthly housing costs: $806
Compare current foreclosures in Laurinburg, NC:
| Photo | Address | Area | Beds / Baths | Price | Details |
|---|---|---|---|---|---|

|
#1
Alder Rd
Laurinburg, NC 28352
|
1,000 sq. feet
|
1 baths 3 beds |
show details | |

|
#2
Fairway Dr
Laurinburg, NC 28352
|
3,352 sq. feet
|
3 baths 4 beds |
show details | |

|
#3
Douglas Ave
Laurinburg, NC 28352
|
1,012 sq. feet
|
1 baths 3 beds |
show details | |

|
#4
Purcell Rd
Laurinburg, NC 28352
|
1,334 sq. feet
|
2 baths 3 beds |
show details | |

|
#5
Kenwyn Dr
Laurinburg, NC 28352
|
1,429 sq. feet
|
2 baths 2 beds |
show details | |

|
#6
Queensdale St
Laurinburg, NC 28352
|
1,256 sq. feet
|
1 baths 3 beds |
show details | |

|
#7
Malcolm St
Laurinburg, NC 28352
|
1,008 sq. feet
|
1 baths 2 beds |
show details | |

|
#8
Turnpike Rd
Laurinburg, NC 28352
|
1,702 sq. feet
|
2 baths 3 beds |
show details | |

|
#9
Old Johns Rd
Laurinburg, NC 28352
|
1,152 sq. feet
|
2 baths 3 beds |
show details | |

|
#10
Summer Ln
Laurinburg, NC 28352
|
1,406 sq. feet
|
2 baths 3 beds |
show details |
| Photo | Address | Area | Beds / Baths | Price | Details |
|---|---|---|---|---|---|

|
#11
Fairway Dr
Laurinburg, NC 28352
|
2,108 sq. feet
|
3 baths 4 beds |
show details | |

|
#12
Muse St
Laurinburg, NC 28352
|
1,483 sq. feet
|
1 baths 3 beds |
show details | |

|
#13
S Pine St
Laurinburg, NC 28352
|
1,932 sq. feet
|
2 baths 4 beds |
show details | |

|
#14
Barnes Dr
Laurinburg, NC 28352
|
1,584 sq. feet
|
1 baths 3 beds |
show details | |

|
#15
Salley Mcnair Rd
Laurinburg, NC 28352
|
2,109 sq. feet
|
2 baths 4 beds |
show details | |

|
#16
N Caledonia Rd
Laurinburg, NC 28352
|
900 sq. feet
|
1 baths 2 beds |
show details | |

|
#17
Montclair Dr
Laurinburg, NC 28352
|
2,074 sq. feet
|
2 baths 3 beds |
show details | |

|
#18
X Way Rd
Laurinburg, NC 28352
|
2,789 sq. feet
|
3 baths 4 beds |
show details | |

|
#19
Shaw Rd
Laurinburg, NC 28352
|
1,420 sq. feet
|
2 baths 3 beds |
show details | |

|
#20
Willow Dr
Laurinburg, NC 28352
|
- sq. feet
|
- baths - beds |
show details |
| Photo | Address | Area | Beds / Baths | Price | Details |
|---|---|---|---|---|---|

|
#21
Pine Needle Cir
Laurinburg, NC 28352
|
- sq. feet
|
- baths - beds |
show details | |

|
#22
Knapp St
Laurinburg, NC 28352
|
- sq. feet
|
- baths - beds |
show details | |

|
#23
X Way Rd
Laurinburg, NC 28352
|
- sq. feet
|
- baths - beds |
show details | |

|
#24
Holly Ln
Laurinburg, NC 28352
|
- sq. feet
|
- baths - beds |
show details | |

|
#25
Shaw Rd # A
Laurinburg, NC 28352
|
- sq. feet
|
- baths - beds |
show details | |

|
#26
Biggs St
Laurinburg, NC 28352
|
- sq. feet
|
- baths - beds |
show details | |

|
#27
Mcleod Rd
Laurinburg, NC 28352
|
- sq. feet
|
- baths - beds |
show details | |

|
#28
Bundy Ln
Laurinburg, NC 28352
|
- sq. feet
|
- baths - beds |
show details | |

|
#29
Pea Bridge Rd
Laurinburg, NC 28352
|
- sq. feet
|
- baths - beds |
show details | |

|
#30
Mcbride Ave Apt D
Laurinburg, NC 28352
|
- sq. feet
|
- baths - beds |
show details |
| Photo | Address | Area | Beds / Baths | Price | Details |
|---|---|---|---|---|---|

|
#31
Mccoll Rd Apt 101
Laurinburg, NC 28352
|
- sq. feet
|
- baths - beds |
show details | |

|
#32
Madera Ave
Laurinburg, NC 28352
|
- sq. feet
|
- baths - beds |
show details | |

|
#33
Mclaughlin Rd
Laurinburg, NC 28352
|
- sq. feet
|
- baths - beds |
show details | |

|
Check over 1 million property listings on Foreclosure.com!
|
browse all offers | |||

Latest news about housing in Laurinburg, NC collected exclusively by city-data.com from local newspapers, TV, and radio stations


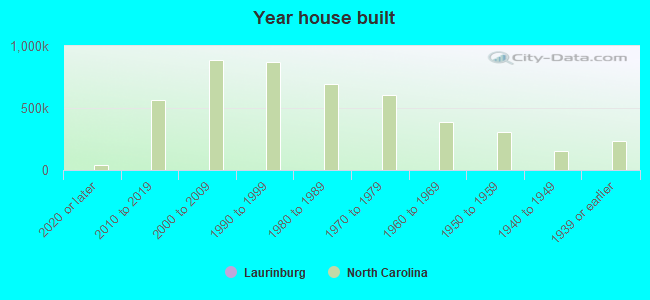
Median year apartment built: 1976
Household type by relationship:
Households: 15,298- Male householders: 2,033 (745 living alone), Female householders: 3,317 (1,100 living alone)
1,751 spouses (1,742 opposite-sex spouses), 194 unmarried partners, (194 opposite-sex unmarried partners), 4,766 children (4,604 natural, 32 adopted, 129 stepchildren), 662 grandchildren, 166 brothers or sisters, 213 parents, 0 foster children, 371 other relatives, 931 non-relatives
- In group quarters: 887
Size of family households: 1,626 2-persons, 673 3-persons, 469 4-persons, 291 5-persons, 20 6-persons, 233 7-or-more-persons.
Size of nonfamily households: 1,878 1-person, 242 2-persons, 20 3-persons, 10 4-persons, 25 5-persons, 8 6-persons.
1,136 married couples with children.
2,002 single-parent households (201 men, 1,801 women).
94.7% of residents of Laurinburg speak English at home.
3.1% of residents speak Spanish at home (38% speak English very well, 30% speak English well, 28% speak English not well, 4% don't speak English at all).
0.8% of residents speak other Indo-European language at home (74% speak English very well, 26% speak English well).
0.5% of residents speak Asian or Pacific Island language at home (19% speak English very well, 81% speak English not well).
0.6% of residents speak other language at home (37% speak English very well, 43% speak English well, 19% speak English not well).
Foreign born population: 520 (3.4%)
(40.8% of them are naturalized citizens)
| Here: | 6.2 |
| State: | 6.4 |
| Here: | 4.1 |
| State: | 4.4 |
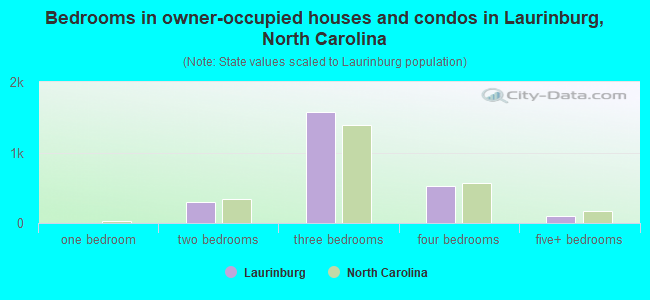
- Bedrooms in owner-occupied houses and condos in Laurinburg, North Carolina
- 0no bedroom
- 61 bedroom
- 2972 bedrooms
- 1,5783 bedrooms
- 5184 bedrooms
- 1065+ bedrooms
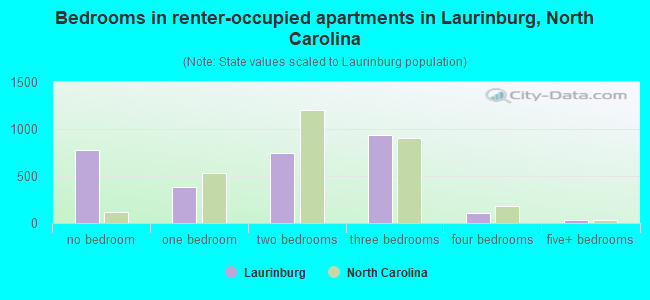
- Bedrooms in renter-occupied apartments in Laurinburg, North Carolina
- 781no bedroom
- 3831 bedroom
- 7402 bedrooms
- 9413 bedrooms
- 1054 bedrooms
- 275+ bedrooms
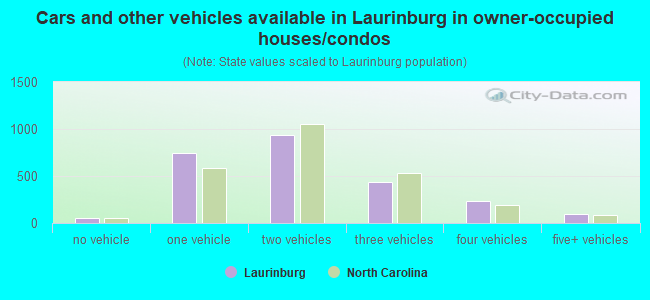
- Cars and other vehicles available in Laurinburg in owner-occupied houses/condos
- 54no vehicle
- 7471 vehicle
- 9402 vehicles
- 4363 vehicles
- 2314 vehicles
- 975+ vehicles
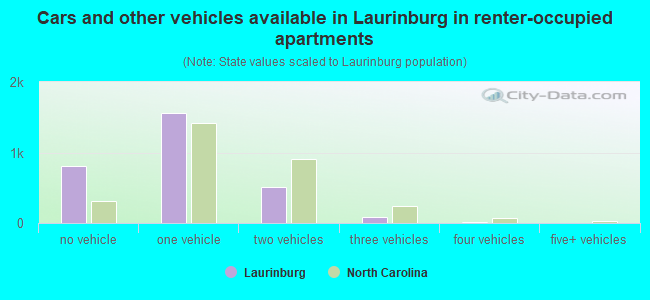
- Cars and other vehicles available in Laurinburg in renter-occupied apartments
- 803no vehicle
- 1,5581 vehicle
- 5092 vehicles
- 893 vehicles
- 194 vehicles
- 05+ vehicles
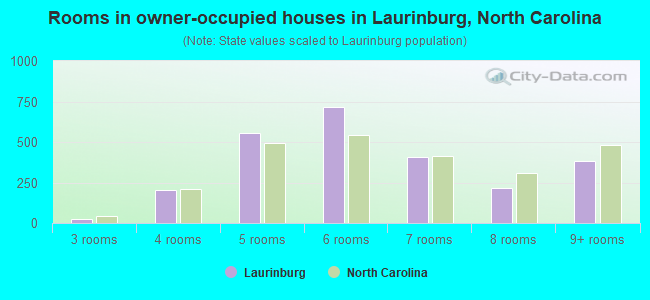
- Rooms in owner-occupied houses in Laurinburg, North Carolina
- 01 room
- 02 rooms
- 263 rooms
- 2044 rooms
- 5535 rooms
- 7186 rooms
- 4087 rooms
- 2138 rooms
- 3839+ rooms
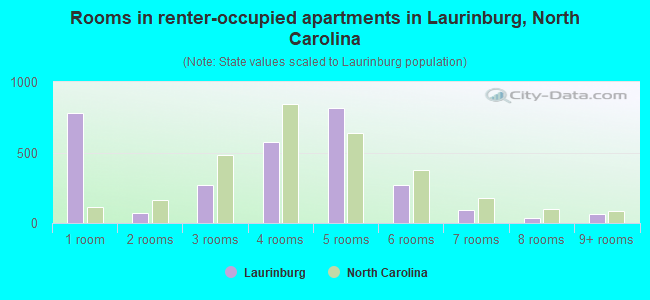
- Rooms in renter-occupied apartments in Laurinburg, North Carolina
- 7811 room
- 712 rooms
- 2723 rooms
- 5784 rooms
- 8145 rooms
- 2696 rooms
- 947 rooms
- 378 rooms
- 629+ rooms
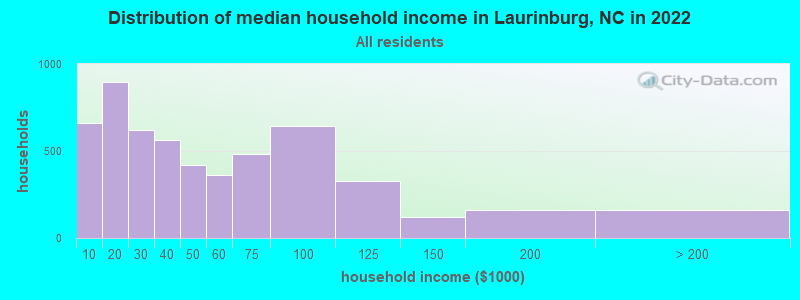
Laurinburg, NC household income distribution

- 663Less than $10,000
- 896$10,000 to $19,999
- 621$20,000 to $29,999
- 562$30,000 to $39,999
- 422$40,000 to $49,999
- 364$50,000 to $59,999
- 484$60,000 to $74,999
- 641$75,000 to $99,999
- 325$100,000 to $124,999
- 123$125,000 to $149,999
- 163$150,000 to $199,999
- 161$200,000 or more
Home value of owner - occupied houses in 2022 in Laurinburg, NC
-
- 22Less than $10,000
- 24$10,000 to $14,999
- 13$15,000 to $19,999
- 11$20,000 to $24,999
- 18$25,000 to $29,999
- 47$30,000 to $34,999
- 33$35,000 to $39,999
- 58$40,000 to $49,999
- 60$50,000 to $59,999
- 103$60,000 to $69,999
- 81$70,000 to $79,999
- 153$80,000 to $89,999
- 96$90,000 to $99,999
- 359$100,000 to $124,999
- 201$125,000 to $149,999
- 146$150,000 to $174,999
- 129$175,000 to $199,999
- 196$200,000 to $249,999
- 146$250,000 to $299,999
- 140$300,000 to $399,999
- 33$400,000 to $499,999
- 13$500,000 to $749,999
- 18$750,000 to $999,999

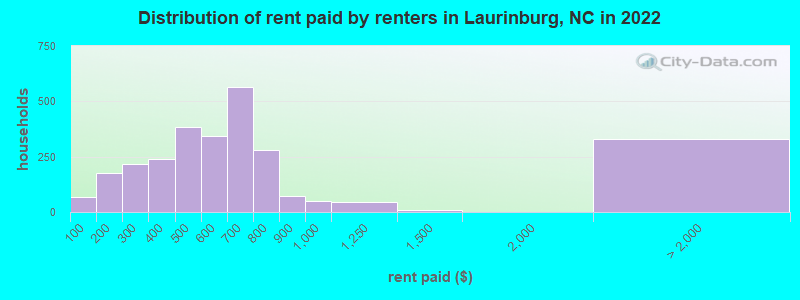
Rent paid by renters in 2022 in Laurinburg, NC
-
- 69Less than $100
- 88$100 to $149
- 87$150 to $199
- 69$200 to $249
- 149$250 to $299
- 43$300 to $349
- 195$350 to $399
- 245$400 to $449
- 139$450 to $499
- 218$500 to $549
- 126$550 to $599
- 320$600 to $649
- 241$650 to $699
- 168$700 to $749
- 110$750 to $799
- 70$800 to $899
- 48$900 to $999
- 43$1,000 to $1,249
- 9$1,250 to $1,499
- 16$3,000 to $3,499
- 44$3,500 or more
- 269No cash rent
Percentage of workers working in this county: 69.4%
Number of people working at home: 599 (11.3% of all workers)
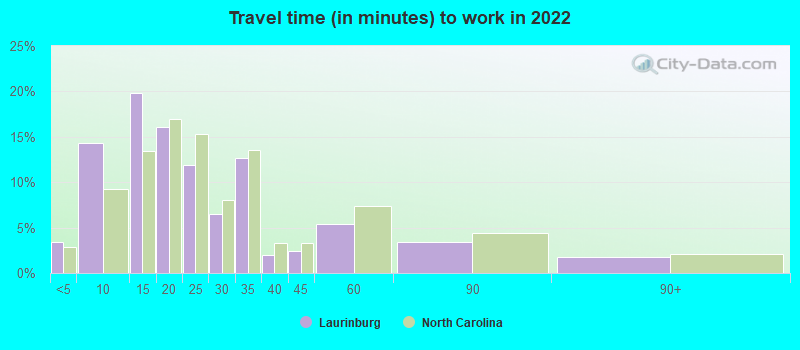
Travel time to work (commute)
- Less than 5 minutes: 268
- 5 to 9 minutes: 932
- 10 to 14 minutes: 893
- 15 to 19 minutes: 522
- 20 to 24 minutes: 452
- 25 to 29 minutes: 343
- 30 to 34 minutes: 331
- 35 to 39 minutes: 142
- 40 to 44 minutes: 202
- 45 to 59 minutes: 265
- 60 to 89 minutes: 135
- 90 or more minutes: 86
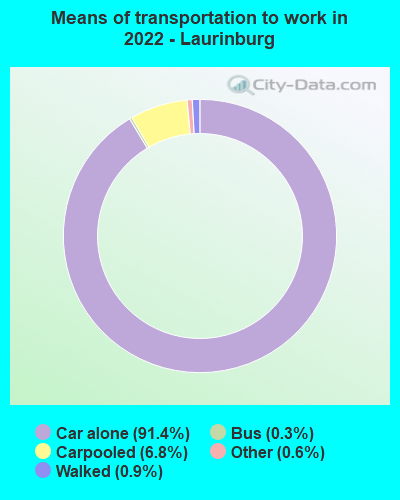
Means of transportation to work:
- Drove a car alone: 6,753 (81.9%)
- Carpooled: 527 (6.4%)
- Bus: 12 (0.1%)
- Taxi: 47 (0.6%)
- Walked: 68 (0.8%)
- Worked at home: 599 (7.3%)
- Unemployment by race in 2022
- Unemployment rate for White non-Hispanic residents
- 3.5%Males
- 3.5%Females
- Unemployment rate for Black residents
- 15.1%Males
- 11.8%Females
- Unemployment rate for American Indian and Alaska Native residents
- 6.2%Males
- 3.8%Females
- Unemployment rate for other race residents
- 11.4%Males
- Unemployment rate for two or more race residents
- 4.8%Males
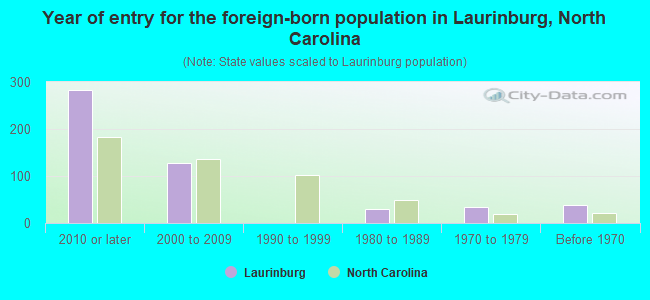
- Year of entry for the foreign-born population in Laurinburg, North Carolina
- 2822010 or later
- 1272000 to 2009
- 01990 to 1999
- 301980 to 1989
- 341970 to 1979
- 39Before 1970
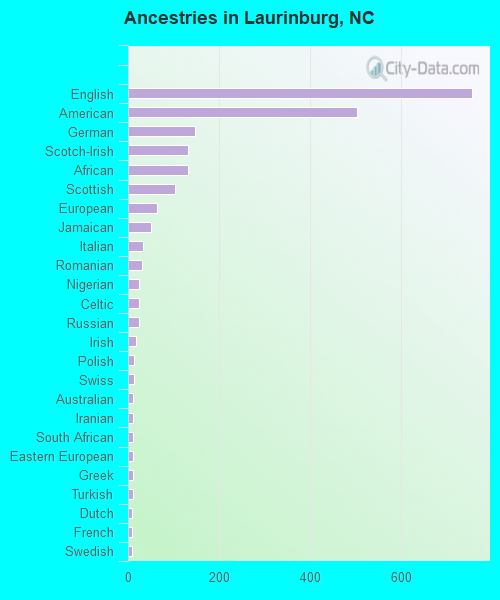
First ancestries reported:
- English: 755 (6.5%)
- American: 503 (4.3%)
- German: 147 (1.3%)
- Scotch-Irish: 132 (1.1%)
- African: 132 (1.1%)
- Scottish: 103 (0.9%)
- European: 64 (0.6%)
- Jamaican: 50 (0.4%)
- Italian: 32 (0.3%)
- Romanian: 31 (0.3%)
- Nigerian: 25 (0.2%)
- Celtic: 24 (0.2%)
- Russian: 24 (0.2%)
- Irish: 18 (0.2%)
- Polish: 14 (0.1%)
- Swiss: 14 (0.1%)
- Australian: 12 (0.1%)
- Iranian: 12 (0.1%)
- South African: 12 (0.1%)
- Eastern European: 11 (0.09%)
- Greek: 10 (0.09%)
- Turkish: 10 (0.09%)
- Dutch: 9 (0.08%)
- French: 9 (0.08%)
- Swedish: 8 (0.07%)
- Hungarian: 6 (0.05%)
Most common places of birth for foreign-born residents (%):
| Laurinburg: | 17.7% (92) |
| North Carolina: | 4.7% (40,707) |
| Laurinburg: | 10.4% (54) |
| North Carolina: | 1.3% (11,419) |
| Laurinburg: | 10.0% (52) |
| North Carolina: | 3.2% (27,477) |
| Laurinburg: | 7.5% (39) |
| North Carolina: | 9.3% (80,594) |
| Laurinburg: | 7.5% (39) |
| North Carolina: | 24.7% (214,776) |
| Laurinburg: | 6.2% (32) |
| North Carolina: | 2.1% (18,105) |
| Laurinburg: | 4.4% (23) |
| North Carolina: | 0.4% (3,093) |
| Laurinburg: | 4.4% (23) |
| North Carolina: | 3.8% (33,379) |
| Laurinburg: | 3.8% (20) |
| North Carolina: | 2.6% (22,964) |
| Laurinburg: | 3.7% (19) |
| North Carolina: | 0.3% (3,031) |
| Laurinburg: | 3.3% (17) |
| North Carolina: | 0.5% (4,673) |
| Laurinburg: | 3.1% (16) |
| North Carolina: | 1.8% (15,534) |
| Laurinburg: | 2.9% (15) |
| North Carolina: | 0.2% (1,937) |
| Laurinburg: | 2.5% (13) |
| North Carolina: | 0.3% (2,997) |
| Laurinburg: | 2.3% (12) |
| North Carolina: | 0.9% (8,067) |
| Laurinburg: | 2.3% (12) |
| North Carolina: | 0.4% (3,292) |
| Laurinburg: | 1.9% (10) |
| North Carolina: | 1.1% (9,173) |
Place of birth for U.S.-born residents:
- This state: 10,667
- Other state: 3,817
- Northeast: 1,276
- Midwest: 385
- South: 1,974
- West: 175
85.8% of Laurinburg residents lived in the same house 1 years ago.
Out of people who lived in different houses, 26.3% lived in this county.
Out of people who lived in different counties, 52.2% lived in North Carolina.
| Laurinburg: | 85.8% |
| State average: | 87.3% |
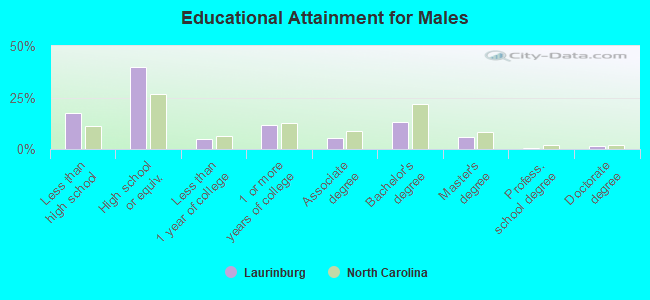
Education attainment for males 25 years and older:
- No schooling: 42
- Nursery to 4th grade: 16
- 5th and 6th grade: 11
- 7th and 8th grade: 80
- 9th grade: 126
- 10th grade: 140
- 11th grade: 163
- 12th grade, no diploma: 236
- High school graduate (or equivalency): 1,837
- Less than 1 year of college: 220
- Some college more than 1 year, no degree: 545
- Associate degree: 245
- Bachelor's degree: 600
- Master's degree: 261
- Professional school degree: 21
- Doctorate degree: 61
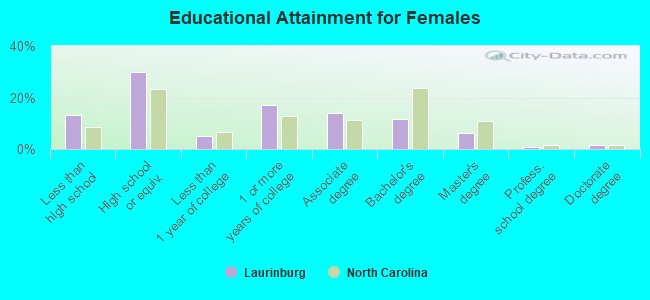
Education attainment for females 25 years and older:
- No schooling: 42
- Nursery to 4th grade: 7
- 5th and 6th grade: 25
- 7th and 8th grade: 73
- 9th grade: 100
- 10th grade: 150
- 11th grade: 185
- 12th grade, no diploma: 96
- High school graduate (or equivalency): 1,530
- Less than 1 year of college: 248
- Some college more than 1 year, no degree: 874
- Associate degree: 712
- Bachelor's degree: 603
- Master's degree: 321
- Professional school degree: 47
- Doctorate degree: 80
Housing units in structures:
- One, detached: 4,151
- One, attached: 142
- Two: 375
- 3 or 4: 558
- 5 to 9: 594
- 10 to 19: 37
- 20 to 49: 140
- 50 or more: 117
- Mobile homes: 281
Median worth of mobile homes: $98,310
Housing units lacking complete kitchen facilities in 2022: 7.8%
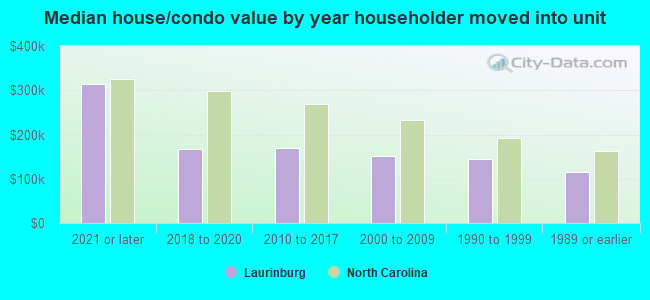
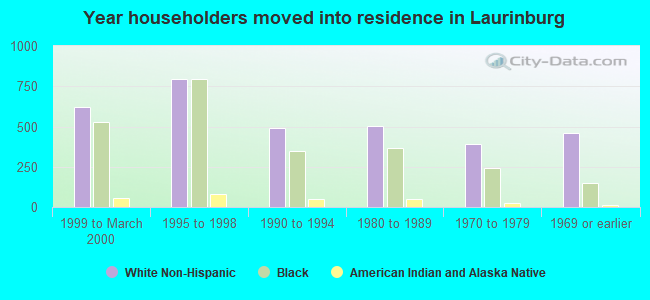
House/condo owner moved in on average 19 years ago
Renter moved in on average 4 years ago
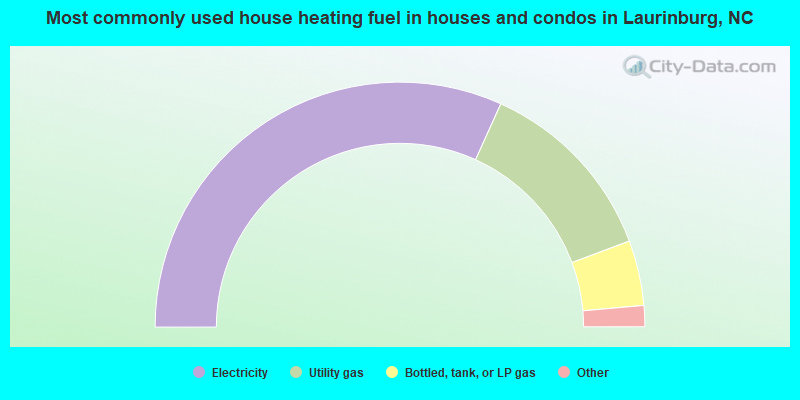
- 63.6%Electricity
- 25.1%Utility gas
- 8.6%Bottled, tank, or LP gas
- 1.6%No fuel used
- 0.9%Wood
- 0.3%Fuel oil, kerosene, etc.
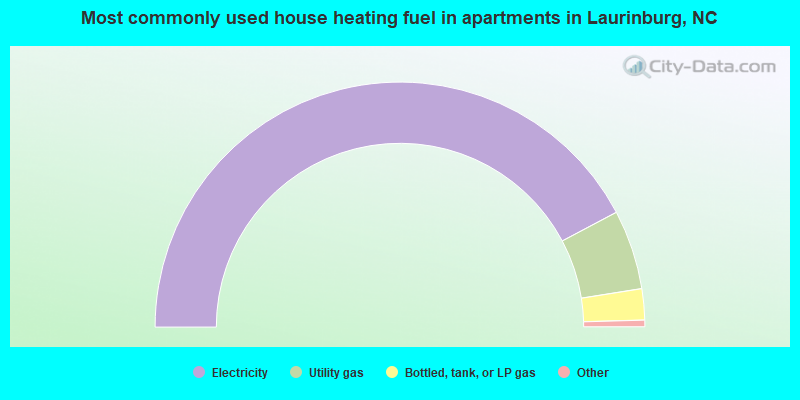
- 84.5%Electricity
- 10.5%Utility gas
- 4.1%Bottled, tank, or LP gas
- 0.4%Solar energy
- 0.3%Wood
- 0.1%No fuel used
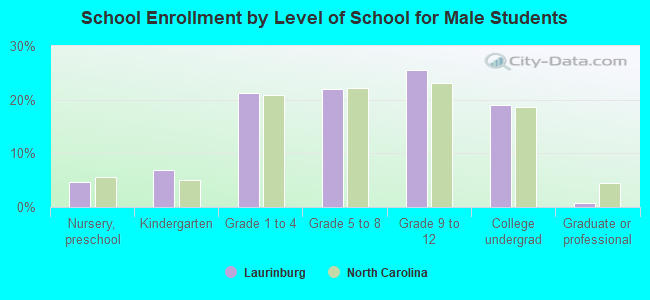
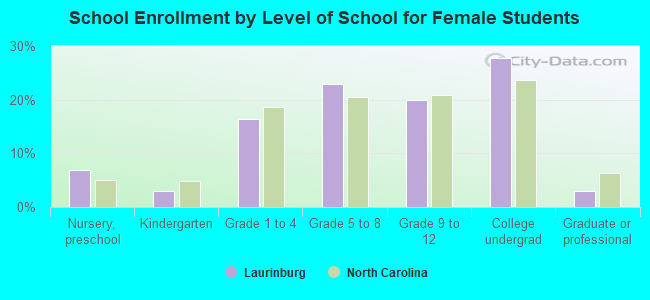
Private vs. public school enrollment:
| Here: | 4.9% |
| North Carolina: | 13.8% |
| Here: | 3.7% |
| North Carolina: | 11.9% |
| Here: | 51.1% |
| North Carolina: | 19.3% |