Lawrence, MA (Massachusetts) Houses and Residents
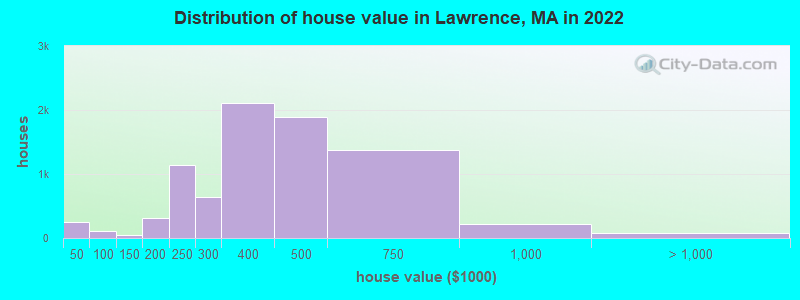
Estimated median house or condo value in 2022: $417,500 (it was $116,400 in 2000 )
Lawrence:
$417,500Massachusetts:
$534,700
Lower value quartile - upper value quartile: $336,300 - $540,300Mean price in 2022: Detached houses: $410,628 Here:
$410,628State:
$651,570
Townhouses or other attached units: $357,322 Here:
$357,322State:
$617,749
In 2-unit structures: $382,820 Here:
$382,820State:
$594,808
In 3-to-4-unit structures: $462,407 Here:
$462,407State:
$601,912
In 5-or-more-unit structures: $246,973 Here:
$246,973State:
$555,768
Mobile homes: $236,674 Here:
$236,674State:
$170,209
Total population: 78,197 (Urban population: 72,043, Rural population: 0)
Houses: 30,711 (29,873 occupied: 8,649 owner occupied, 21,224 renter occupied )
% of renters here:
71%State:
38%
Housing density: 4,413 houses/condos per square mile
Median price asked for vacant for-sale houses and condos in 2022: $490,683.
Median contract rent in 2022: $1,319 (lower quartile is $1,025, upper quartile is $1,667)
Median rent asked for vacant for-rent units in 2022: $1,273
Median gross rent in Lawrence, MA in 2022: $1,625
Housing units in Lawrence with a mortgage: 6,583 (472 second mortgage, 47 home equity loan, 310 both second mortgage and home equity loan )Houses without a mortgage: 48
Median household income for houses/condos with a mortgage: $103,374
Median household income for apartments without a mortgage: $68,063
Median monthly housing costs: $1,616
Data:
Median house or condo value ($)
Median house or condo value ($ change since 2000)
Median house or condo value ($) - White
Median house or condo value ($) - Black or African American
Median house or condo value ($) - Asian
Median house or condo value ($) - Hispanic or Latino
Median house or condo value ($) - American Indian and Alaska Native
Median house or condo value ($) - Multirace
Median house or condo value ($) - Other Race
Median price asked for mobile homes ($)
Household density (households per square mile)
Mean house or condo value by units in structure - 1, detached ($)
Mean house or condo value by units in structure - 1, attached ($)
Mean house or condo value by units in structure - 2 ($)
Mean house or condo value by units in structure by units in structure - 3 or 4 ($)
Mean house or condo value by units in structure - 5 or more ($)
Mean house or condo value by units in structure - Boat, RV, van, etc. ($)
Mean house or condo value by units in structure - Mobile home ($)
Median contract rent ($)
Median contract rent - Lower quartile ($)
Median contract rent - Upper quartile ($)
Median gross rent ($)
Urban houses (%)
Rural houses (%)
Houses occupied (%)
Houses occupied (% change since 2000)
Houses owner occupied (%)
Houses owner occupied (% change since 2000)
Houses renter occupied (%)
Houses renter occupied (% change since 2000)
Vacant housing units - For rent (%)
Vacant housing units - For rent (% change since 2000)
Vacant housing units - For sale only (%)
Vacant housing units - For sale only (% change since 2000)
Vacant housing units - Rented or sold, not occupied (%)
Vacant housing units - Rented or sold, not occupied (% change since 2000)
Vacant housing units - For seasonal, recreational, or occasional use (%)
Vacant housing units - For seasonal, recreational, or occasional use (% change since 2000)
Vacant housing units - For migrant workers (%)
Vacant housing units - For migrant workers (% change since 2000)
Vacant housing units - Other vacant (%)
Vacant housing units - Other vacant (% change since 2000)
Median monthly housing costs ($)
Median household income for houses/condos with a mortgage ($)
Median household income for houses/condos without a mortgage ($)
Median household income ($)
Median household income ($) - White
Median household income ($) - Black or African American
Median household income ($) - Asian
Median household income ($) - Hispanic or Latino
Median household income ($) - American Indian and Alaska Native
Median household income ($) - Multirace
Median household income ($) - Other Race
Mortgage status - with mortgage (%)
Mortgage status - with second mortgage (%)
Mortgage status - with home equity loan (%)
Mortgage status - with both second mortgage and home equity loan (%)
Mortgage status - without a mortgage (%)
Median year house/condo built
Median year apartment built
Household type by relationship - Male householder living alone (%)
Household type by relationship - Male householder not living alone (%)
Household type by relationship - Female householder living alone (%)
Household type by relationship - Female householder not living alone (%)
Household type by relationship - Opposite-Sex spouse (%)
Household type by relationship - Same-Sex spouse (%)
Household type by relationship - Opposite-Sex unmarried partner (%)
Household type by relationship - Same-Sex unmarried partner (%)
Household type by relationship - In group quarters (%)
Size of family households - 2-person household (%)
Size of family households - 3-person household (%)
Size of family households - 4-person household (%)
Size of family households - 5-person household (%)
Size of family households - 6-person household (%)
Size of family households - 7-or-more-person household (%)
Size of nonfamily households - 1-person household (%)
Size of nonfamily households - 2-person household (%)
Size of nonfamily households - 3-person household (%)
Size of nonfamily households - 4-person household (%)
Size of nonfamily households - 5-person household (%)
Size of nonfamily households - 6-person household (%)
Size of nonfamily households - 7-or-moreperson household (%)
Year house built - Built 2010 or later (%)
Year house built - Built 2000 to 2009 (%)
Year house built - Built 1990 to 1999 (%)
Year house built - Built 1980 to 1989 (%)
Year house built - Built 1970 to 1979 (%)
Year house built - Built 1960 to 1969 (%)
Year house built - Built 1950 to 1959 (%)
Year house built - Built 1940 to 1949 (%)
Year house built - Built 1939 or earlier (%)
Median number of rooms in houses and condos
Median number of rooms in apartments
Median number of bedrooms in owner occupied houses
Mean number of bedrooms in owner occupied houses
Median number of bedrooms in renter occupied houses
Mean number of bedrooms in renter occupied houses
Median number of vehichles in owner occupied houses
Mean number of vehichles in owner occupied houses
Median number of vehichles in renter occupied houses
Mean number of vehichles in renter occupied houses
Rooms in owner-occupied houses - 1 room (%)
Rooms in owner-occupied houses - 2 rooms (%)
Rooms in owner-occupied houses - 3 rooms (%)
Rooms in owner-occupied houses - 4 rooms (%)
Rooms in owner-occupied houses - 5 rooms (%)
Rooms in owner-occupied houses - 6 rooms (%)
Rooms in owner-occupied houses - 7 rooms (%)
Rooms in owner-occupied houses - 8 rooms (%)
Rooms in owner-occupied houses - 9+ rooms (%)
Rooms in renter-occupied houses - 1 room (%)
Rooms in renter-occupied houses - 2 rooms (%)
Rooms in renter-occupied houses - 3 rooms (%)
Rooms in renter-occupied houses - 4 rooms (%)
Rooms in renter-occupied houses - 5 rooms (%)
Rooms in renter-occupied houses - 6 rooms (%)
Rooms in renter-occupied houses - 7 rooms (%)
Rooms in renter-occupied houses - 8 rooms (%)
Rooms in renter-occupied houses - 9+ rooms (%)
Bedrooms in owner-occupied houses - no bedrooms (%)
Bedrooms in owner-occupied houses - 1 bedroom (%)
Bedrooms in owner-occupied houses - 2 bedrooms (%)
Bedrooms in owner-occupied houses - 3 bedrooms (%)
Bedrooms in owner-occupied houses - 4 bedrooms (%)
Bedrooms in owner-occupied houses - 5+ bedrooms (%)
Bedrooms in renter-occupied houses - no bedrooms (%)
Bedrooms in renter-occupied houses - 1 bedroom (%)
Bedrooms in renter-occupied houses - 2 bedrooms (%)
Bedrooms in renter-occupied houses - 3 bedrooms (%)
Bedrooms in renter-occupied houses - 4 bedrooms (%)
Bedrooms in renter-occupied houses - 5+ bedrooms (%)
Vehicles available in owner-occupied houses - no vehicle available (%)
Vehicles available in owner-occupied houses - 1 vehicle available(%)
Vehicles available in owner-occupied houses - 2 Vehicles available (%)
Vehicles available in owner-occupied houses - 3 Vehicles available (%)
Vehicles available in owner-occupied houses - 4 Vehicles available (%)
Vehicles available in owner-occupied houses - 5+ Vehicles available (%)
Vehicles available in renter-occupied houses - no vehicle available (%)
Vehicles available in renter-occupied houses - 1 vehicle available (%)
Vehicles available in renter-occupied houses - 2 Vehicles available (%)
Vehicles available in renter-occupied houses - 3 Vehicles available (%)
Vehicles available in renter-occupied houses - 4 Vehicles available (%)
Vehicles available in renter-occupied houses - 5+ Vehicles available (%)
Housing units in structures - 1, detached (%)
Housing units in structures - 1, attached (%)
Housing units in structures - 2 (%)
Housing units in structures - 3 or 4 (%)
Housing units in structures - 5 to 9 (%)
Housing units in structures - 10 to 19 (%)
Housing units in structures - 20 to 49 (%)
Housing units in structures - 50 or more (%)
Housing units in structures - Mobile home (%)
Housing units in structures - Boat, RV, van, etc. (%)
Housing units in structures - Owners - 1, detached (%)
Housing units in structures - Owners - 1, attached (%)
Housing units in structures - Owners - 2 (%)
Housing units in structures - Owners - 3 or 4 (%)
Housing units in structures - Owners - 5 to 9 (%)
Housing units in structures - Owners - 10 to 19 (%)
Housing units in structures - Owners - 20 to 49 (%)
Housing units in structures - Owners - 50 or more (%)
Housing units in structures - Owners - Mobile home (%)
Housing units in structures - Owners - Boat, RV, van, etc. (%)
Housing units in structures - Renters - 1, detached (%)
Housing units in structures - Renters - 1, attached (%)
Housing units in structures - Renters - 2 (%)
Housing units in structures - Renters - 3 or 4 (%)
Housing units in structures - Renters - 5 to 9 (%)
Housing units in structures - Renters - 10 to 19 (%)
Housing units in structures - Renters - 20 to 49 (%)
Housing units in structures - Renters - 50 or more (%)
Housing units in structures - Renters - Mobile home (%)
Housing units in structures - Renters - Boat, RV, van, etc. (%)
House/condo owner moved in on average (years ago)
Renter moved in on average (years ago)
Year householder moved into unit - Moved in 1999 to March 2000 (%)
Year householder moved into unit - Moved in 1999 to March 2000 (%) - White
Year householder moved into unit - Moved in 1999 to March 2000 (%) - Black or African American
Year householder moved into unit - Moved in 1999 to March 2000 (%) - Asian
Year householder moved into unit - Moved in 1999 to March 2000 (%) - Hispanic or Latino
Year householder moved into unit - Moved in 1999 to March 2000 (%) - American Indian and Alaska Native
Year householder moved into unit - Moved in 1999 to March 2000 (%) - Multirace
Year householder moved into unit - Moved in 1999 to March 2000 (%) - Other Race
Year householder moved into unit - Moved in 1995 to 1998 (%)
Year householder moved into unit - Moved in 1995 to 1998 (%) - White
Year householder moved into unit - Moved in 1995 to 1998 (%) - Black or African American
Year householder moved into unit - Moved in 1995 to 1998 (%) - Asian
Year householder moved into unit - Moved in 1995 to 1998 (%) - Hispanic or Latino
Year householder moved into unit - Moved in 1995 to 1998 (%) - American Indian and Alaska Native
Year householder moved into unit - Moved in 1995 to 1998 (%) - Multirace
Year householder moved into unit - Moved in 1995 to 1998 (%) - Other Race
Year householder moved into unit - Moved in 1990 to 1994 (%)
Year householder moved into unit - Moved in 1990 to 1994 (%) - White
Year householder moved into unit - Moved in 1990 to 1994 (%) - Black or African American
Year householder moved into unit - Moved in 1990 to 1994 (%) - Asian
Year householder moved into unit - Moved in 1990 to 1994 (%) - Hispanic or Latino
Year householder moved into unit - Moved in 1990 to 1994 (%) - American Indian and Alaska Native
Year householder moved into unit - Moved in 1990 to 1994 (%) - Multirace
Year householder moved into unit - Moved in 1990 to 1994 (%) - Other Race
Year householder moved into unit - Moved in 1980 to 1989 (%)
Year householder moved into unit - Moved in 1980 to 1989 (%) - White
Year householder moved into unit - Moved in 1980 to 1989 (%) - Black or African American
Year householder moved into unit - Moved in 1980 to 1989 (%) - Asian
Year householder moved into unit - Moved in 1980 to 1989 (%) - Hispanic or Latino
Year householder moved into unit - Moved in 1980 to 1989 (%) - American Indian and Alaska Native
Year householder moved into unit - Moved in 1980 to 1989 (%) - Multirace
Year householder moved into unit - Moved in 1980 to 1989 (%) - Other Race
Year householder moved into unit - Moved in 1970 to 1979 (%)
Year householder moved into unit - Moved in 1970 to 1979 (%) - White
Year householder moved into unit - Moved in 1970 to 1979 (%) - Black or African American
Year householder moved into unit - Moved in 1970 to 1979 (%) - Asian
Year householder moved into unit - Moved in 1970 to 1979 (%) - Hispanic or Latino
Year householder moved into unit - Moved in 1970 to 1979 (%) - American Indian and Alaska Native
Year householder moved into unit - Moved in 1970 to 1979 (%) - Multirace
Year householder moved into unit - Moved in 1970 to 1979 (%) - Other Race
Year householder moved into unit - Moved in 1969 or earlier (%)
Year householder moved into unit - Moved in 1969 or earlier (%) - White
Year householder moved into unit - Moved in 1969 or earlier (%) - Black or African American
Year householder moved into unit - Moved in 1969 or earlier (%) - Asian
Year householder moved into unit - Moved in 1969 or earlier (%) - Hispanic or Latino
Year householder moved into unit - Moved in 1969 or earlier (%) - American Indian and Alaska Native
Year householder moved into unit - Moved in 1969 or earlier (%) - Multirace
Year householder moved into unit - Moved in 1969 or earlier (%) - Other Race
Housing units lacking complete plumbing facilities (%)
Housing units lacking complete kitchen facilities (%)
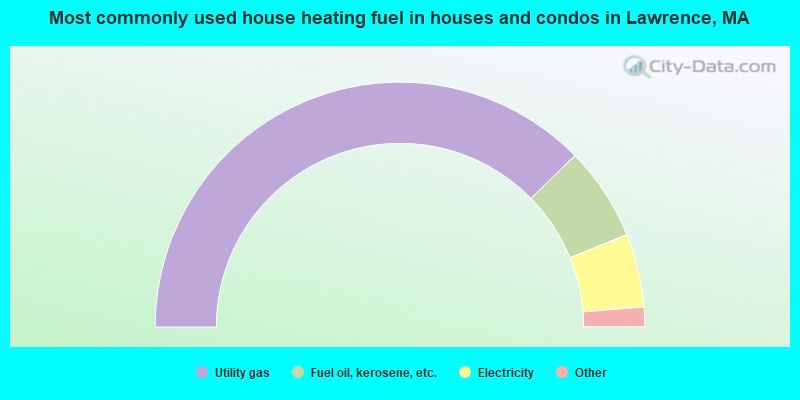
House heating fuel used in houses and condos - Utility gas (%)
House heating fuel used in houses and condos - Bottled, tank, or LP gas (%)
House heating fuel used in houses and condos - Electricity (%)
House heating fuel used in houses and condos - Fuel oil, kerosene, etc. (%)
House heating fuel used in houses and condos - Coal or coke (%)
House heating fuel used in houses and condos - Wood (%)
House heating fuel used in houses and condos - Solar energy (%)
House heating fuel used in houses and condos - Other fuel (%)
House heating fuel used in houses and condos - No fuel used (%)
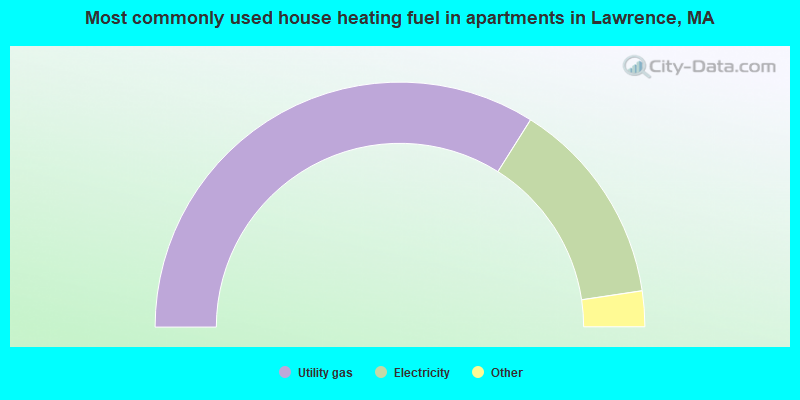
House heating fuel used in apartments - Utility gas (%)
House heating fuel used in apartments - Bottled, tank, or LP gas (%)
House heating fuel used in apartments - Electricity (%)
House heating fuel used in apartments - Fuel oil, kerosene, etc. (%)
House heating fuel used in apartments - Coal or coke (%)
House heating fuel used in apartments - Wood (%)
House heating fuel used in apartments - Solar energy (%)
House heating fuel used in apartments - Other fuel (%)
House heating fuel used in apartments - No fuel used (%)
Latest news about housing in Lawrence, MA collected exclusively by city-data.com from local newspapers, TV, and radio stations
Median year house/condo built: 1945Median year apartment built: 1951Household type by relationship:
Households: 87,952
Male householders: 10,785 (2,529 living alone ), Female householders: 19,088 (3,720 living alone )7,600 spouses (7,163 opposite-sex spouses ), 3,225 unmarried partners , (2,805 opposite-sex unmarried partners ), 31,881 children (29,952 natural , 1,034 adopted , 895 stepchildren ), 2,159 grandchildren , 3,280 brothers or sisters , 4,794 parents , 115 foster children , 2,411 other relatives , 1,926 non-relatives In group quarters: 688
Size of family households: 5,973 2-persons , 6,197 3-persons , 4,746 4-persons , 3,407 5-persons , 731 6-persons , 795 7-or-more-persons .
Size of nonfamily households: 6,249 1-person , 1,382 2-persons , 328 3-persons , 65 4-persons .
5,533 married couples with children. single-parent households (1,873 men , 12,766 women ).
21.5% of residents of Lawrence speak English at home. of residents speak Spanish at home (44% speak English very well , 19% speak English well , 19% speak English not well , 18% don't speak English at all ).of residents speak other Indo-European language at home (70% speak English very well , 18% speak English well , 12% speak English not well , 1% don't speak English at all ).of residents speak Asian or Pacific Island language at home (34% speak English very well , 22% speak English well , 38% speak English not well , 6% don't speak English at all ).of residents speak other language at home (72% speak English very well , 18% speak English well , 10% speak English not well ).
Foreign born population: 40,973 (46.6%)of them are naturalized citizens )
Median number of rooms in houses and condos:
Median number of rooms in apartments
Owner-occupied Renter-occupied
Bedrooms in owner-occupied houses and condos in Lawrence, Massachusetts
137 no bedroom 533 1 bedroom 1,810 2 bedrooms 3,715 3 bedrooms 1,484 4 bedrooms 970 5+ bedrooms
Bedrooms in renter-occupied apartments in Lawrence, Massachusetts
1,183 no bedroom 3,360 1 bedroom 7,410 2 bedrooms 7,793 3 bedrooms 1,379 4 bedrooms 99 5+ bedrooms
Owner-occupied Renter-occupied
Rooms in owner-occupied houses in Lawrence, Massachusetts
137 1 room 76 2 rooms 0 3 rooms 929 4 rooms 1,664 5 rooms 2,286 6 rooms 1,293 7 rooms 783 8 rooms 1,481 9+ rooms
Rooms in renter-occupied apartments in Lawrence, Massachusetts
1,183 1 room 245 2 rooms 3,366 3 rooms 5,711 4 rooms 5,212 5 rooms 3,527 6 rooms 1,214 7 rooms 610 8 rooms 156 9+ rooms
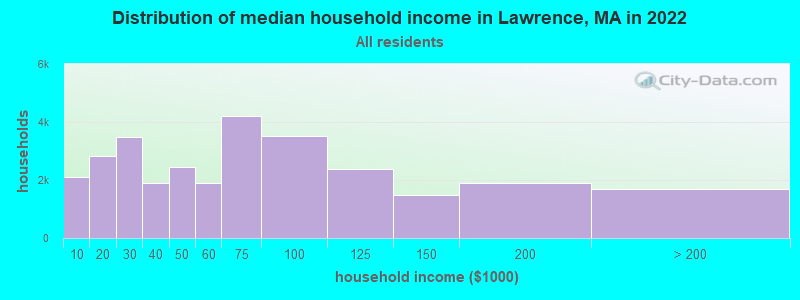
Lawrence, MA household income distribution 2,120 Less than $10,0002,843 $10,000 to $19,9993,496 $20,000 to $29,9991,911 $30,000 to $39,9992,432 $40,000 to $49,9991,894 $50,000 to $59,9994,194 $60,000 to $74,9993,508 $75,000 to $99,9992,393 $100,000 to $124,9991,486 $125,000 to $149,9991,906 $150,000 to $199,9991,690 $200,000 or more
Home value of owner - occupied houses in 2022 in Lawrence, MA 201 Less than $10,00022 $20,000 to $24,99911 $30,000 to $34,99918 $40,000 to $49,9990 $50,000 to $59,99943 $60,000 to $69,99945 $70,000 to $79,99935 $100,000 to $124,99918 $125,000 to $149,999271 $150,000 to $174,99935 $175,000 to $199,9991,135 $200,000 to $249,999643 $250,000 to $299,9992,111 $300,000 to $399,9991,894 $400,000 to $499,9991,378 $500,000 to $749,999221 $750,000 to $999,99937 $1,000,000 to $1,499,99930 $1,500,000 to $1,999,99913 $2,000,000 or moreRent paid by renters in 2022 in Lawrence, MA 197 $100 to $149182 $150 to $199543 $200 to $249319 $250 to $299183 $300 to $349376 $350 to $399128 $400 to $449418 $450 to $499172 $500 to $549277 $550 to $599186 $600 to $64960 $650 to $699160 $700 to $749257 $750 to $799567 $800 to $899795 $900 to $9994,451 $1,000 to $1,2494,553 $1,250 to $1,4995,839 $1,500 to $1,9991,376 $2,000 to $2,499185 No cash rent
Percentage of workers working in this county: 63.2%Number of people working at home: 2,277 (5.6% of all workers )
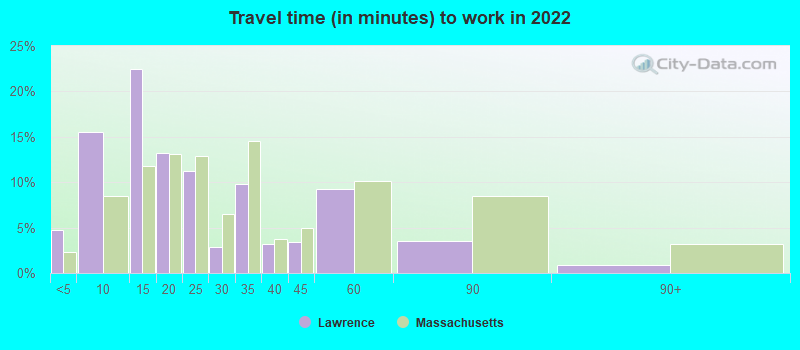
Travel time to work (commute)
Less than 5 minutes: 1,1475 to 9 minutes: 5,37210 to 14 minutes: 8,38515 to 19 minutes: 6,55420 to 24 minutes: 4,21925 to 29 minutes: 2,26730 to 34 minutes: 4,84035 to 39 minutes: 1,45040 to 44 minutes: 1,81845 to 59 minutes: 2,51660 to 89 minutes: 1,46690 or more minutes: 925
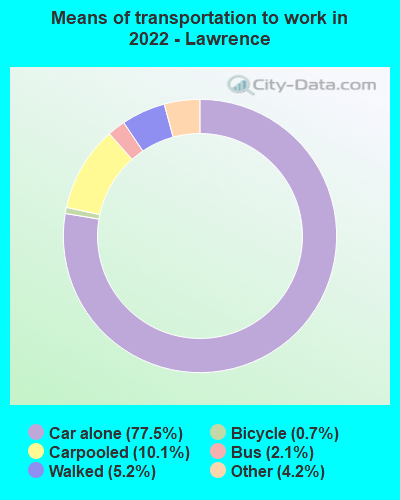
Means of transportation to work:
Drove a car alone: 20,451 (69.9%)Carpooled: 2,041 (7.0%)Bus : 449 (1.5%)Subway or elevated rail : 10 (0.0%)Long-distance train or commuter rail : 13 (0.0%)Taxi: 1,675 (5.7%)Bicycle: 298 (1.0%)Walked: 1,226 (4.2%)Worked at home: 2,277 (7.8%)
Unemployment by race in 2022
Unemployment rate for White non-Hispanic residents 7.4% Males5.5% FemalesUnemployment rate for Black residents 2.9% Males13.7% FemalesUnemployment rate for American Indian and Alaska Native residents 12.1% FemalesUnemployment rate for Asian residents 12.8% Males4.7% FemalesUnemployment rate for other race residents 9.0% Males8.5% FemalesUnemployment rate for two or more race residents 10.7% Males4.9% FemalesUnemployment rate for Hispanic or Latino residents 8.6% Males6.9% Females
Year of entry for the foreign-born population in Lawrence, Massachusetts
20,590 2010 or later 8,912 2000 to 2009 5,969 1990 to 1999 8,094 1980 to 1989 2,656 1970 to 1979 1,772 Before 1970
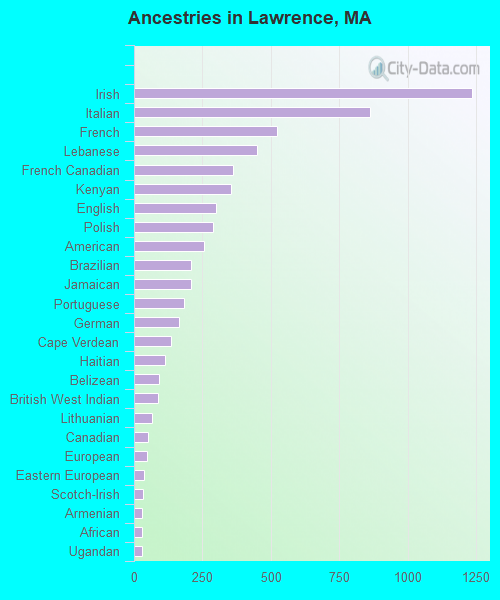
First ancestries reported:
Irish: 1,236 (1.8%)
Italian: 863 (1.3%)
French: 524 (0.8%)
Lebanese: 451 (0.7%)
French Canadian: 363 (0.5%)
Kenyan: 353 (0.5%)
English: 298 (0.4%)
Polish: 288 (0.4%)
American: 255 (0.4%)
Brazilian: 210 (0.3%)
Jamaican: 208 (0.3%)
Portuguese: 181 (0.3%)
German: 164 (0.2%)
Cape Verdean: 136 (0.2%)
Haitian: 115 (0.2%)
Belizean: 91 (0.1%)
British West Indian: 87 (0.1%)
Lithuanian: 64 (0.10%)
Canadian: 52 (0.08%)
European: 46 (0.07%)
Eastern European: 35 (0.05%)
Scotch-Irish: 34 (0.05%)
Armenian: 31 (0.05%)
African: 30 (0.04%)
Ugandan: 28 (0.04%)
Ukrainian: 23 (0.03%)
Swedish: 22 (0.03%)
Greek: 20 (0.03%)
Dutch: 19 (0.03%)
Ethiopian: 17 (0.03%)
West Indian: 17 (0.03%)
Ghanaian: 13 (0.02%)
British: 13 (0.02%)
Iranian: 8 (0.01%)
Norwegian: 8 (0.01%)
Russian: 6 (0.01%)
Scottish: 6 (0.01%)
Finnish: 5 (0.01%) Most common places of birth for foreign-born residents (%): Dominican Republic Lawrence:
78.8% (30,638)Massachusetts:
8.3% (101,767)
Guatemala Lawrence:
6.2% (2,407)Massachusetts:
2.7% (32,733)
Vietnam Lawrence:
1.6% (636)Massachusetts:
3.0% (37,197)
El Salvador Lawrence:
1.6% (632)Massachusetts:
3.7% (45,667)
Place of birth for U.S.-born residents:
This state: 34,198Other state: 6,788Northeast: 4,019Midwest: 0South: 793West: 1,976 88.8% of Lawrence residents lived in the same house 1 years ago.
Out of people who lived in different houses, 38.6% lived in this county.
Out of people who lived in different counties, 64.1% lived in Massachusetts.
Lawrence:
88.8%State average:
87.7%
Education attainment for males 25 years and older:
No schooling: 987Nursery to 4th grade: 6445th and 6th grade: 5277th and 8th grade: 1,2559th grade: 58710th grade: 59411th grade: 71212th grade, no diploma: 1,468High school graduate (or equivalency): 9,758Less than 1 year of college: 1,664Some college more than 1 year, no degree: 2,106Associate degree: 1,202Bachelor's degree: 1,780Master's degree: 681Professional school degree: 0Doctorate degree: 338
Education attainment for females 25 years and older:
No schooling: 706Nursery to 4th grade: 9655th and 6th grade: 4817th and 8th grade: 1,3569th grade: 75810th grade: 62611th grade: 32512th grade, no diploma: 1,006High school graduate (or equivalency): 11,310Less than 1 year of college: 1,434Some college more than 1 year, no degree: 3,050Associate degree: 1,873Bachelor's degree: 4,660Master's degree: 707Professional school degree: 69Doctorate degree: 67
Housing units in structures:
One, detached: 5,235One, attached: 2,402Two: 3,9253 or 4: 10,7815 to 9: 2,81510 to 19: 90620 to 49: 1,17350 or more: 3,307Mobile homes: 167Housing units lacking complete plumbing facilities in 2022: 0.8%Housing units lacking complete kitchen facilities in 2022: 2.8%House/condo owner moved in on average 10 years ago
Renter moved in on average 4 years ago
Private vs. public school enrollment:
Students in private schools in grades 1 to 8 (elementary and middle school): 299 Here:
2.6%Massachusetts:
10.3%
Students in private schools in grades 9 to 12 (high school): 496 Here:
10.4%Massachusetts:
12.3%
Students in private undergraduate colleges: 856 Here:
20.1%Massachusetts:
51.2%