Lawrenceville, GA (Georgia) Houses and Residents
| Lawrenceville: | $355,740 |
| Georgia: | $297,400 |
Total population: 30,212 (Urban population: 22,343, Rural population: 169 (all nonfarm))
Houses: 11,749 (11,064 occupied: 5,287 owner occupied, 5,780 renter occupied)
| % of renters here: | 52% |
| State: | 34% |
Housing density: 904 houses/condos per square mile
Median price asked for vacant for-sale houses and condos in 2022: $364,949.
Median contract rent in 2022: $1,197 (lower quartile is $984, upper quartile is $1,488)
Median rent asked for vacant for-rent units in 2022: $1,568
Median gross rent in Lawrenceville, GA in 2022: $1,414
Housing units in Lawrenceville with a mortgage: 3,386 (219 second mortgage, 0 home equity loan, 212 both second mortgage and home equity loan)
Houses without a mortgage: 172
Median household income for houses/condos with a mortgage: $81,935
Median household income for apartments without a mortgage: $57,623
Median monthly housing costs: $1,332
Compare current foreclosures in Lawrenceville, GA:
| Photo | Address | Area | Beds / Baths | Price | Details |
|---|---|---|---|---|---|

|
#1
Trowbridge Ln
Lawrenceville, GA 30043
|
2,708 sq. feet
|
3 baths 4 beds |
show details | |

|
#2
Havenstone Walk
Lawrenceville, GA 30045
|
- sq. feet
|
3 baths 5 beds |
show details | |

|
#3
Hollywood Dr
Lawrenceville, GA 30044
|
1,812 sq. feet
|
2 baths 3 beds |
show details | |

|
#4
Beacon Cv
Lawrenceville, GA 30043
|
2,786 sq. feet
|
2 baths 4 beds |
show details | |

|
#5
Scholar Dr
Lawrenceville, GA 30044
|
2,152 sq. feet
|
2 baths 3 beds |
show details | |

|
#6
Montecruz Dr
Lawrenceville, GA 30045
|
3,264 sq. feet
|
3 baths 4 beds |
show details | |

|
#7
Stonebrook Way
Lawrenceville, GA 30043
|
4,342 sq. feet
|
3 baths 5 beds |
show details | |

|
#8
Alcovy Bluff Way
Lawrenceville, GA 30045
|
3,926 sq. feet
|
3 baths 5 beds |
show details | |

|
#9
Ridgedale Way
Lawrenceville, GA 30044
|
1,728 sq. feet
|
2 baths 4 beds |
show details | |

|
#10
Tioga Lake Cove
Lawrenceville, GA 30044
|
2,713 sq. feet
|
5 baths 5 beds |
show details |
| Photo | Address | Area | Beds / Baths | Price | Details |
|---|---|---|---|---|---|

|
#11
Cozy Cove Ln
Lawrenceville, GA 30045
|
4,301 sq. feet
|
2 baths 4 beds |
show details | |

|
#12
Snow Owl Way
Lawrenceville, GA 30044
|
2,674 sq. feet
|
1 baths 4 beds |
show details | |

|
#13
Brookgreen Trl
Lawrenceville, GA 30043
|
2,794 sq. feet
|
2 baths 4 beds |
show details | |

|
#14
Montecruz Dr
Lawrenceville, GA 30045
|
3,264 sq. feet
|
2 baths 4 beds |
show details | |

|
#15
Tailmore Ln
Lawrenceville, GA 30043
|
1,704 sq. feet
|
1 baths 2 beds |
show details | |

|
#16
Great Shoals Circle
Lawrenceville, GA 30045
|
- sq. feet
|
4 baths 5 beds |
show details | |

|
#17
Sever Creek Cir
Lawrenceville, GA 30043
|
5,492 sq. feet
|
2 baths 5 beds |
show details | |

|
#18
Dianthus Ln
Lawrenceville, GA 30044
|
1,822 sq. feet
|
2 baths 3 beds |
show details | |

|
#19
Lexus Ct
Lawrenceville, GA 30045
|
3,162 sq. feet
|
3 baths 4 beds |
show details | |

|
#20
Blue Heron Way
Lawrenceville, GA 30043
|
3,394 sq. feet
|
3 baths 4 beds |
show details |
| Photo | Address | Area | Beds / Baths | Price | Details |
|---|---|---|---|---|---|

|
#21
New Hope Rd
Lawrenceville, GA 30046
|
2,398 sq. feet
|
2 baths 4 beds |
show details | |

|
#22
Snow Hill Dr
Lawrenceville, GA 30045
|
1,646 sq. feet
|
2 baths 3 beds |
show details | |

|
#23
Bramlett Forest Ct
Lawrenceville, GA 30045
|
2,454 sq. feet
|
3 baths 4 beds |
show details | |

|
#24
Hiram Davis Rd
Lawrenceville, GA 30045
|
3,406 sq. feet
|
2 baths 3 beds |
show details | |

|
#25
Claredon Dr
Lawrenceville, GA 30043
|
1,286 sq. feet
|
2 baths 4 beds |
show details | |

|
#26
Travers Cir
Lawrenceville, GA 30044
|
2,516 sq. feet
|
2 baths 4 beds |
show details | |

|
#27
Allens Landing Dr
Lawrenceville, GA 30045
|
1,367 sq. feet
|
2 baths 3 beds |
show details | |

|
#28
Mount Vernon Ct
Lawrenceville, GA 30044
|
3,661 sq. feet
|
3 baths 4 beds |
show details | |

|
#29
Suwanee Ct
Lawrenceville, GA 30043
|
1,472 sq. feet
|
2 baths 3 beds |
show details | |

|
#30
Paden Dr
Lawrenceville, GA 30044
|
1,384 sq. feet
|
2 baths 3 beds |
show details |
| Photo | Address | Area | Beds / Baths | Price | Details |
|---|---|---|---|---|---|

|
#31
Winthrope Way
Lawrenceville, GA 30044
|
3,304 sq. feet
|
3 baths 4 beds |
show details | |

|
#32
Flowing Spring Ct
Lawrenceville, GA 30043
|
2,891 sq. feet
|
2 baths 4 beds |
show details | |

|
#33
Spin Drift Way
Lawrenceville, GA 30043
|
2,486 sq. feet
|
3 baths 4 beds |
show details | |

|
#34
Cedar Farms Dr
Lawrenceville, GA 30043
|
1,728 sq. feet
|
2 baths 3 beds |
show details | |

|
#35
Beeblossom Trl
Lawrenceville, GA 30044
|
1,744 sq. feet
|
2 baths 3 beds |
show details | |

|
#36
Clairidge Oak Ct
Lawrenceville, GA 30046
|
2,273 sq. feet
|
2 baths 3 beds |
show details | |

|
#37
Paris Dr
Lawrenceville, GA 30043
|
1,818 sq. feet
|
2 baths 3 beds |
show details | |

|
#38
Prestwyck Oak Pl
Lawrenceville, GA 30043
|
1,497 sq. feet
|
2 baths 3 beds |
show details | |

|
#39
Porter Dr
Lawrenceville, GA 30044
|
1,395 sq. feet
|
2 baths 3 beds |
show details | |

|
#40
Streamwater Cv
Lawrenceville, GA 30045
|
2,129 sq. feet
|
2 baths 4 beds |
show details |
| Photo | Address | Area | Beds / Baths | Price | Details |
|---|---|---|---|---|---|

|
#41
Adams Landing Ct
Lawrenceville, GA 30046
|
3,598 sq. feet
|
2 baths 4 beds |
show details | |

|
#42
Oakland Chase Ct
Lawrenceville, GA 30044
|
1,654 sq. feet
|
2 baths 3 beds |
show details | |

|
#43
Paden Dr
Lawrenceville, GA 30044
|
1,246 sq. feet
|
1 baths 3 beds |
show details | |

|
#44
Saddle Path Bnd
Lawrenceville, GA 30046
|
2,181 sq. feet
|
2 baths 4 beds |
show details | |

|
#45
Tab Roberts Rd
Lawrenceville, GA 30043
|
1,788 sq. feet
|
2 baths 3 beds |
show details | |

|
#46
Franklin Rd
Lawrenceville, GA 30044
|
1,056 sq. feet
|
1 baths 3 beds |
show details | |

|
#47
Kiner Ct
Lawrenceville, GA 30043
|
1,583 sq. feet
|
2 baths 3 beds |
show details | |

|
#48
Chandler Ridge Dr
Lawrenceville, GA 30045
|
2,284 sq. feet
|
2 baths 3 beds |
show details | |

|
#49
Andrew Ct
Lawrenceville, GA 30043
|
1,969 sq. feet
|
2 baths 3 beds |
show details | |

|
Check over 1 million property listings on Foreclosure.com!
|
browse all offers | |||

Latest news about housing in Lawrenceville, GA collected exclusively by city-data.com from local newspapers, TV, and radio stations


Median year apartment built: 1988
Household type by relationship:
Households: 31,017- Male householders: 4,933 (1,023 living alone), Female householders: 6,023 (1,959 living alone)
4,809 spouses (4,786 opposite-sex spouses), 744 unmarried partners, (744 opposite-sex unmarried partners), 10,247 children (9,504 natural, 375 adopted, 367 stepchildren), 720 grandchildren, 492 brothers or sisters, 849 parents, 29 foster children, 874 other relatives, 768 non-relatives
- In group quarters: 523
Size of family households: 2,720 2-persons, 2,307 3-persons, 967 4-persons, 1,000 5-persons, 318 6-persons, 236 7-or-more-persons.
Size of nonfamily households: 2,909 1-person, 444 2-persons, 152 3-persons.
4,319 married couples with children.
2,188 single-parent households (432 men, 1,756 women).
60.0% of residents of Lawrenceville speak English at home.
20.5% of residents speak Spanish at home (53% speak English very well, 14% speak English well, 20% speak English not well, 12% don't speak English at all).
8.9% of residents speak other Indo-European language at home (54% speak English very well, 31% speak English well, 14% speak English not well, 1% don't speak English at all).
6.0% of residents speak Asian or Pacific Island language at home (55% speak English very well, 15% speak English well, 21% speak English not well, 9% don't speak English at all).
5.1% of residents speak other language at home (87% speak English very well, 6% speak English well, 2% speak English not well, 5% don't speak English at all).
Foreign born population: 10,251 (33.0%)
(42.7% of them are naturalized citizens)
| Here: | 6.3 |
| State: | 6.8 |
| Here: | 4.6 |
| State: | 4.6 |

- Bedrooms in owner-occupied houses and condos in Lawrenceville, Georgia
- 10no bedroom
- 331 bedroom
- 1622 bedrooms
- 3,4323 bedrooms
- 1,1624 bedrooms
- 4875+ bedrooms

- Bedrooms in renter-occupied apartments in Lawrenceville, Georgia
- 115no bedroom
- 8721 bedroom
- 2,1472 bedrooms
- 2,2613 bedrooms
- 3544 bedrooms
- 325+ bedrooms

- Cars and other vehicles available in Lawrenceville in owner-occupied houses/condos
- 587no vehicle
- 1,1701 vehicle
- 2,1192 vehicles
- 9363 vehicles
- 4574 vehicles
- 195+ vehicles

- Cars and other vehicles available in Lawrenceville in renter-occupied apartments
- 962no vehicle
- 2,4661 vehicle
- 1,9752 vehicles
- 2743 vehicles
- 704 vehicles
- 355+ vehicles

- Rooms in owner-occupied houses in Lawrenceville, Georgia
- 101 room
- 02 rooms
- 203 rooms
- 814 rooms
- 1,7515 rooms
- 1,1916 rooms
- 8097 rooms
- 4778 rooms
- 9479+ rooms

- Rooms in renter-occupied apartments in Lawrenceville, Georgia
- 1151 room
- 792 rooms
- 8303 rooms
- 1,6504 rooms
- 1,6655 rooms
- 8306 rooms
- 2967 rooms
- 1778 rooms
- 1399+ rooms


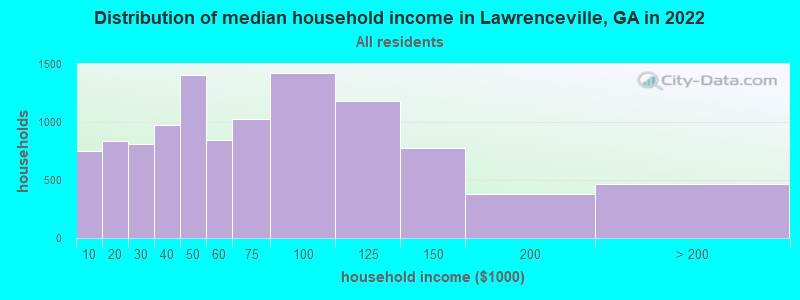
Lawrenceville, GA household income distribution

- 753Less than $10,000
- 836$10,000 to $19,999
- 814$20,000 to $29,999
- 970$30,000 to $39,999
- 1,406$40,000 to $49,999
- 841$50,000 to $59,999
- 1,028$60,000 to $74,999
- 1,422$75,000 to $99,999
- 1,185$100,000 to $124,999
- 775$125,000 to $149,999
- 381$150,000 to $199,999
- 464$200,000 or more
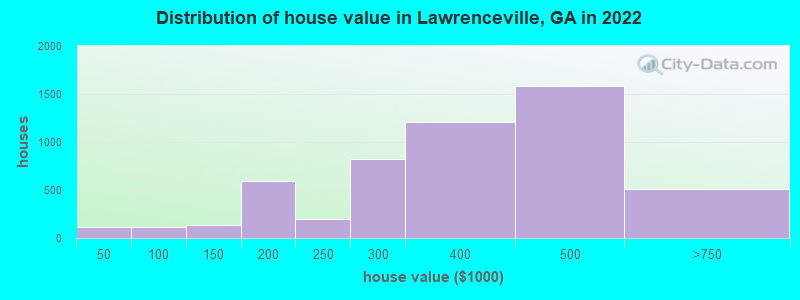
Home value of owner - occupied houses in 2022 in Lawrenceville, GA
-
- 82Less than $10,000
- 11$10,000 to $14,999
- 17$30,000 to $34,999
- 36$70,000 to $79,999
- 62$80,000 to $89,999
- 10$90,000 to $99,999
- 44$100,000 to $124,999
- 95$125,000 to $149,999
- 268$150,000 to $174,999
- 321$175,000 to $199,999
- 193$200,000 to $249,999
- 828$250,000 to $299,999
- 1,208$300,000 to $399,999
- 1,587$400,000 to $499,999
- 502$500,000 to $749,999
- 4$750,000 to $999,999
Rent paid by renters in 2022 in Lawrenceville, GA
-
- 27Less than $100
- 62$100 to $149
- 109$200 to $249
- 54$250 to $299
- 20$300 to $349
- 54$350 to $399
- 7$450 to $499
- 125$500 to $549
- 28$550 to $599
- 86$600 to $649
- 23$650 to $699
- 302$700 to $749
- 50$750 to $799
- 443$800 to $899
- 422$900 to $999
- 1,341$1,000 to $1,249
- 829$1,250 to $1,499
- 1,249$1,500 to $1,999
- 33$2,000 to $2,499
- 42$3,500 or more
- 86No cash rent


Percentage of workers working in this county: 76.9%
Number of people working at home: 1,476 (10.0% of all workers)
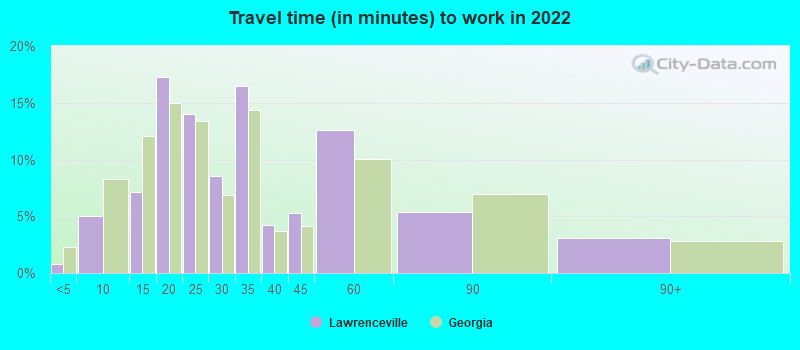
Travel time to work (commute)
- Less than 5 minutes: 0
- 5 to 9 minutes: 965
- 10 to 14 minutes: 1,003
- 15 to 19 minutes: 1,627
- 20 to 24 minutes: 1,941
- 25 to 29 minutes: 660
- 30 to 34 minutes: 1,844
- 35 to 39 minutes: 474
- 40 to 44 minutes: 724
- 45 to 59 minutes: 1,809
- 60 to 89 minutes: 1,765
- 90 or more minutes: 332
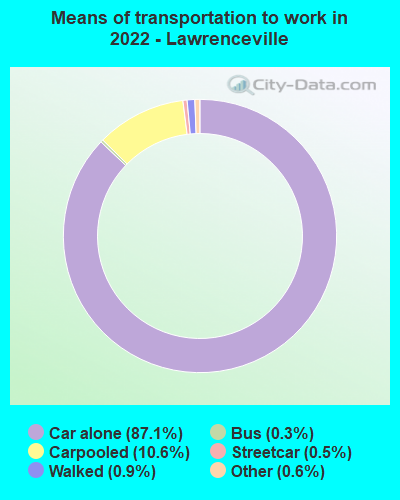
Means of transportation to work:
- Drove a car alone: 34,461 (79.5%)
- Carpooled: 5,007 (11.6%)
- Bus: 153 (0.4%)
- Subway or elevated rail: 198 (0.5%)
- Taxi: 345 (0.8%)
- Walked: 434 (1.0%)
- Worked at home: 1,476 (3.4%)

- Unemployment by race in 2022
- Unemployment rate for White non-Hispanic residents
- 2.6%Males
- 0.6%Females
- Unemployment rate for Black residents
- 8.3%Males
- 19.1%Females
- Unemployment rate for Asian residents
- 5.9%Males
- 5.2%Females
- Unemployment rate for other race residents
- 3.3%Females
- Unemployment rate for two or more race residents
- 0.8%Males
- 7.8%Females
- Unemployment rate for Hispanic or Latino residents
- 3.7%Females

- Year of entry for the foreign-born population in Lawrenceville, Georgia
- 4,2112010 or later
- 3,4022000 to 2009
- 1,8221990 to 1999
- 1,0131980 to 1989
- 1471970 to 1979
- 165Before 1970
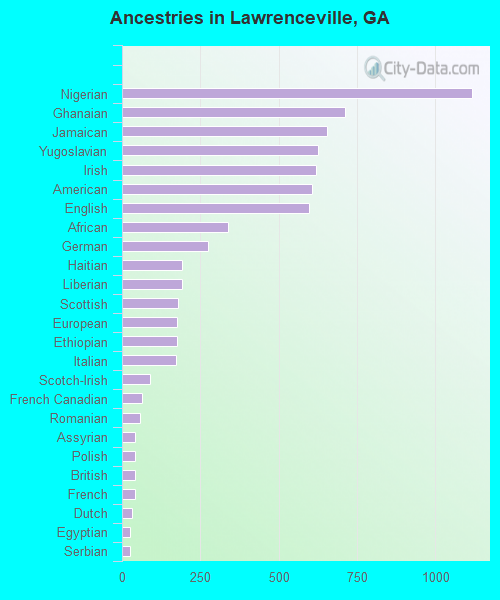
First ancestries reported:
- Nigerian: 1,116 (6.0%)
- Ghanaian: 711 (3.8%)
- Jamaican: 654 (3.5%)
- Yugoslavian: 625 (3.3%)
- Irish: 618 (3.3%)
- American: 608 (3.3%)
- English: 597 (3.2%)
- African: 340 (1.8%)
- German: 275 (1.5%)
- Haitian: 192 (1.0%)
- Liberian: 191 (1.0%)
- Scottish: 180 (1.0%)
- European: 176 (0.9%)
- Ethiopian: 175 (0.9%)
- Italian: 174 (0.9%)
- Scotch-Irish: 89 (0.5%)
- French Canadian: 64 (0.3%)
- Romanian: 57 (0.3%)
- Assyrian: 42 (0.2%)
- Polish: 42 (0.2%)
- British: 40 (0.2%)
- French: 40 (0.2%)
- Dutch: 31 (0.2%)
- Egyptian: 27 (0.1%)
- Serbian: 25 (0.1%)
- Iranian: 19 (0.1%)
- Moroccan: 18 (0.10%)
- Somali: 17 (0.09%)
- Czech: 12 (0.06%)
- Austrian: 11 (0.06%)
- Celtic: 10 (0.05%)
- Norwegian: 9 (0.05%)
- Canadian: 7 (0.04%)
- Greek: 6 (0.03%)
- Sierra Leonean: 5 (0.03%)
- U.S. Virgin Islander: 5 (0.03%)
Most common places of birth for foreign-born residents (%):
| Lawrenceville: | 12.1% (1,233) |
| Georgia: | 20.0% (223,400) |
| Lawrenceville: | 9.9% (1,006) |
| Georgia: | 4.1% (45,797) |
| Lawrenceville: | 9.7% (989) |
| Georgia: | 3.6% (39,974) |
| Lawrenceville: | 9.0% (914) |
| Georgia: | 2.5% (27,846) |
| Lawrenceville: | 7.7% (782) |
| Georgia: | 1.0% (11,747) |
| Lawrenceville: | 6.1% (615) |
| Georgia: | 2.5% (27,794) |
| Lawrenceville: | 5.4% (550) |
| Georgia: | 0.2% (1,945) |
| Lawrenceville: | 4.8% (487) |
| Georgia: | 1.2% (12,946) |
| Lawrenceville: | 4.4% (451) |
| Georgia: | 4.6% (51,270) |
| Lawrenceville: | 4.1% (416) |
| Georgia: | 3.5% (39,227) |
| Lawrenceville: | 3.0% (305) |
| Georgia: | 0.4% (4,775) |
| Lawrenceville: | 2.1% (215) |
| Georgia: | 0.7% (7,441) |
| Lawrenceville: | 1.9% (196) |
| Georgia: | 2.1% (23,813) |
| Lawrenceville: | 1.9% (196) |
| Georgia: | 1.1% (11,847) |
| Lawrenceville: | 1.7% (171) |
| Georgia: | 1.6% (17,476) |
| Lawrenceville: | 1.5% (153) |
| Georgia: | 1.1% (12,223) |
Place of birth for U.S.-born residents:
- This state: 10,543
- Other state: 9,848
- Northeast: 2,384
- Midwest: 1,761
- South: 4,494
- West: 1,221
82.9% of Lawrenceville residents lived in the same house 1 years ago.
Out of people who lived in different houses, 35.1% lived in this county.
Out of people who lived in different counties, 39.4% lived in Georgia.
| Lawrenceville: | 82.9% |
| State average: | 86.6% |
Education attainment for males 25 years and older:
- No schooling: 339
- Nursery to 4th grade: 60
- 5th and 6th grade: 169
- 7th and 8th grade: 151
- 9th grade: 237
- 10th grade: 40
- 11th grade: 43
- 12th grade, no diploma: 359
- High school graduate (or equivalency): 2,411
- Less than 1 year of college: 379
- Some college more than 1 year, no degree: 1,000
- Associate degree: 1,057
- Bachelor's degree: 1,221
- Master's degree: 510
- Professional school degree: 113
- Doctorate degree: 145

Education attainment for females 25 years and older:
- No schooling: 240
- Nursery to 4th grade: 128
- 5th and 6th grade: 82
- 7th and 8th grade: 179
- 9th grade: 114
- 10th grade: 74
- 11th grade: 56
- 12th grade, no diploma: 284
- High school graduate (or equivalency): 3,318
- Less than 1 year of college: 825
- Some college more than 1 year, no degree: 1,657
- Associate degree: 1,185
- Bachelor's degree: 2,261
- Master's degree: 550
- Professional school degree: 55
- Doctorate degree: 21


Housing units in structures:
- One, detached: 6,326
- One, attached: 1,216
- Two: 944
- 3 or 4: 172
- 5 to 9: 786
- 10 to 19: 767
- 20 to 49: 557
- 50 or more: 845
- Mobile homes: 107
- Boats, RVs, vans, etc.: 24
Housing units lacking complete kitchen facilities in 2022: 0.6%
House/condo owner moved in on average 12 years ago
Renter moved in on average 5 years ago

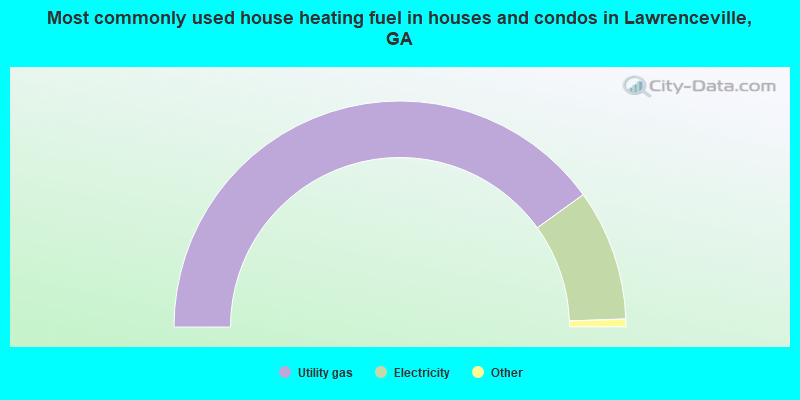
- 80.2%Utility gas
- 18.8%Electricity
- 0.7%Bottled, tank, or LP gas
- 0.3%No fuel used
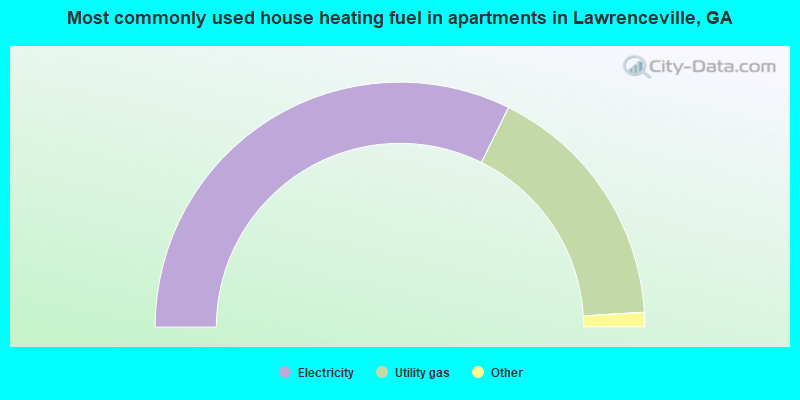
- 64.7%Electricity
- 33.5%Utility gas
- 1.0%No fuel used
- 0.5%Other fuel
- 0.3%Bottled, tank, or LP gas
Private vs. public school enrollment:
| Here: | 4.2% |
| Georgia: | 12.1% |
| Here: | 3.1% |
| Georgia: | 10.8% |
| Here: | 16.5% |
| Georgia: | 17.1% |


