Le Grand, CA (California) Houses and Residents
| Le Grand: | $272,706 |
| California: | $715,900 |
Total population: 1,659 (Urban population: 0, Rural population: 1,731 (20 farm, 1,711 nonfarm))
Houses: 534 (511 occupied: 337 owner occupied, 191 renter occupied)
| % of renters here: | 36% |
| State: | 44% |
Housing density: 149 houses/condos per square mile
Median price asked for vacant for-sale houses and condos in 2022 in this county: $426,595.
Median contract rent in 2022: $743 (lower quartile is $543, upper quartile is $916)
Median gross rent in Le Grand, CA in 2022: $983
Housing units in Le Grand with a mortgage: 259 (2 second mortgage, 0 home equity loan, 0 both second mortgage and home equity loan)
Houses without a mortgage: 29
Median household income for houses/condos with a mortgage: $67,062
Median household income for apartments without a mortgage: $66,399
Median monthly housing costs: $935
Compare current foreclosures near Le Grand, CA:
| Photo | Address | Area | Beds / Baths | Price | Details |
|---|---|---|---|---|---|

|
#1
Kennedy St
Le Grand, CA 95333
|
1,250 sq. feet
|
2 baths 4 beds |
show details | |

|
#2
Washington St
Le Grand, CA 95333
|
- sq. feet
|
- baths - beds |
show details | |

|
#3
Washington Ave
Le Grand, CA 95333
|
- sq. feet
|
- baths - beds |
show details | |

|
#4
Gerard Ave
Le Grand, CA 95333
|
- sq. feet
|
- baths - beds |
show details | |

|
#5
Marian Ct
Merced, CA 95341
|
- sq. feet
|
2 baths 4 beds |
show details | |

|
#6
San Pablo Ave
Merced, CA 95348
|
1,901 sq. feet
|
2 baths 3 beds |
show details | |

|
#7
Harp Ct
Merced, CA 95341
|
- sq. feet
|
2 baths 4 beds |
show details | |

|
#8
Avenue 18 # 18
Madera, CA 93637
|
1,906 sq. feet
|
2 baths 4 beds |
show details | |

|
#9
Orchard Ln
Merced, CA 95340
|
701 sq. feet
|
1 baths 2 beds |
show details | |

|
#10
Bright Ct
Merced, CA 95348
|
1,406 sq. feet
|
2 baths 4 beds |
show details |
| Photo | Address | Area | Beds / Baths | Price | Details |
|---|---|---|---|---|---|

|
#11
E Alexander Ave
Merced, CA 95340
|
2,152 sq. feet
|
2 baths 3 beds |
show details | |

|
#12
El Portal Dr
Merced, CA 95340
|
2,410 sq. feet
|
3 baths 4 beds |
show details | |

|
#13
Las Brisas Ct
Merced, CA 95341
|
1,313 sq. feet
|
2 baths 3 beds |
show details | |

|
#14
Northwood Dr
Merced, CA 95348
|
2,093 sq. feet
|
2 baths 5 beds |
show details | |

|
#15
Swan Ct
Merced, CA 95340
|
1,823 sq. feet
|
2 baths 3 beds |
show details | |

|
#16
La Purisima St
Merced, CA 95341
|
1,277 sq. feet
|
2 baths 4 beds |
show details | |

|
#17
W 22nd St
Merced, CA 95340
|
955 sq. feet
|
1 baths 3 beds |
show details | |

|
#18
Casual Ct
Merced, CA 95340
|
2,036 sq. feet
|
2 baths 4 beds |
show details | |

|
#19
K St
Merced, CA 95341
|
3,000 sq. feet
|
4 baths 8 beds |
show details | |

|
#20
Wren Ct
Merced, CA 95340
|
1,621 sq. feet
|
2 baths 3 beds |
show details |
| Photo | Address | Area | Beds / Baths | Price | Details |
|---|---|---|---|---|---|

|
#21
Occidental Ct
Merced, CA 95348
|
1,120 sq. feet
|
2 baths 3 beds |
show details | |

|
#22
W 23rd St
Merced, CA 95340
|
996 sq. feet
|
1 baths 2 beds |
show details | |

|
#23
Cherokee Ave
Merced, CA 95340
|
1,706 sq. feet
|
2 baths 4 beds |
show details | |

|
#24
La Jolla Dr
Merced, CA 95348
|
1,412 sq. feet
|
2 baths 3 beds |
show details | |

|
#25
R St
Merced, CA 95340
|
1,227 sq. feet
|
2 baths 3 beds |
show details | |

|
#26
Mathias Way
Merced, CA 95348
|
1,663 sq. feet
|
2 baths 3 beds |
show details | |

|
#27
La Sierra St
Merced, CA 95348
|
2,648 sq. feet
|
3 baths 5 beds |
show details | |

|
#28
Gove Rd
Merced, CA 95341
|
560 sq. feet
|
1 baths 2 beds |
show details | |

|
#29
San Isidro Ave
Merced, CA 95348
|
2,170 sq. feet
|
2 baths 4 beds |
show details | |

|
#30
Cheyenne Dr
Merced, CA 95348
|
1,147 sq. feet
|
2 baths 3 beds |
show details |
| Photo | Address | Area | Beds / Baths | Price | Details |
|---|---|---|---|---|---|

|
#31
Constitution Ct
Merced, CA 95341
|
1,022 sq. feet
|
2 baths 3 beds |
show details | |

|
#32
Jacobs Dr
Merced, CA 95348
|
1,832 sq. feet
|
3 baths 4 beds |
show details | |

|
#33
Ellison Pl
Merced, CA 95348
|
2,411 sq. feet
|
2 baths 4 beds |
show details | |

|
#34
W 12th St
Merced, CA 95341
|
1,142 sq. feet
|
1 baths 2 beds |
show details | |

|
#35
Creekside Dr
Merced, CA 95348
|
1,290 sq. feet
|
2 baths 3 beds |
show details | |

|
#36
Villanova Ct
Merced, CA 95348
|
1,866 sq. feet
|
2 baths 3 beds |
show details | |

|
#37
Princeton Ct
Merced, CA 95348
|
1,577 sq. feet
|
2 baths 3 beds |
show details | |

|
#38
W 21st St
Merced, CA 95340
|
1,537 sq. feet
|
1 baths 3 beds |
show details | |

|
#39
E 20th St
Merced, CA 95340
|
1,025 sq. feet
|
1 baths 2 beds |
show details | |

|
#40
W Childs Ave
Merced, CA 95341
|
1,236 sq. feet
|
2 baths 3 beds |
show details |
| Photo | Address | Area | Beds / Baths | Price | Details |
|---|---|---|---|---|---|

|
#41
El Camino Real
Merced, CA 95340
|
1,757 sq. feet
|
2 baths 3 beds |
show details | |

|
#42
Swan Ct
Merced, CA 95340
|
1,434 sq. feet
|
2 baths 3 beds |
show details | |

|
#43
Green St
Merced, CA 95340
|
1,264 sq. feet
|
2 baths 3 beds |
show details | |

|
#44
Bennington Ct
Merced, CA 95340
|
2,120 sq. feet
|
2 baths 4 beds |
show details | |

|
#45
Mallard Cove Dr
Chowchilla, CA 93610
|
- sq. feet
|
3 baths 5 beds |
show details | |

|
#46
Azalea Ct
Merced, CA 95341
|
1,272 sq. feet
|
2 baths 3 beds |
show details | |

|
#47
E Childs Ave
Merced, CA 95341
|
1,429 sq. feet
|
1 baths 2 beds |
show details | |

|
#48
Vega Ct
Merced, CA 95341
|
1,187 sq. feet
|
2 baths 3 beds |
show details | |

|
#49
Birchwood Ct
Merced, CA 95341
|
1,603 sq. feet
|
2 baths 3 beds |
show details | |

|
Check over 1 million property listings on Foreclosure.com!
|
browse all offers | |||


 | Nonwhite youth population growing in California and nation, report finds (30 replies) |

Median year apartment built: 1981
Household type by relationship:
Households: 1,724- Male householders: 180 (33 living alone), Female householders: 330 (66 living alone)
248 spouses (248 opposite-sex spouses), 51 unmarried partners, (51 opposite-sex unmarried partners), 667 children (650 natural, 2 adopted, 15 stepchildren), 95 grandchildren, 15 brothers or sisters, 18 parents, 0 foster children, 62 other relatives, 53 non-relatives
Size of family households: 123 2-persons, 128 3-persons, 52 4-persons, 50 5-persons, 40 6-persons, 25 7-or-more-persons.
Size of nonfamily households: 103 1-person, 5 2-persons, 3 3-persons.
180 married couples with children.
225 single-parent households (128 men, 97 women).
47.1% of residents of Le Grand speak English at home.
53.0% of residents speak Spanish at home (51% speak English very well, 16% speak English well, 9% speak English not well, 25% don't speak English at all).
0.9% of residents speak Asian or Pacific Island language at home (50% speak English very well, 14% speak English well, 36% don't speak English at all).
Foreign born population: 416 (24.1%)
(29.1% of them are naturalized citizens)
| Here: | 5.2 |
| State: | 6.0 |
| Here: | 4.8 |
| State: | 3.9 |

- Bedrooms in owner-occupied houses and condos in Le Grand, California
- 0no bedroom
- 81 bedroom
- 702 bedrooms
- 1893 bedrooms
- 704 bedrooms
- 05+ bedrooms

- Bedrooms in renter-occupied apartments in Le Grand, California
- 10no bedroom
- 31 bedroom
- 812 bedrooms
- 773 bedrooms
- 204 bedrooms
- 05+ bedrooms

- Cars and other vehicles available in Le Grand in owner-occupied houses/condos
- 33no vehicle
- 541 vehicle
- 1012 vehicles
- 1063 vehicles
- 274 vehicles
- 175+ vehicles

- Cars and other vehicles available in Le Grand in renter-occupied apartments
- 27no vehicle
- 721 vehicle
- 462 vehicles
- 253 vehicles
- 164 vehicles
- 55+ vehicles

- Rooms in owner-occupied houses in Le Grand, California
- 01 room
- 02 rooms
- 143 rooms
- 474 rooms
- 1355 rooms
- 766 rooms
- 397 rooms
- 228 rooms
- 49+ rooms

- Rooms in renter-occupied apartments in Le Grand, California
- 101 room
- 02 rooms
- 03 rooms
- 584 rooms
- 705 rooms
- 406 rooms
- 57 rooms
- 38 rooms
- 49+ rooms


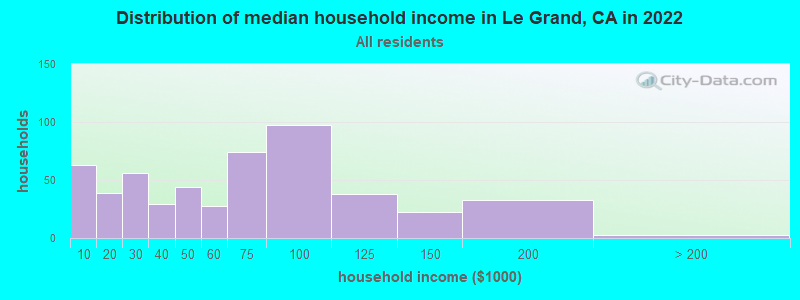
Le Grand, CA household income distribution

- 63Less than $10,000
- 39$10,000 to $19,999
- 56$20,000 to $29,999
- 29$30,000 to $39,999
- 44$40,000 to $49,999
- 28$50,000 to $59,999
- 74$60,000 to $74,999
- 97$75,000 to $99,999
- 38$100,000 to $124,999
- 22$125,000 to $149,999
- 33$150,000 to $199,999
- 3$200,000 or more
Home value of owner - occupied houses in 2022 in Le Grand, CA
-
- 7$40,000 to $49,999
- 9$50,000 to $59,999
- 6$60,000 to $69,999
- 8$70,000 to $79,999
- 1$90,000 to $99,999
- 3$100,000 to $124,999
- 11$125,000 to $149,999
- 37$150,000 to $174,999
- 7$175,000 to $199,999
- 23$200,000 to $249,999
- 41$250,000 to $299,999
- 74$300,000 to $399,999
- 40$400,000 to $499,999
- 23$500,000 to $749,999

Rent paid by renters in 2022 in Le Grand, CA
-
- 5Less than $100
- 8$200 to $249
- 8$450 to $499
- 12$500 to $549
- 8$550 to $599
- 6$600 to $649
- 10$650 to $699
- 2$700 to $749
- 3$750 to $799
- 23$800 to $899
- 28$900 to $999
- 23$1,000 to $1,249
- 2$1,250 to $1,499
- 18No cash rent


Percentage of workers working in this county: 73.2%
Number of people working at home: 39 (5.6% of all workers)

Travel time to work (commute)
- Less than 5 minutes: 30
- 5 to 9 minutes: 56
- 10 to 14 minutes: 103
- 15 to 19 minutes: 35
- 20 to 24 minutes: 98
- 25 to 29 minutes: 26
- 30 to 34 minutes: 142
- 35 to 39 minutes: 50
- 40 to 44 minutes: 15
- 45 to 59 minutes: 23
- 60 to 89 minutes: 83
- 90 or more minutes: 19
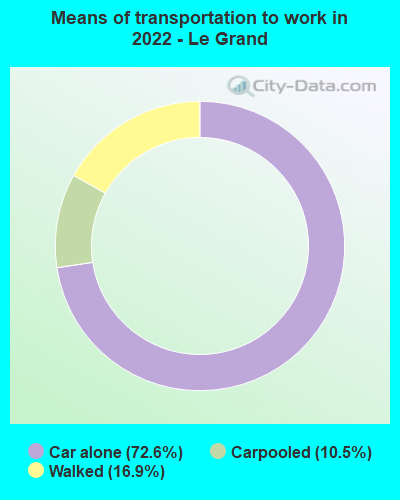
Means of transportation to work:
- Drove a car alone: 322 (64.1%)
- Carpooled: 37 (7.4%)
- Walked: 106 (21.1%)
- Worked at home: 48 (9.6%)

- Unemployment by race in 2022
- Unemployment rate for White non-Hispanic residents
- 6.5%Males
- 8.6%Females
- Unemployment rate for other race residents
- 5.8%Males
- 8.4%Females
- Unemployment rate for two or more race residents
- 39.4%Males
- 6.6%Females
- Unemployment rate for Hispanic or Latino residents
- 9.3%Males
- 9.8%Females

- Year of entry for the foreign-born population in Le Grand, California
- 612010 or later
- 302000 to 2009
- 1541990 to 1999
- 1131980 to 1989
- 1461970 to 1979
- 107Before 1970

First ancestries reported:
- Portuguese: 19 (1.5%)
- Italian: 15 (1.2%)
- English: 8 (0.6%)
- Irish: 7 (0.6%)
- British: 2 (0.2%)
- European: 2 (0.2%)
- German: 2 (0.2%)
- Scottish: 2 (0.2%)
Most common places of birth for foreign-born residents (%):
| Le Grand: | 97.0% (424) |
| California: | 37.2% (3,881,193) |
Place of birth for U.S.-born residents:
- This state: 1,260
- Other state: 61
- Northeast: 12
- Midwest: 4
- South: 22
- West: 19
93.8% of Le Grand residents lived in the same house 1 years ago.
Out of people who lived in different houses, 52.5% lived in this county.
Out of people who lived in different counties, 100.0% lived in California.
| Le Grand: | 93.8% |
| State average: | 88.9% |
Education attainment for males 25 years and older:
- No schooling: 63
- Nursery to 4th grade: 16
- 5th and 6th grade: 34
- 7th and 8th grade: 25
- 9th grade: 9
- 10th grade: 0
- 11th grade: 0
- 12th grade, no diploma: 13
- High school graduate (or equivalency): 163
- Less than 1 year of college: 31
- Some college more than 1 year, no degree: 71
- Associate degree: 22
- Bachelor's degree: 41
- Master's degree: 15
- Professional school degree: 0
- Doctorate degree: 0

Education attainment for females 25 years and older:
- No schooling: 61
- Nursery to 4th grade: 23
- 5th and 6th grade: 51
- 7th and 8th grade: 33
- 9th grade: 3
- 10th grade: 0
- 11th grade: 3
- 12th grade, no diploma: 2
- High school graduate (or equivalency): 125
- Less than 1 year of college: 27
- Some college more than 1 year, no degree: 93
- Associate degree: 32
- Bachelor's degree: 78
- Master's degree: 4
- Professional school degree: 0
- Doctorate degree: 0


Housing units in structures:
- One, detached: 451
- One, attached: 6
- Two: 8
- 3 or 4: 14
- 5 to 9: 13
- 10 to 19: 11
- 50 or more: 9
- Mobile homes: 20
House/condo owner moved in on average 14 years ago
Renter moved in on average 6 years ago

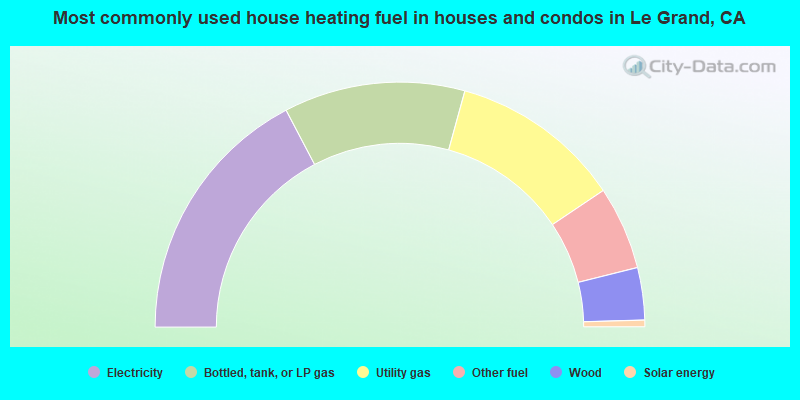
- 34.6%Electricity
- 23.9%Bottled, tank, or LP gas
- 22.6%Utility gas
- 11.0%Other fuel
- 6.9%Wood
- 0.9%Solar energy
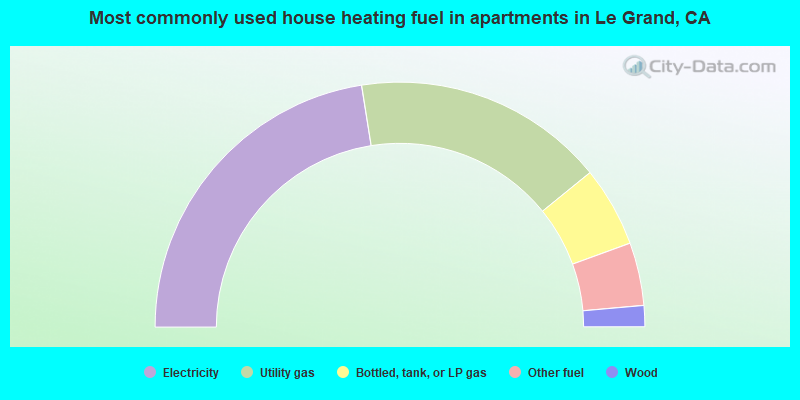
- 45.0%Electricity
- 33.3%Utility gas
- 10.6%Bottled, tank, or LP gas
- 8.3%Other fuel
- 2.8%Wood
Private vs. public school enrollment:
| Here: | 0.0% |
| California: | 10.5% |
| Here: | 2.1% |
| California: | 8.5% |
| Here: | 35.9% |
| California: | 15.9% |


