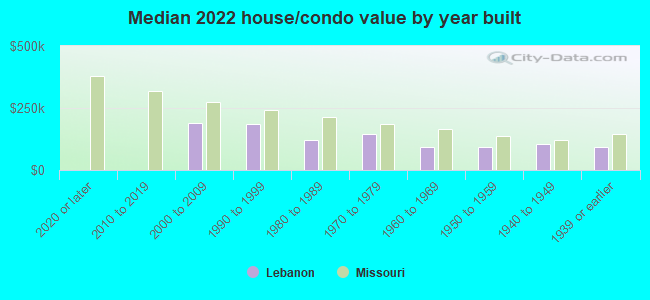
Lebanon, MO (Missouri) Houses and Residents
| Lebanon: | $154,197 |
| Missouri: | $221,200 |
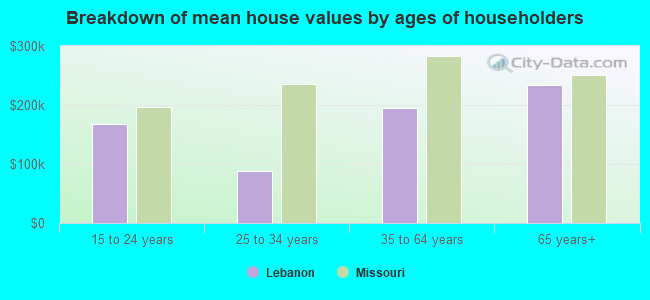
Mean price in 2022:
Detached houses: $165,403
Here: $165,403 State: $278,068 Townhouses or other attached units: $198,208
Here: $198,208 State: $260,773 Mobile homes: $39,237
Here: $39,237 State: $95,912
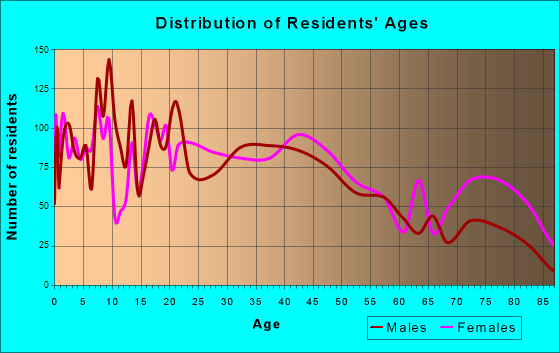
Total population: 14,650 (Urban population: 11,428 (all inside urban clusters), Rural population: 836 (51 farm, 785 nonfarm))
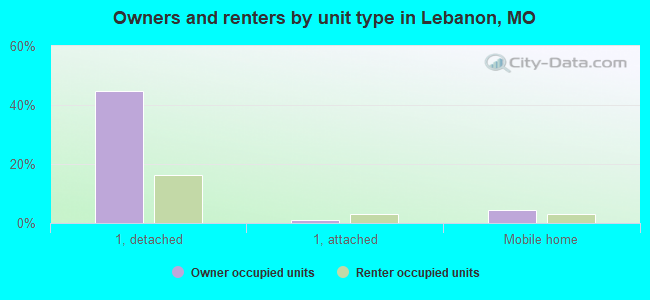
Houses: 6,864 (6,182 occupied: 3,289 owner occupied, 2,982 renter occupied)
| % of renters here: | 48% |
| State: | 32% |
Housing density: 504 houses/condos per square mile
Median price asked for vacant for-sale houses and condos in 2022: $108,456.
Median contract rent in 2022: $545 (lower quartile is $375, upper quartile is $758)
Median rent asked for vacant for-rent units in 2022: $576
Median gross rent in Lebanon, MO in 2022: $779
Housing units in Lebanon with a mortgage: 1,971 (97 second mortgage, 0 home equity loan, 60 both second mortgage and home equity loan)
Houses without a mortgage: 17
Median household income for houses/condos with a mortgage: $64,769
Median household income for apartments without a mortgage: $47,559
Median monthly housing costs: $785
Compare current foreclosures in Lebanon, MO:
| Photo | Address | Area | Beds / Baths | Price | Details |
|---|---|---|---|---|---|

|
#1
Sunrise Dr
Lebanon, MO 65536
|
1,282 sq. feet
|
1 baths 2 beds |
show details | |

|
#2
Audrey Ln
Lebanon, MO 65536
|
1,283 sq. feet
|
2 baths 3 beds |
show details | |

|
#3
N Adams Ave
Lebanon, MO 65536
|
- sq. feet
|
1 baths 3 beds |
show details | |

|
#4
Osborn Dr
Lebanon, MO 65536
|
2,283 sq. feet
|
1 baths - beds |
show details | |

|
#5
Highway 64
Lebanon, MO 65536
|
1,062 sq. feet
|
- baths 3 beds |
show details | |

|
#6
Lantern Ln
Lebanon, MO 65536
|
2,449 sq. feet
|
- baths 3 beds |
show details | |

|
#7
Highway Aa
Lebanon, MO 65536
|
1,080 sq. feet
|
- baths 3 beds |
show details | |

|
#8
Indian Creek Dr
Lebanon, MO 65536
|
1,624 sq. feet
|
- baths 3 beds |
show details | |

|
#9
Gulfwind Ln
Lebanon, MO 65536
|
1,338 sq. feet
|
- baths 3 beds |
show details | |

|
#10
Gresham Ln
Lebanon, MO 65536
|
864 sq. feet
|
- baths 2 beds |
show details |
| Photo | Address | Area | Beds / Baths | Price | Details |
|---|---|---|---|---|---|

|
#11
Missouri Dr
Lebanon, MO 65536
|
1,500 sq. feet
|
- baths 3 beds |
show details | |

|
#12
King James Rd
Lebanon, MO 65536
|
1,653 sq. feet
|
- baths 3 beds |
show details | |

|
#13
Maine Dr
Lebanon, MO 65536
|
798 sq. feet
|
- baths 3 beds |
show details | |

|
#14
Herndon Rd
Lebanon, MO 65536
|
- sq. feet
|
- baths - beds |
show details | |

|
#15
Osborn Dr
Lebanon, MO 65536
|
- sq. feet
|
- baths - beds |
show details | |

|
#16
Britney Dr
Lebanon, MO 65536
|
- sq. feet
|
- baths - beds |
show details | |

|
#17
Catalpa Ln
Lebanon, MO 65536
|
- sq. feet
|
- baths - beds |
show details | |

|
#18
Park Dr
Lebanon, MO 65536
|
- sq. feet
|
- baths - beds |
show details | |

|
#19
Harwood Ave
Lebanon, MO 65536
|
- sq. feet
|
- baths - beds |
show details | |

|
#20
Belwood Rd
Lebanon, MO 65536
|
- sq. feet
|
- baths - beds |
show details |
| Photo | Address | Area | Beds / Baths | Price | Details |
|---|---|---|---|---|---|

|
#21
Ostrich Ln
Lebanon, MO 65536
|
- sq. feet
|
- baths - beds |
show details | |

|
#22
Babb Dr
Lebanon, MO 65536
|
- sq. feet
|
- baths - beds |
show details | |

|
#23
Pawnee Dr
Lebanon, MO 65536
|
- sq. feet
|
- baths - beds |
show details | |

|
#24
Highway 64
Lebanon, MO 65536
|
- sq. feet
|
- baths - beds |
show details | |

|
#25
Osgood Dr
Lebanon, MO 65536
|
- sq. feet
|
- baths - beds |
show details | |

|
#26
Oak St
Lebanon, MO 65536
|
- sq. feet
|
- baths - beds |
show details | |

|
#27
Green Hills Rd
Lebanon, MO 65536
|
- sq. feet
|
- baths - beds |
show details | |

|
#28
Millcreek Rd
Lebanon, MO 65536
|
- sq. feet
|
- baths - beds |
show details | |

|
#29
Neosho Dr
Lebanon, MO 65536
|
- sq. feet
|
- baths - beds |
show details | |

|
#30
Chrystle Dr
Lebanon, MO 65536
|
- sq. feet
|
- baths - beds |
show details |
| Photo | Address | Area | Beds / Baths | Price | Details |
|---|---|---|---|---|---|

|
#31
Highway O
Lebanon, MO 65536
|
- sq. feet
|
- baths - beds |
show details | |

|
#32
E Fremont Rd
Lebanon, MO 65536
|
- sq. feet
|
- baths - beds |
show details | |

|
#33
W Elm St
Lebanon, MO 65536
|
- sq. feet
|
- baths - beds |
show details | |

|
#34
Nodaway Dr
Lebanon, MO 65536
|
- sq. feet
|
- baths - beds |
show details | |

|
#35
Hollyhock Ln
Lebanon, MO 65536
|
- sq. feet
|
- baths - beds |
show details | |

|
#36
Equestrian Rd
Lebanon, MO 65536
|
- sq. feet
|
- baths - beds |
show details | |

|
#37
Driftwood Dr
Lebanon, MO 65536
|
- sq. feet
|
- baths - beds |
show details | |

|
Check over 1 million property listings on Foreclosure.com!
|
browse all offers | |||

Latest news about housing in Lebanon, MO collected exclusively by city-data.com from local newspapers, TV, and radio stations

 | Strong possible relocation for homeschool family from Illinois (18 replies) |
| Is the ‘Midwesternness’ of Northern Missouri overstated? (99 replies) |
| Missouri ranked for top 10 most miserable states (48 replies) |
| Life 20 min. South East of Lebanon, MO (2 replies) |
| Parts of Missouri that have an upstate NY feel/vibe? (22 replies) |
| Missouri Outlaw History (3407 replies) |
Median year apartment built: 1982
Household type by relationship:
Households: 15,080- Male householders: 2,607 (698 living alone), Female householders: 3,529 (1,319 living alone)
2,372 spouses (2,358 opposite-sex spouses), 370 unmarried partners, (370 opposite-sex unmarried partners), 4,562 children (4,236 natural, 93 adopted, 232 stepchildren), 362 grandchildren, 96 brothers or sisters, 97 parents, 21 foster children, 143 other relatives, 605 non-relatives
- In group quarters: 312
Size of family households: 1,632 2-persons, 709 3-persons, 791 4-persons, 399 5-persons, 141 6-persons, 67 7-or-more-persons.
Size of nonfamily households: 2,087 1-person, 427 2-persons, 7 3-persons.
1,903 married couples with children.
1,653 single-parent households (606 men, 1,047 women).
96.5% of residents of Lebanon speak English at home.
2.4% of residents speak Spanish at home (67% speak English very well, 3% speak English well, 17% speak English not well, 13% don't speak English at all).
0.5% of residents speak other Indo-European language at home (81% speak English very well, 19% speak English well).
0.5% of residents speak Asian or Pacific Island language at home (66% speak English very well, 15% speak English well, 7% speak English not well, 11% don't speak English at all).
0.1% of residents speak other language at home (100% speak English very well).
Foreign born population: 314 (2.1%)
(37.9% of them are naturalized citizens)
| Here: | 5.9 |
| State: | 6.4 |
| Here: | 4.7 |
| State: | 4.4 |
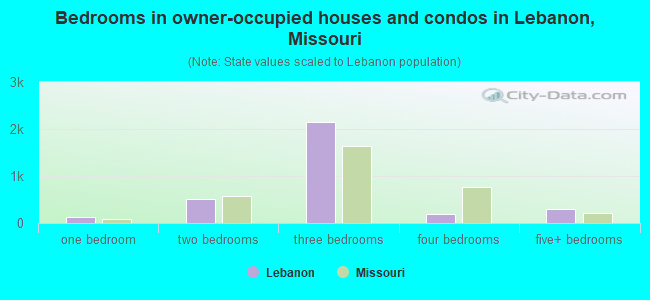
- Bedrooms in owner-occupied houses and condos in Lebanon, Missouri
- 0no bedroom
- 1251 bedroom
- 5072 bedrooms
- 2,1533 bedrooms
- 2014 bedrooms
- 3045+ bedrooms
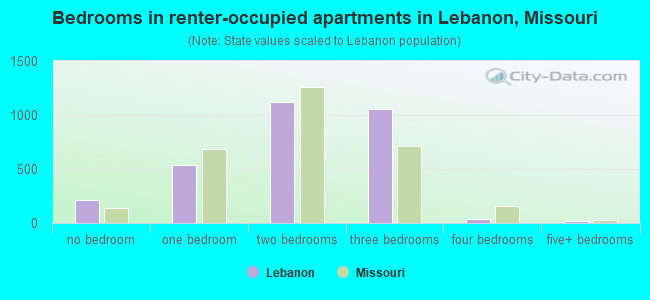
- Bedrooms in renter-occupied apartments in Lebanon, Missouri
- 215no bedroom
- 5391 bedroom
- 1,1232 bedrooms
- 1,0513 bedrooms
- 374 bedrooms
- 165+ bedrooms
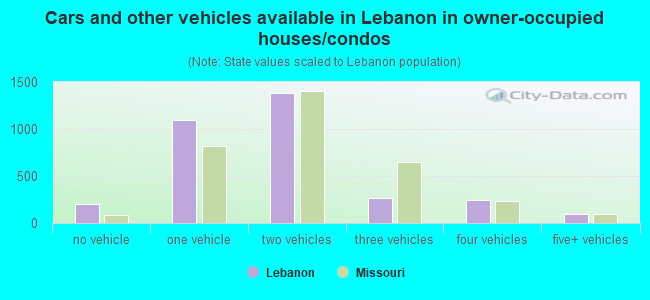
- Cars and other vehicles available in Lebanon in owner-occupied houses/condos
- 199no vehicle
- 1,0981 vehicle
- 1,3852 vehicles
- 2623 vehicles
- 2474 vehicles
- 1005+ vehicles
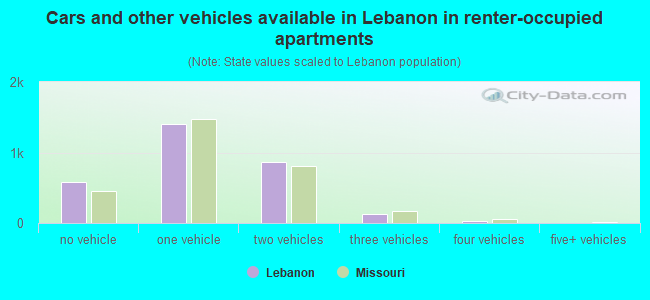
- Cars and other vehicles available in Lebanon in renter-occupied apartments
- 575no vehicle
- 1,3991 vehicle
- 8622 vehicles
- 1233 vehicles
- 234 vehicles
- 05+ vehicles
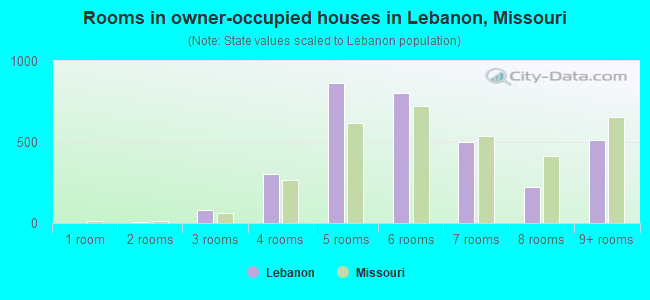
- Rooms in owner-occupied houses in Lebanon, Missouri
- 01 room
- 52 rooms
- 793 rooms
- 3004 rooms
- 8665 rooms
- 8046 rooms
- 5017 rooms
- 2238 rooms
- 5139+ rooms
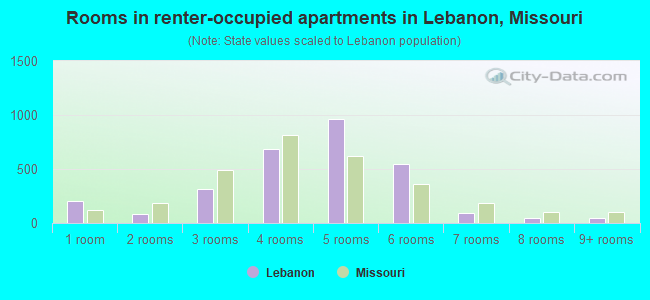
- Rooms in renter-occupied apartments in Lebanon, Missouri
- 2001 room
- 862 rooms
- 3113 rooms
- 6894 rooms
- 9665 rooms
- 5436 rooms
- 967 rooms
- 438 rooms
- 479+ rooms
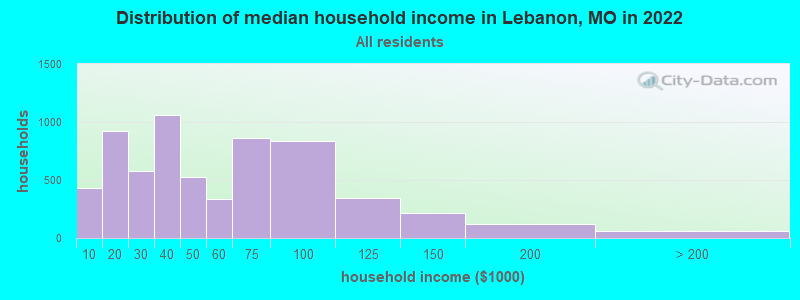
Lebanon, MO household income distribution

- 427Less than $10,000
- 924$10,000 to $19,999
- 579$20,000 to $29,999
- 1,063$30,000 to $39,999
- 530$40,000 to $49,999
- 338$50,000 to $59,999
- 859$60,000 to $74,999
- 836$75,000 to $99,999
- 341$100,000 to $124,999
- 218$125,000 to $149,999
- 125$150,000 to $199,999
- 64$200,000 or more
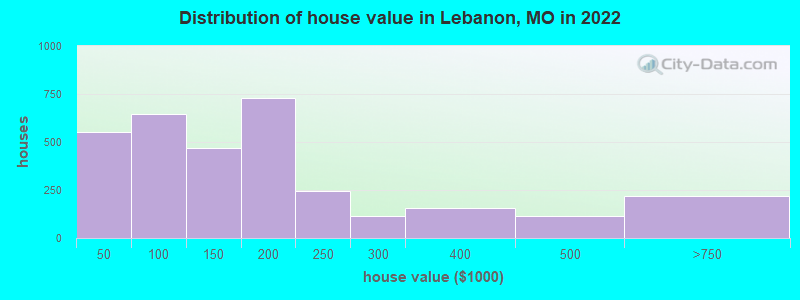
Home value of owner - occupied houses in 2022 in Lebanon, MO
-
- 182Less than $10,000
- 15$10,000 to $14,999
- 68$15,000 to $19,999
- 72$20,000 to $24,999
- 42$25,000 to $29,999
- 76$30,000 to $34,999
- 9$35,000 to $39,999
- 86$40,000 to $49,999
- 58$50,000 to $59,999
- 81$60,000 to $69,999
- 174$70,000 to $79,999
- 157$80,000 to $89,999
- 88$90,000 to $99,999
- 255$100,000 to $124,999
- 216$125,000 to $149,999
- 530$150,000 to $174,999
- 198$175,000 to $199,999
- 243$200,000 to $249,999
- 115$250,000 to $299,999
- 154$300,000 to $399,999
- 111$400,000 to $499,999
- 219$500,000 to $749,999
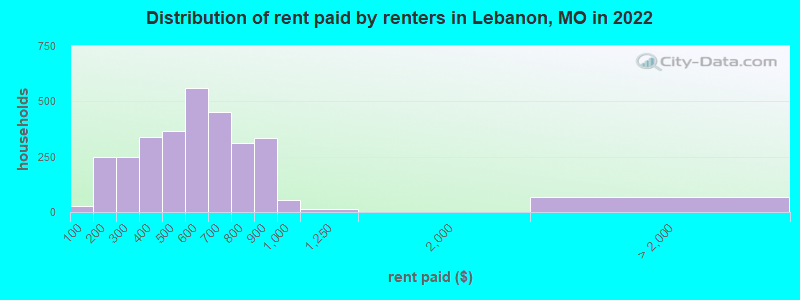
Rent paid by renters in 2022 in Lebanon, MO
-
- 24Less than $100
- 71$100 to $149
- 176$150 to $199
- 235$200 to $249
- 11$250 to $299
- 191$300 to $349
- 146$350 to $399
- 212$400 to $449
- 153$450 to $499
- 415$500 to $549
- 142$550 to $599
- 197$600 to $649
- 252$650 to $699
- 112$700 to $749
- 198$750 to $799
- 333$800 to $899
- 52$900 to $999
- 12$1,000 to $1,249
- 16$2,500 to $2,999
- 51No cash rent
Percentage of workers working in this county: 88.1%
Number of people working at home: 268 (3.9% of all workers)
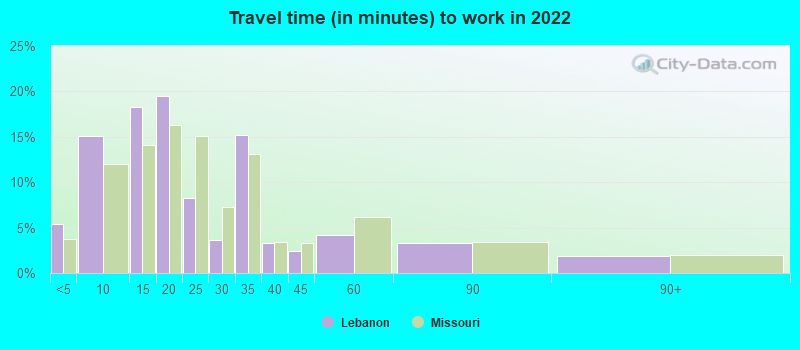
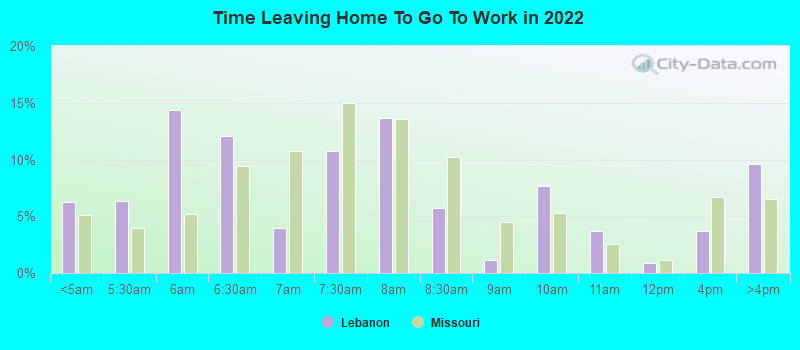
Travel time to work (commute)
- Less than 5 minutes: 603
- 5 to 9 minutes: 1,618
- 10 to 14 minutes: 1,760
- 15 to 19 minutes: 1,235
- 20 to 24 minutes: 116
- 25 to 29 minutes: 127
- 30 to 34 minutes: 367
- 35 to 39 minutes: 121
- 40 to 44 minutes: 102
- 45 to 59 minutes: 278
- 60 to 89 minutes: 41
- 90 or more minutes: 122
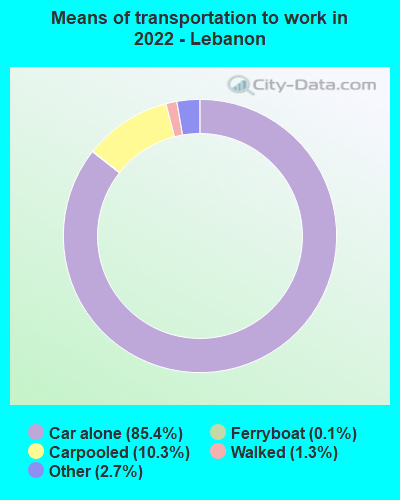
Means of transportation to work:
- Drove a car alone: 10,706 (81.4%)
- Carpooled: 1,313 (10.0%)
- Bus: 6 (0.0%)
- Ferryboat: 20 (0.2%)
- Taxi: 350 (2.7%)
- Walked: 159 (1.2%)
- Worked at home: 268 (2.0%)
- Unemployment by race in 2022
- Unemployment rate for White non-Hispanic residents
- 6.6%Males
- 6.3%Females
- Unemployment rate for other race residents
- 84.8%Females
- Unemployment rate for two or more race residents
- 19.1%Males
- 16.6%Females
- Unemployment rate for Hispanic or Latino residents
- 13.7%Males
- 51.8%Females
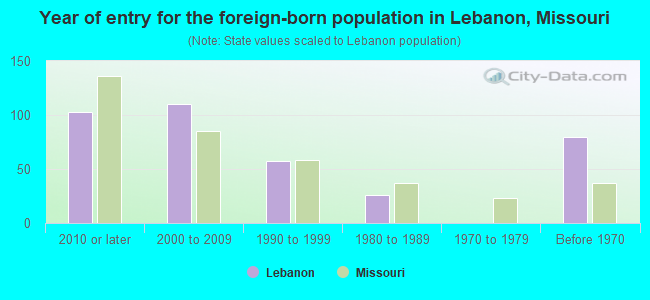
- Year of entry for the foreign-born population in Lebanon, Missouri
- 1032010 or later
- 1102000 to 2009
- 571990 to 1999
- 261980 to 1989
- 01970 to 1979
- 80Before 1970
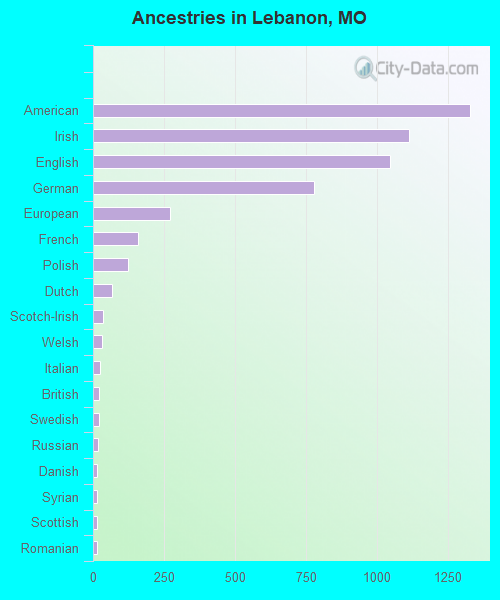
First ancestries reported:
- American: 1,329 (20.5%)
- Irish: 1,112 (17.2%)
- English: 1,048 (16.2%)
- German: 779 (12.0%)
- European: 270 (4.2%)
- French: 159 (2.5%)
- Polish: 123 (1.9%)
- Dutch: 68 (1.0%)
- Scotch-Irish: 34 (0.5%)
- Welsh: 32 (0.5%)
- Italian: 24 (0.4%)
- British: 22 (0.3%)
- Swedish: 22 (0.3%)
- Russian: 18 (0.3%)
- Danish: 15 (0.2%)
- Syrian: 14 (0.2%)
- Scottish: 14 (0.2%)
- Romanian: 13 (0.2%)
- Norwegian: 12 (0.2%)
- Eastern European: 11 (0.2%)
- Cajun: 8 (0.1%)
- Pennsylvania German: 8 (0.1%)
- Greek: 6 (0.09%)
- Finnish: 5 (0.08%)
Most common places of birth for foreign-born residents (%):
| Lebanon: | 43.3% (136) |
| Missouri: | 14.9% (38,568) |
| Lebanon: | 21.3% (67) |
| Missouri: | 0.6% (1,481) |
| Lebanon: | 10.8% (34) |
| Missouri: | 4.2% (10,873) |
| Lebanon: | 7.6% (24) |
| Missouri: | 0.3% (764) |
| Lebanon: | 6.7% (21) |
| Missouri: | 1.0% (2,597) |
| Lebanon: | 6.4% (20) |
| Missouri: | 1.1% (2,796) |
| Lebanon: | 5.4% (17) |
| Missouri: | 3.0% (7,803) |
| Lebanon: | 4.1% (13) |
| Missouri: | 6.6% (17,002) |
| Lebanon: | 3.2% (10) |
| Missouri: | 1.5% (3,767) |
Place of birth for U.S.-born residents:
- This state: 10,005
- Other state: 4,636
- Northeast: 144
- Midwest: 2,129
- South: 1,242
- West: 1,131
82.3% of Lebanon residents lived in the same house 1 years ago.
Out of people who lived in different houses, 39.0% lived in this county.
Out of people who lived in different counties, 81.2% lived in Missouri.
| Lebanon: | 82.3% |
| State average: | 87.1% |
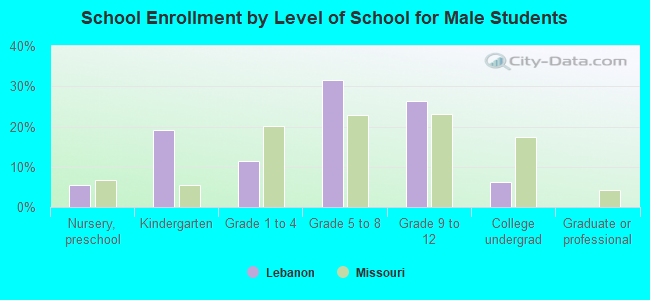
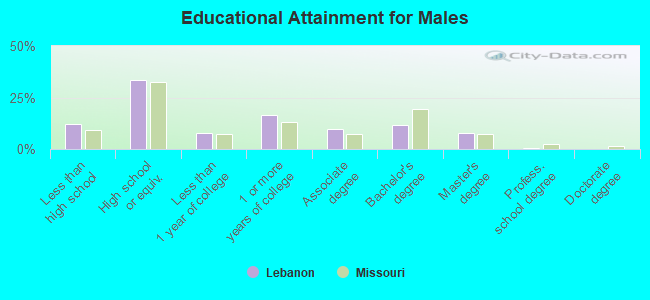
Education attainment for males 25 years and older:
- No schooling: 37
- Nursery to 4th grade: 0
- 5th and 6th grade: 63
- 7th and 8th grade: 73
- 9th grade: 28
- 10th grade: 139
- 11th grade: 176
- 12th grade, no diploma: 41
- High school graduate (or equivalency): 1,560
- Less than 1 year of college: 368
- Some college more than 1 year, no degree: 765
- Associate degree: 458
- Bachelor's degree: 544
- Master's degree: 367
- Professional school degree: 15
- Doctorate degree: 11
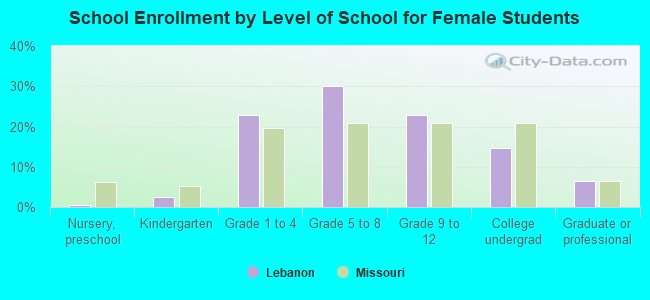
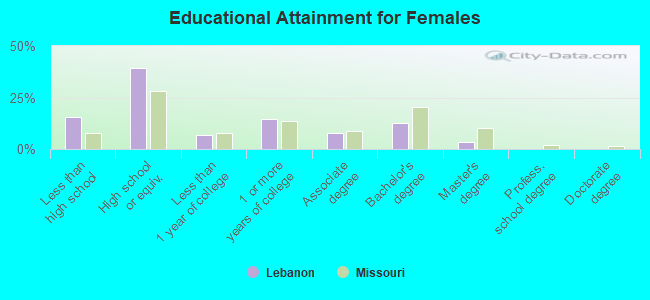
Education attainment for females 25 years and older:
- No schooling: 70
- Nursery to 4th grade: 0
- 5th and 6th grade: 35
- 7th and 8th grade: 69
- 9th grade: 107
- 10th grade: 72
- 11th grade: 210
- 12th grade, no diploma: 228
- High school graduate (or equivalency): 2,020
- Less than 1 year of college: 359
- Some college more than 1 year, no degree: 734
- Associate degree: 392
- Bachelor's degree: 658
- Master's degree: 169
- Professional school degree: 0
- Doctorate degree: 0
Housing units in structures:
- One, detached: 4,518
- One, attached: 515
- Two: 455
- 3 or 4: 340
- 5 to 9: 144
- 10 to 19: 202
- 20 to 49: 209
- 50 or more: 169
- Mobile homes: 308
Median worth of mobile homes: $10,746
Housing units lacking complete kitchen facilities in 2022: 3.6%
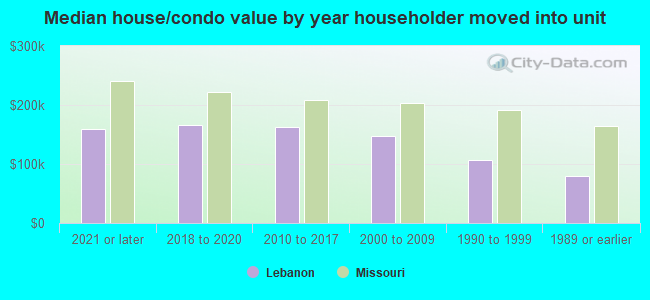
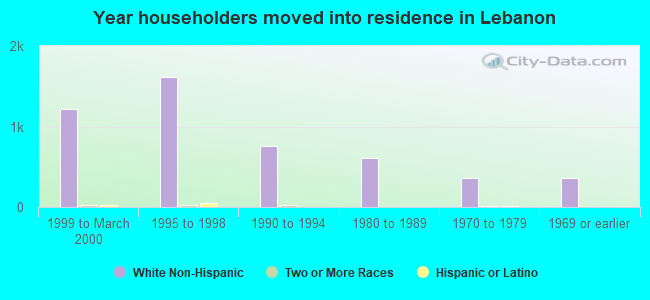
House/condo owner moved in on average 8 years ago
Renter moved in on average 4 years ago
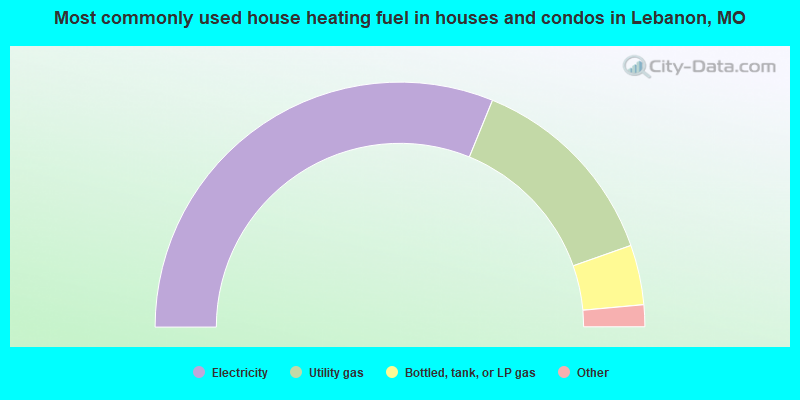
- 62.4%Electricity
- 26.9%Utility gas
- 7.9%Bottled, tank, or LP gas
- 0.9%Wood
- 0.8%Fuel oil, kerosene, etc.
- 0.8%No fuel used
- 0.3%Other fuel
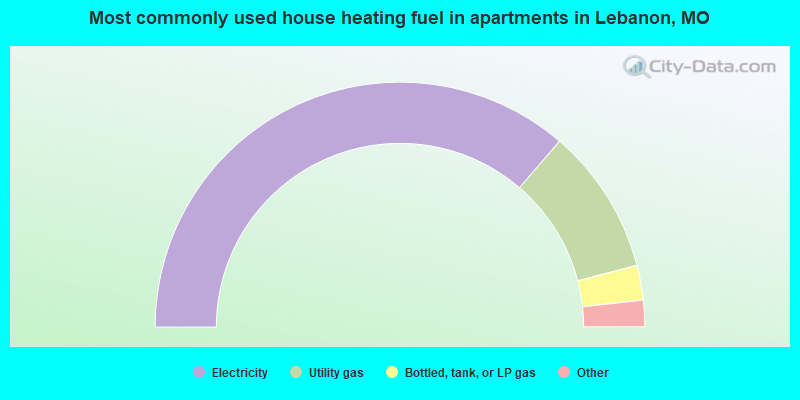
- 72.6%Electricity
- 19.3%Utility gas
- 4.6%Bottled, tank, or LP gas
- 2.5%Fuel oil, kerosene, etc.
- 0.9%No fuel used
Private vs. public school enrollment:
| Here: | 5.8% |
| Missouri: | 15.4% |
| Here: | 6.1% |
| Missouri: | 13.9% |
| Here: | 8.9% |
| Missouri: | 22.6% |