Lebanon, VA (Virginia) Houses and Residents
| Lebanon: | $163,586 |
| Virginia: | $365,700 |
Mean price in 2022:
Detached houses: $248,954
Here: $248,954 State: $472,865 Townhouses or other attached units: $295,694
Here: $295,694 State: $457,437 Mobile homes: $36,595
Here: $36,595 State: $100,736
Total population: 3,356 (Urban population: 2,966 (all inside urban clusters), Rural population: 298 (all nonfarm))
Houses: 1,647 (1,297 occupied: 868 owner occupied, 442 renter occupied)
| % of renters here: | 34% |
| State: | 33% |
Housing density: 401 houses/condos per square mile
Median price asked for vacant for-sale houses and condos in 2022 in this county: $110,978.
Median contract rent in 2022: $502 (lower quartile is $423, upper quartile is $630)
Median rent asked for vacant for-rent units in 2022: $545
Median gross rent in Lebanon, VA in 2022: $710
Housing units in Lebanon with a mortgage: 323 (0 second mortgage, 0 home equity loan, 0 both second mortgage and home equity loan)
Houses without a mortgage: 0
Median household income for houses/condos with a mortgage: $62,415
Median household income for apartments without a mortgage: $52,082
Median monthly housing costs: $555
Compare current foreclosures near Lebanon, VA:
| Photo | Address | Area | Beds / Baths | Price | Details |
|---|---|---|---|---|---|

|
#1
Green Valley Rd
Lebanon, VA 24266
|
1,232 sq. feet
|
1 baths 3 beds |
show details | |

|
#2
Poplar Ave
Lebanon, VA 24266
|
- sq. feet
|
- baths - beds |
show details | |

|
#3
Windy Hill Cir
Lebanon, VA 24266
|
- sq. feet
|
- baths - beds |
show details | |

|
#4
E Cross Roads Dr
Lebanon, VA 24266
|
- sq. feet
|
- baths - beds |
show details | |

|
#5
Tumbez Hollow Rd
Lebanon, VA 24266
|
- sq. feet
|
- baths - beds |
show details | |

|
#6
Swords Creek Rd
Honaker, VA 24260
|
1,976 sq. feet
|
1 baths 3 beds |
show details | |

|
#7
Ridge St
Castlewood, VA 24224
|
- sq. feet
|
2 baths 3 beds |
show details | |

|
#8
Providence Rd
Abingdon, VA 24210
|
1,636 sq. feet
|
1 baths 3 beds |
show details | |

|
#9
Hillman Hwy
Meadowview, VA 24361
|
2,896 sq. feet
|
2 baths 4 beds |
show details | |

|
#10
Lowry Dr SW
Abingdon, VA 24210
|
1,157 sq. feet
|
1 baths 2 beds |
show details |
| Photo | Address | Area | Beds / Baths | Price | Details |
|---|---|---|---|---|---|

|
#11
Robindale Rd
Meadowview, VA 24361
|
2,128 sq. feet
|
2 baths 3 beds |
show details | |

|
#12
Jefferson Cir Apt 18
Abingdon, VA 24210
|
1,102 sq. feet
|
2 baths 2 beds |
show details | |

|
#13
Old Timber Rd
Abingdon, VA 24210
|
2,565 sq. feet
|
2 baths 3 beds |
show details | |

|
#14
Greenhill Dr NE
Abingdon, VA 24210
|
1,404 sq. feet
|
2 baths 3 beds |
show details | |

|
#15
Copper Ridge Rd
Castlewood, VA 24224
|
1,200 sq. feet
|
1 baths 2 beds |
show details | |

|
#16
S 71
Castlewood, VA 24224
|
1,588 sq. feet
|
1 baths 3 beds |
show details | |

|
#17
John Simms Hill Rd
Honaker, VA 24260
|
1,200 sq. feet
|
1 baths 2 beds |
show details | |

|
#18
Beech Cir
Abingdon, VA 24211
|
1,466 sq. feet
|
2 baths 3 beds |
show details | |

|
#19
Reynolds Ln
Honaker, VA 24260
|
- sq. feet
|
- baths - beds |
show details | |

|
#20
Beths Ln
Cedar Bluff, VA 24609
|
- sq. feet
|
- baths - beds |
show details |
| Photo | Address | Area | Beds / Baths | Price | Details |
|---|---|---|---|---|---|

|
#21
Tiny Holw
Birchleaf, VA 24220
|
- sq. feet
|
- baths - beds |
show details | |

|
#22
Matthew Dr
Abingdon, VA 24211
|
- sq. feet
|
- baths - beds |
show details | |

|
#23
Wyndale Rd
Abingdon, VA 24210
|
- sq. feet
|
- baths - beds |
show details | |

|
#24
Stinson Ridge Rd
Rowe, VA 24646
|
- sq. feet
|
- baths - beds |
show details | |

|
#25
Wyndale Rd
Abingdon, VA 24210
|
- sq. feet
|
- baths - beds |
show details | |

|
#26
Lauren Dr Apt 3
Abingdon, VA 24210
|
- sq. feet
|
- baths - beds |
show details | |

|
#27
Hallock Pl Apt 16
Abingdon, VA 24210
|
- sq. feet
|
- baths - beds |
show details | |

|
#28
Hallock Dr
Abingdon, VA 24210
|
- sq. feet
|
- baths - beds |
show details | |

|
#29
Roanoke Cir
Dante, VA 24237
|
- sq. feet
|
- baths - beds |
show details | |

|
#30
Riverben 7336
Saltville, VA 24370
|
- sq. feet
|
- baths - beds |
show details |
| Photo | Address | Area | Beds / Baths | Price | Details |
|---|---|---|---|---|---|

|
#31
Yellow Springs Rd
Meadowview, VA 24361
|
- sq. feet
|
- baths - beds |
show details | |

|
#32
Norfolk St # 20
Abingdon, VA 24210
|
- sq. feet
|
- baths - beds |
show details | |

|
#33
Colonial Rd SW
Abingdon, VA 24210
|
- sq. feet
|
- baths - beds |
show details | |

|
#34
Train Track Rd
Cleveland, VA 24225
|
- sq. feet
|
- baths - beds |
show details | |

|
#35
Mendota Rd
Abingdon, VA 24210
|
- sq. feet
|
- baths - beds |
show details | |

|
#36
Senior Dr NE
Abingdon, VA 24210
|
14,700 sq. feet
|
- baths - beds |
show details | |

|
#37
Wyndale Rd
Abingdon, VA 24210
|
- sq. feet
|
- baths - beds |
show details | |

|
#38
Reeds Valley Rd
Castlewood, VA 24224
|
- sq. feet
|
- baths - beds |
show details | |

|
#39
Miller Ln
Swords Creek, VA 24649
|
- sq. feet
|
- baths - beds |
show details | |

|
#40
Middle Ave
Cleveland, VA 24225
|
- sq. feet
|
- baths - beds |
show details |
| Photo | Address | Area | Beds / Baths | Price | Details |
|---|---|---|---|---|---|

|
Check over 1 million property listings on Foreclosure.com!
|
browse all offers | |||
| Photo | Address | Area | Beds / Baths | Price | Details |
|---|

Latest news about housing in Lebanon, VA collected exclusively by city-data.com from local newspapers, TV, and radio stations

 | Gov. Northam issues stay-at-home order (108 replies) |
| What are some good, cheap towns in northern VA? (31 replies) |
| Questions about Abingdon, VA (63 replies) |
| Vibrant Small Towns - VA (33 replies) |
| Looking for a place to land (10 replies) |
| Details about SWVA for relocation? (18 replies) |

Median year apartment built: 1987
Household type by relationship:
Households: 3,160- Male householders: 457 (100 living alone), Female householders: 827 (317 living alone)
325 spouses (325 opposite-sex spouses), 126 unmarried partners, (126 opposite-sex unmarried partners), 917 children (907 natural, 10 adopted, 0 stepchildren), 14 grandchildren, 130 brothers or sisters, 65 parents, 0 foster children, 0 other relatives, 155 non-relatives
- In group quarters: 140
Size of family households: 496 2-persons, 123 3-persons, 54 4-persons, 88 5-persons, 28 6-persons.
Size of nonfamily households: 429 1-person, 95 2-persons.
176 married couples with children.
326 single-parent households (93 men, 233 women).
98.6% of residents of Lebanon speak English at home.
1.4% of residents speak other Indo-European language at home (91% speak English very well, 9% speak English well).
0.3% of residents speak Asian or Pacific Island language at home (100% speak English very well).
Foreign born population: 13 (0.4%)
(76.9% of them are naturalized citizens)
| Here: | 6.9 |
| State: | 7.0 |
| Here: | 4.3 |
| State: | 4.3 |

- Bedrooms in owner-occupied houses and condos in Lebanon, Virginia
- 7no bedroom
- 01 bedroom
- 1132 bedrooms
- 4713 bedrooms
- 2334 bedrooms
- 445+ bedrooms

- Bedrooms in renter-occupied apartments in Lebanon, Virginia
- 0no bedroom
- 831 bedroom
- 2162 bedrooms
- 1183 bedrooms
- 264 bedrooms
- 05+ bedrooms

- Cars and other vehicles available in Lebanon in owner-occupied houses/condos
- 70no vehicle
- 3431 vehicle
- 3332 vehicles
- 873 vehicles
- 354 vehicles
- 05+ vehicles

- Cars and other vehicles available in Lebanon in renter-occupied apartments
- 71no vehicle
- 1491 vehicle
- 2232 vehicles
- 03 vehicles
- 04 vehicles
- 05+ vehicles

- Rooms in owner-occupied houses in Lebanon, Virginia
- 71 room
- 02 rooms
- 523 rooms
- 704 rooms
- 1275 rooms
- 1366 rooms
- 1107 rooms
- 1768 rooms
- 1909+ rooms

- Rooms in renter-occupied apartments in Lebanon, Virginia
- 01 room
- 152 rooms
- 683 rooms
- 1564 rooms
- 855 rooms
- 396 rooms
- 797 rooms
- 08 rooms
- 09+ rooms


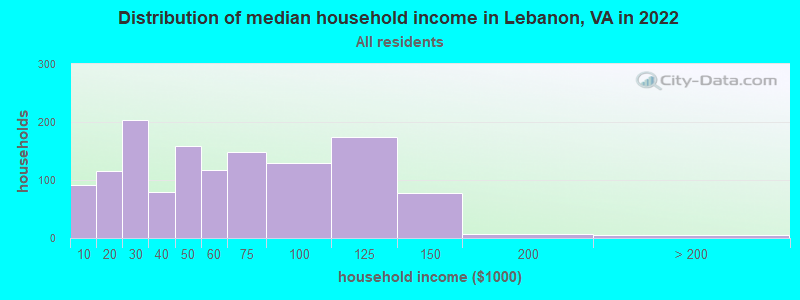
Lebanon, VA household income distribution

- 91Less than $10,000
- 115$10,000 to $19,999
- 204$20,000 to $29,999
- 80$30,000 to $39,999
- 159$40,000 to $49,999
- 118$50,000 to $59,999
- 148$60,000 to $74,999
- 130$75,000 to $99,999
- 174$100,000 to $124,999
- 77$125,000 to $149,999
- 7$150,000 to $199,999
- 5$200,000 or more
Home value of owner - occupied houses in 2022 in Lebanon, VA
-
- 50$10,000 to $14,999
- 11$35,000 to $39,999
- 50$50,000 to $59,999
- 34$60,000 to $69,999
- 133$80,000 to $89,999
- 35$90,000 to $99,999
- 60$100,000 to $124,999
- 3$125,000 to $149,999
- 166$150,000 to $174,999
- 62$175,000 to $199,999
- 123$200,000 to $249,999
- 10$250,000 to $299,999
- 14$300,000 to $399,999
- 23$750,000 to $999,999

Rent paid by renters in 2022 in Lebanon, VA
-
- 45Less than $100
- 24$200 to $249
- 12$350 to $399
- 46$400 to $449
- 78$450 to $499
- 10$550 to $599
- 150$600 to $649
- 8$750 to $799
- 28$900 to $999
- 37No cash rent


Percentage of workers working in this county: 67.2%
Number of people working at home: 160 (13.1% of all workers)
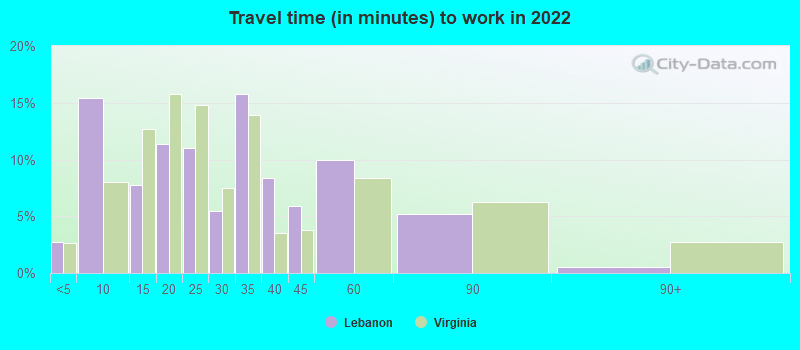
Travel time to work (commute)
- Less than 5 minutes: 49
- 5 to 9 minutes: 404
- 10 to 14 minutes: 56
- 15 to 19 minutes: 87
- 20 to 24 minutes: 20
- 25 to 29 minutes: 23
- 30 to 34 minutes: 163
- 35 to 39 minutes: 0
- 40 to 44 minutes: 0
- 45 to 59 minutes: 106
- 60 to 89 minutes: 118
- 90 or more minutes: 0
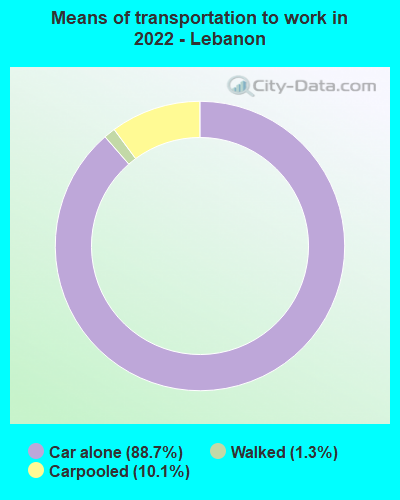
Means of transportation to work:
- Drove a car alone: 3,148 (81.7%)
- Carpooled: 363 (9.4%)
- Walked: 48 (1.2%)
- Worked at home: 160 (4.2%)


- Year of entry for the foreign-born population in Lebanon, Virginia
- 32010 or later
- 02000 to 2009
- 101990 to 1999
- 161980 to 1989
- 01970 to 1979
- 9Before 1970

First ancestries reported:
- American: 1,205 (62.0%)
- English: 463 (23.8%)
- Irish: 164 (8.4%)
- German: 67 (3.4%)
- British: 12 (0.6%)
- African: 11 (0.6%)
Most common places of birth for foreign-born residents (%):
| Lebanon: | 76.9% (10) |
| Virginia: | 9.0% (97,830) |
| Lebanon: | 30.8% (4) |
| Virginia: | 0.1% (843) |
Place of birth for U.S.-born residents:
- This state: 2,457
- Other state: 666
- Northeast: 144
- Midwest: 39
- South: 473
- West: 6
87.7% of Lebanon residents lived in the same house 1 years ago.
Out of people who lived in different houses, 40.5% lived in this county.
Out of people who lived in different counties, 34.0% lived in Virginia.
| Lebanon: | 87.7% |
| State average: | 86.6% |
Education attainment for males 25 years and older:
- No schooling: 15
- Nursery to 4th grade: 49
- 5th and 6th grade: 7
- 7th and 8th grade: 38
- 9th grade: 12
- 10th grade: 17
- 11th grade: 10
- 12th grade, no diploma: 0
- High school graduate (or equivalency): 524
- Less than 1 year of college: 51
- Some college more than 1 year, no degree: 81
- Associate degree: 40
- Bachelor's degree: 9
- Master's degree: 44
- Professional school degree: 0
- Doctorate degree: 0

Education attainment for females 25 years and older:
- No schooling: 0
- Nursery to 4th grade: 0
- 5th and 6th grade: 56
- 7th and 8th grade: 76
- 9th grade: 0
- 10th grade: 10
- 11th grade: 52
- 12th grade, no diploma: 0
- High school graduate (or equivalency): 674
- Less than 1 year of college: 70
- Some college more than 1 year, no degree: 89
- Associate degree: 214
- Bachelor's degree: 101
- Master's degree: 60
- Professional school degree: 0
- Doctorate degree: 69


Housing units in structures:
- One, detached: 1,079
- One, attached: 60
- Two: 15
- 3 or 4: 140
- 5 to 9: 200
- 10 to 19: 15
- 20 to 49: 45
- Mobile homes: 90
Housing units lacking complete kitchen facilities in 2022: 7.6%
House/condo owner moved in on average 16 years ago
Renter moved in on average 1 years ago

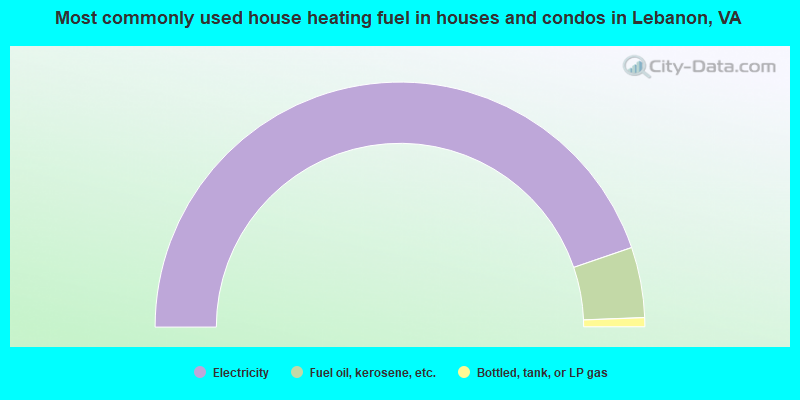
- 89.5%Electricity
- 9.3%Fuel oil, kerosene, etc.
- 1.2%Bottled, tank, or LP gas
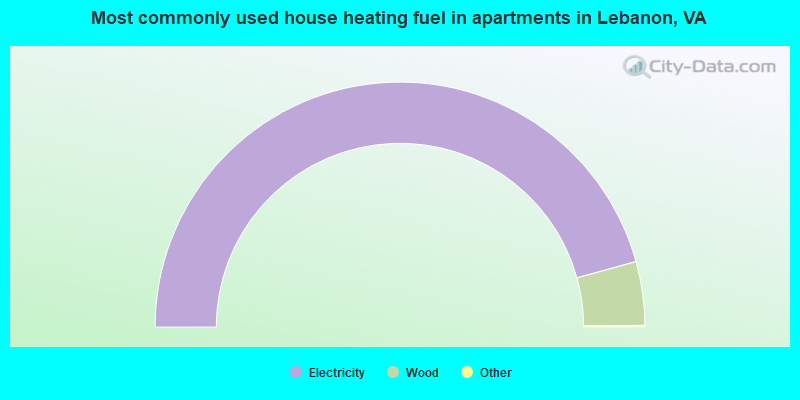
- 91.6%Electricity
- 8.4%Wood
Private vs. public school enrollment:
| Here: | 36.2% |
| Virginia: | 13.2% |
| Here: | 40.6% |
| Virginia: | 10.2% |
| Here: | 0.0% |
| Virginia: | 18.7% |


