Ledyard, CT (Connecticut) Houses and Residents
| Ledyard: | $309,583 |
| Connecticut: | $347,200 |
Total population: 15,051 (Urban population: 8,411, Rural population: 6,271 (27 farm, 6,244 nonfarm))
Houses: 5,483 (5,283 occupied: 4,356 owner occupied, 927 renter occupied)
| % of renters here: | 18% |
| State: | 34% |
Housing density: 144 houses/condos per square mile
Median price asked for vacant for-sale houses and condos in 2022 in this county: $309,766.
Median contract rent in 2022: $1,343 (lower quartile is $1,192, upper quartile is $1,997)
Median rent asked for vacant for-rent units in 2022: $1,250
Median gross rent in Ledyard, CT in 2022: $1,575
Housing units in Ledyard with a mortgage: 2,960 (404 second mortgage, 338 home equity loan, 7 both second mortgage and home equity loan)
Houses without a mortgage: 941
Compare current foreclosures near Ledyard, CT:
| Photo | Address | Area | Beds / Baths | Price | Details |
|---|---|---|---|---|---|

|
#1
Sachem Ln
Ledyard, CT 06339
|
1,200 sq. feet
|
1 baths 3 beds |
show details | |

|
#2
Blacksmith Dr
Ledyard, CT 06339
|
1,196 sq. feet
|
2 baths 4 beds |
show details | |

|
#3
Lake Dr E
Oakdale, CT 06370
|
1,346 sq. feet
|
1 baths 3 beds |
$349,900
|
show details |

|
#4
Rope Ferry Rd Unit N161
Waterford, CT 06385
|
576 sq. feet
|
1 baths 1 beds |
show details | |

|
#5
Boswell Ave
Norwich, CT 06360
|
2,244 sq. feet
|
4 baths 4 beds |
show details | |

|
#6
Liberty St
Pawcatuck, CT 06379
|
1,880 sq. feet
|
2 baths 4 beds |
show details | |

|
#7
Broad St
Norwich, CT 06360
|
1,703 sq. feet
|
1 baths 4 beds |
show details | |

|
#8
Hammond Ct
Colchester, CT 06415
|
1,152 sq. feet
|
1 baths 3 beds |
show details | |

|
#9
Cow Hill Rd
Mystic, CT 06355
|
1,614 sq. feet
|
2 baths 3 beds |
show details | |

|
#10
Vergennes Ct
Groton, CT 06340
|
- sq. feet
|
1 baths 4 beds |
show details |
| Photo | Address | Area | Beds / Baths | Price | Details |
|---|---|---|---|---|---|

|
#11
Candlewood Rd
Groton, CT 06340
|
2,064 sq. feet
|
1 baths 3 beds |
show details | |

|
#12
New London Rd
Colchester, CT 06415
|
1,938 sq. feet
|
3 baths 3 beds |
show details | |

|
#13
Crestwood Dr
Hope Valley, RI 02832
|
1,320 sq. feet
|
2 baths 3 beds |
show details | |

|
#14
Vauxhall St
New London, CT 06320
|
930 sq. feet
|
1 baths 3 beds |
show details | |

|
#15
Norwich Rd
Plainfield, CT 06374
|
1,519 sq. feet
|
2 baths 3 beds |
show details | |

|
#16
School St
New London, CT 06320
|
1,664 sq. feet
|
2 baths 2 beds |
show details | |

|
#17
Griswold Dr
Jewett City, CT 06351
|
1,536 sq. feet
|
2 baths 2 beds |
show details | |

|
#18
Lincoln Rd
Waterford, CT 06385
|
1,132 sq. feet
|
1 baths 3 beds |
show details | |

|
#19
Ocean Ave
New London, CT 06320
|
990 sq. feet
|
1 baths 2 beds |
show details | |

|
#20
Lloyd Rd
Waterford, CT 06385
|
2,208 sq. feet
|
2 baths 5 beds |
show details |
| Photo | Address | Area | Beds / Baths | Price | Details |
|---|---|---|---|---|---|

|
#21
Willetts Ave # 1
New London, CT 06320
|
3,571 sq. feet
|
3 baths 5 beds |
show details | |

|
#22
Lake Dr E
Oakdale, CT 06370
|
1,371 sq. feet
|
2 baths 3 beds |
show details | |

|
#23
Sholes Ave
Norwich, CT 06360
|
1,362 sq. feet
|
1 baths 3 beds |
show details | |

|
#24
Alger Pl
New London, CT 06320
|
2,392 sq. feet
|
3 baths 4 beds |
show details | |

|
#25
Reutemann Rd
North Stonington, CT 06359
|
1,296 sq. feet
|
1 baths 3 beds |
show details | |

|
#26
Ohio Dr
Oakdale, CT 06370
|
984 sq. feet
|
1 baths 3 beds |
show details | |

|
#27
Beechwood Rd
Oakdale, CT 06370
|
1,008 sq. feet
|
1 baths 3 beds |
show details | |

|
#28
Chesterfield Rd
East Lyme, CT 06333
|
1,548 sq. feet
|
2 baths 3 beds |
show details | |

|
#29
S 4th Ave
Taftville, CT 06380
|
1,314 sq. feet
|
1 baths 3 beds |
show details | |

|
#30
Merchants Ave
Taftville, CT 06380
|
1,087 sq. feet
|
1 baths 3 beds |
show details |
| Photo | Address | Area | Beds / Baths | Price | Details |
|---|---|---|---|---|---|

|
#31
Latimer Dr
East Lyme, CT 06333
|
1,372 sq. feet
|
1 baths 3 beds |
show details | |

|
#32
Andrews St
Pawcatuck, CT 06379
|
790 sq. feet
|
1 baths 2 beds |
show details | |

|
#33
1st Ave
Waterford, CT 06385
|
1,547 sq. feet
|
1 baths 4 beds |
show details | |

|
#34
Campbell Dr
Canterbury, CT 06331
|
1,132 sq. feet
|
1 baths 3 beds |
show details | |

|
#35
Blue Ridge Dr
Charlestown, RI 02813
|
2,338 sq. feet
|
2 baths 3 beds |
show details | |

|
#36
Ross Hill Rd
Charlestown, RI 02813
|
2,100 sq. feet
|
2 baths 3 beds |
show details | |

|
#37
Fenner Hill Rd
Hope Valley, RI 02832
|
1,092 sq. feet
|
1 baths 3 beds |
show details | |

|
#38
Norwich Rd
Plainfield, CT 06374
|
2,161 sq. feet
|
1 baths 3 beds |
show details | |

|
#39
Parum Rd # 3-05
Colchester, CT 06415
|
1,503 sq. feet
|
1 baths 3 beds |
show details | |

|
#40
Oak St
Old Lyme, CT 06371
|
1,416 sq. feet
|
2 baths 3 beds |
show details |
| Photo | Address | Area | Beds / Baths | Price | Details |
|---|---|---|---|---|---|

|
#41
Norwich Rd
Plainfield, CT 06374
|
1,278 sq. feet
|
1 baths 3 beds |
show details | |

|
#42
Robinson Hill Rd
North Franklin, CT 06254
|
739 sq. feet
|
1 baths 2 beds |
show details | |

|
#43
Banjo Sullivan Rd
Jewett City, CT 06351
|
1,564 sq. feet
|
2 baths 4 beds |
show details | |

|
#44
Oakwood Rd
Niantic, CT 06357
|
1,104 sq. feet
|
1 baths 3 beds |
show details | |

|
#45
Potash Hill Rd
Baltic, CT 06330
|
1,028 sq. feet
|
1 baths 3 beds |
show details | |

|
#46
Canal St
Westerly, RI 02891
|
878 sq. feet
|
1 baths 2 beds |
show details | |

|
#47
Roode Rd
Jewett City, CT 06351
|
1,104 sq. feet
|
1 baths 3 beds |
show details | |

|
#48
Chickadee Ln
Westerly, RI 02891
|
1,915 sq. feet
|
2 baths 3 beds |
show details | |

|
#49
Pachaug River Dr
Jewett City, CT 06351
|
1,428 sq. feet
|
2 baths 3 beds |
show details | |

|
Check over 1 million property listings on Foreclosure.com!
|
browse all offers | |||

Household type by relationship:
Households: 261,273- In family households: 214,652 (47,484 male householders, 22,378 female householders)
52,173 spouses, 73,395 children (67,999 natural, 1,935 adopted, 3,461 stepchildren), 4,214 grandchildren, 2,063 brothers or sisters, 2,316 parents, foster children, 2,625 other relatives, 6,387 non-relatives
- In nonfamily households: 46,621 (18,056 male householders (13,616 living alone)), 19,139 female householders (15,978 living alone)), 9,426 nonrelatives
- In group quarters: 12,782 (5,482 institutionalized population)
43,726 married couples with children.
14,569 single-parent households (3,084 men, 11,485 women).
93.8% of residents of Ledyard speak English at home.
2.0% of residents speak Spanish at home (75% speak English very well, 21% speak English well, 4% speak English not well).
2.0% of residents speak other Indo-European language at home (82% speak English very well, 12% speak English well, 6% speak English not well).
2.0% of residents speak Asian or Pacific Island language at home (60% speak English very well, 28% speak English well, 11% speak English not well, 1% don't speak English at all).
0.2% of residents speak other language at home (94% speak English very well, 6% speak English well).
Foreign born population: 1,032 (6.3%)
(73.8% of them are naturalized citizens)
| Here: | 7.9 |
| State: | 6.5 |
| Here: | 4.3 |
| State: | 4.0 |

- Bedrooms in owner-occupied houses and condos in Ledyard, Connecticut
- 0no bedroom
- 771 bedroom
- 4432 bedrooms
- 2,2593 bedrooms
- 1,3574 bedrooms
- 2205+ bedrooms

- Bedrooms in renter-occupied apartments in Ledyard, Connecticut
- 0no bedroom
- 691 bedroom
- 5172 bedrooms
- 2253 bedrooms
- 1044 bedrooms
- 125+ bedrooms

- Cars and other vehicles available in Ledyard in owner-occupied houses/condos
- 117no vehicle
- 8171 vehicle
- 2,2952 vehicles
- 8783 vehicles
- 1534 vehicles
- 965+ vehicles

- Cars and other vehicles available in Ledyard in renter-occupied apartments
- 14no vehicle
- 4201 vehicle
- 3822 vehicles
- 893 vehicles
- 224 vehicles
- 05+ vehicles

- Rooms in owner-occupied houses in Ledyard, Connecticut
- 01 room
- 92 rooms
- 623 rooms
- 2474 rooms
- 5715 rooms
- 8506 rooms
- 9267 rooms
- 9188 rooms
- 7739+ rooms

- Rooms in renter-occupied apartments in Ledyard, Connecticut
- 01 room
- 272 rooms
- 463 rooms
- 3944 rooms
- 1295 rooms
- 606 rooms
- 1387 rooms
- 1108 rooms
- 239+ rooms


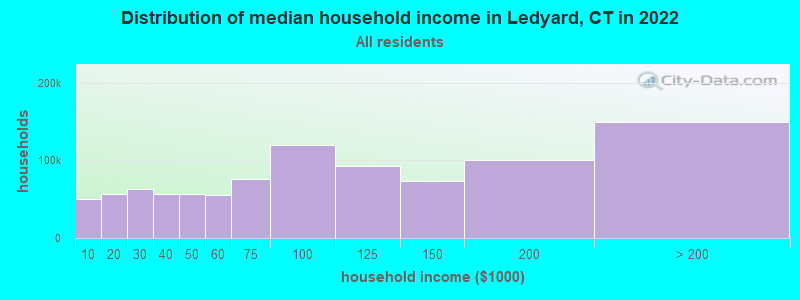
Ledyard, CT household income distribution

- 48,574Less than $10,000
- 54,984$10,000 to $19,999
- 62,004$20,000 to $29,999
- 55,314$30,000 to $39,999
- 55,159$40,000 to $49,999
- 53,884$50,000 to $59,999
- 74,927$60,000 to $74,999
- 117,261$75,000 to $99,999
- 90,763$100,000 to $124,999
- 72,462$125,000 to $149,999
- 98,958$150,000 to $199,999
- 146,697$200,000 or more
Percentage of workers working in this county: 95.0%
Number of people working at home: 1,430 (16.9% of all workers)
Travel time to work (commute)
- Less than 5 minutes: 168
- 5 to 9 minutes: 612
- 10 to 14 minutes: 1,060
- 15 to 19 minutes: 1,891
- 20 to 24 minutes: 1,823
- 25 to 29 minutes: 549
- 30 to 34 minutes: 554
- 35 to 39 minutes: 45
- 40 to 44 minutes: 71
- 45 to 59 minutes: 224
- 60 to 89 minutes: 200
- 90 or more minutes: 122
Means of transportation to work:
- Drove a car alone: 6,591 (88.3%)
- Carpooled: 611 (8.2%)
- Bus or trolley bus: 13 (0.2%)
- Subway or elevated: 8 (0.1%)
- Ferryboat: 7 (0.1%)
- Motorcycle: 1 (0.0%)
- Bicycle: 22 (0.3%)
- Walked: 27 (0.4%)
- Other means: 39 (0.5%)
- Worked at home: 144 (1.9%)

- Year of entry for the foreign-born population in Ledyard, Connecticut
- 721995 to March 2000
- 1051990 to 1994
- 1151985 to 1989
- 751980 to 1984
- 331975 to 1979
- 501970 to 1974
- 391965 to 1969
- 162Before 1965

First ancestries reported:
- English: 3,076 (16.1%)
- Irish: 2,842 (14.8%)
- Other: 2,620 (13.7%)
- German: 2,550 (13.3%)
- Italian: 1,887 (9.9%)
- French: 1,172 (6.1%)
- Polish: 788 (4.1%)
- French Canadian: 733 (3.8%)
- United States: 615 (3.2%)
- Scottish: 598 (3.1%)
- Scotch-Irish: 470 (2.5%)
- Portuguese: 360 (1.9%)
- Dutch: 192 (1.0%)
- Swedish: 192 (1.0%)
- Czech: 145 (0.8%)
- Russian: 139 (0.7%)
- Lithuanian: 115 (0.6%)
- Norwegian: 98 (0.5%)
- Hungarian: 94 (0.5%)
- Arab: 77 (0.4%)
- Greek: 75 (0.4%)
- Ukrainian: 69 (0.4%)
- Welsh: 69 (0.4%)
- Danish: 54 (0.3%)
- Swiss: 45 (0.2%)
- Slovak: 42 (0.2%)
- Subsaharan African: 17 (0.09%)
- West Indian: 13 (0.07%)
Most common places of birth for foreign-born residents (%):
| Ledyard: | 13.7% (89) |
| Connecticut: | 4.4% (16,395) |
| Ledyard: | 11.7% (76) |
| Connecticut: | 5.2% (19,083) |
| Ledyard: | 10.3% (67) |
| Connecticut: | 1.7% (6,247) |
| Ledyard: | 6.5% (42) |
| Connecticut: | 2.5% (9,358) |
| Ledyard: | 6.3% (41) |
| Connecticut: | 0.7% (2,692) |
| Ledyard: | 4.6% (30) |
| Connecticut: | 1.1% (3,919) |
| Ledyard: | 4.0% (26) |
| Connecticut: | 2.1% (7,612) |
| Ledyard: | 3.4% (22) |
| Connecticut: | 6.9% (25,507) |
| Ledyard: | 3.4% (22) |
| Connecticut: | 1.8% (6,680) |
| Ledyard: | 3.2% (21) |
| Connecticut: | 0.3% (983) |
| Ledyard: | 3.1% (20) |
| Connecticut: | 0.6% (2,106) |
| Ledyard: | 2.8% (18) |
| Connecticut: | 0.7% (2,742) |
| Ledyard: | 2.8% (18) |
| Connecticut: | 0.5% (1,983) |
| Ledyard: | 2.3% (15) |
| Connecticut: | 3.1% (11,432) |
| Ledyard: | 2.0% (13) |
| Connecticut: | 0.9% (3,472) |
| Ledyard: | 2.0% (13) |
| Connecticut: | 0.3% (1,180) |
| Ledyard: | 1.8% (12) |
| Connecticut: | 0.2% (566) |
| Ledyard: | 1.8% (12) |
| Connecticut: | 0.3% (1,058) |
| Ledyard: | 1.7% (11) |
| Connecticut: | 0.3% (1,224) |
| Ledyard: | 1.7% (11) |
| Connecticut: | 2.1% (7,596) |
| Ledyard: | 1.5% (10) |
| Connecticut: | 1.0% (3,822) |
Place of birth for U.S.-born residents:
- This state: 6,163
- Other state: 7,733
- Northeast: 4,504
- Midwest: 998
- South: 1,426
- West: 805
61% of Ledyard residents lived in the same house 5 years ago.
Out of people who lived in different houses, 61% lived in this county.
Out of people who lived in different counties, 8% lived in Connecticut.
Education attainment for males 25 years and older:
- No schooling: 17
- Nursery to 4th grade: 9
- 5th and 6th grade: 0
- 7th and 8th grade: 31
- 9th grade: 34
- 10th grade: 86
- 11th grade: 44
- 12th grade, no diploma: 83
- High school graduate (or equivalency): 1,331
- Less than 1 year of college: 300
- Some college more than 1 year, no degree: 615
- Associate degree: 351
- Bachelor's degree: 995
- Master's degree: 495
- Professional school degree: 101
- Doctorate degree: 117

Education attainment for females 25 years and older:
- No schooling: 15
- Nursery to 4th grade: 0
- 5th and 6th grade: 37
- 7th and 8th grade: 21
- 9th grade: 25
- 10th grade: 71
- 11th grade: 25
- 12th grade, no diploma: 128
- High school graduate (or equivalency): 1,500
- Less than 1 year of college: 389
- Some college more than 1 year, no degree: 782
- Associate degree: 495
- Bachelor's degree: 845
- Master's degree: 389
- Professional school degree: 129
- Doctorate degree: 50


Housing units in structures:
- One, detached: 4,659
- One, attached: 112
- Two: 36
- 3 or 4: 290
- 5 to 9: 157
- 10 to 19: 16
- 20 to 49: 15
- Mobile homes: 198
Median worth of mobile homes: $67,337

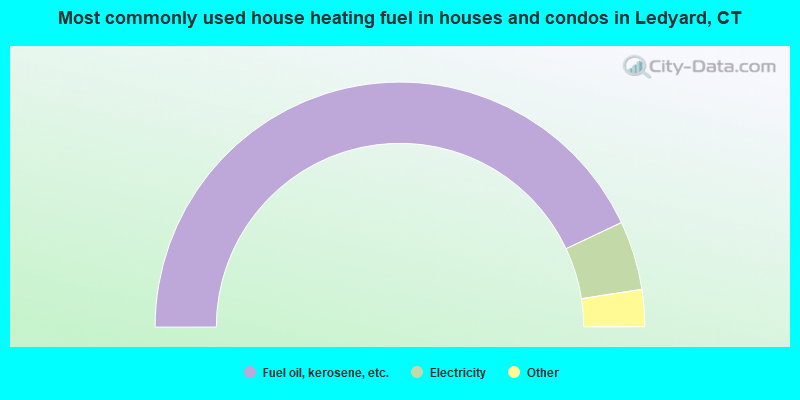
- 86.0%Fuel oil, kerosene, etc.
- 9.1%Electricity
- 2.1%Wood
- 1.2%Bottled, tank, or LP gas
- 0.9%Utility gas
- 0.4%Coal or coke
- 0.3%Other fuel
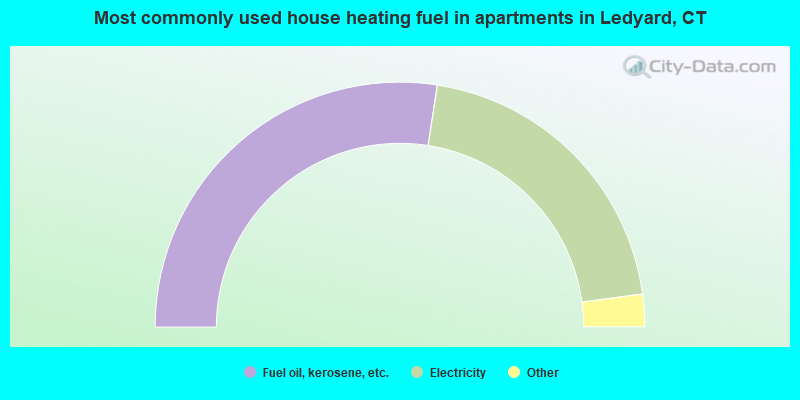
- 54.9%Fuel oil, kerosene, etc.
- 40.8%Electricity
- 2.8%Bottled, tank, or LP gas
- 0.9%Wood
- 0.6%Utility gas
Private vs. public school enrollment:
| Here: | 3.9% |
| Connecticut: | 9.9% |
| Here: | 4.6% |
| Connecticut: | 11.0% |
| Here: | 22.7% |
| Connecticut: | 33.4% |


